
Dental Commissioning Statistics, England – September 2015
These statistics show the volume of units of dental activity (UDAs) commissioned by the 13 Regional Teams as at the end of each quarter, for the upcoming 12 months.
The figures are broken down into two groups:
- UDAs commissioned where the dental service is being provided;
- UDAs commissioned in contracts not yet delivering services (for example, UDAs in new contracts, where the contract has been signed but the dental activity has not yet started).
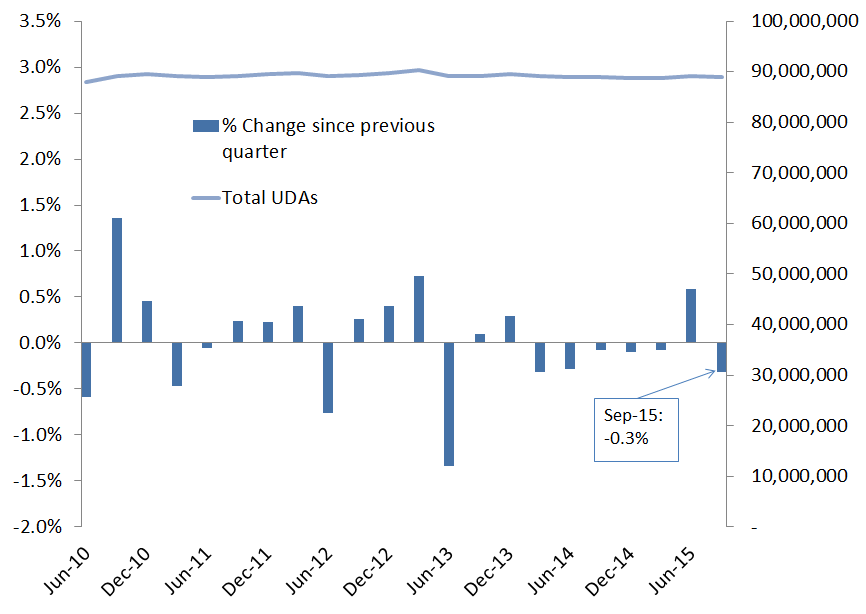
Key findings this quarter:
- 89.0 million UDAs had been commissioned as at 30 September 2015.
- This is a decrease of 279,000 (-0.3%) compared to UDAs commissioned the previous quarter, and 80,000 higher (0.1% increase) compared to the previous year.
- UDAs commissioned but not yet delivering services represent 0.01% (13,000) of all UDAs commissioned this quarter.
Download Data
Dental Contracts Statistics:
Dental Commissioning template 2015-09 (XLSX, 15kb)
Dental Commissioning template 2015-09 (CSV, 2kb)
Previous publications
http://www.england.nhs.uk/statistics/category/statistics/dental-commissioning/