We want to hear from you. Help us understand your digital experience by taking part in our user research. Find out more now.

1. Introduction and methodology
The NHS Patient Survey Programme is delivered by the Care Quality Commission (CQC) on behalf of NHS England and the Department of Health and Social Care. The Survey Coordination Centre at Picker coordinates the NHS Patient Survey Programme on behalf of CQC. There are 5 surveys within the Programme: adult inpatient, maternity, children and young people, community mental health and urgent and emergency care surveys.
This report has been produced by Solutions Strategy Research Facilitation Ltd (Solutions Research) and NHS England to share national insights from qualitative thematic analysis of written responses provided by respondents that took part in the NHS Patient Survey Programme. The aim of this endeavour is to identify opportunities for learning and improvement through an in-depth understanding of experiences of care.
The focus of this report is on the Adult inpatient survey 2024, which captured feedback from 62,444 adults, who stayed in hospital for at least one night for tests, medical treatment or surgery during November 2024. All data was collected between January and April 2025.
Further information on the survey is available on the CQC website.
Qualitative data analysis
Three open questions were included in the survey allowing respondents to use their own words to respond. The questions were positioned at the end of the survey and included the instructions as follows: ‘If there is anything else you would like to tell us about your experiences in the hospital, please do so here.’
Respondents were then invited to write into a box about their experience, with the following questions posed:
- QA: ‘Was there anything particularly good about your care?’
- QB: ‘Was there anything that could be improved?’
- QC: ‘Any other comments?’
To ensure a robust approach a purposive sampling method was used for thematic qualitative analysis:
- QA: 686 comments were analysed as a sample from 35,562 viable comments
- QB: 691 comments were analysed as a sample from 30,660 viable comments
- QC: 686 comments were analysed as a sample from 19,592 viable comments
Once the total sample of 2,063 comments had been analysed it was seen that data saturation had been reached i.e. no new themes were emerging from the data. Had this not been achieved, additional comments would have been added to the sample as necessary, in line with best practice in qualitative analysis. Further detail can be found in Appendix 5: Methodology and Appendix 6: Sampling approach.
Use of illustrative quotes
Throughout the report, quotes are included to illustrate respondents’ experiences in their own words and substantiate the findings. Please note that the data is not edited in the interests of correct spelling and punctuation for example, to stay as true to the words of respondents as possible.
A summary is shared below of the information that has been removed:
- Names of patients or staff replaced with “[name]”
- Names of wards, units or hospitals replaced with “[location name]”
- Names of specific services replaced with “[service name]”
- Specific dates replaced with “[date]”
There is a degree of duplication in the use of quotes in this report to substantiate insights. This reflects that written feedback is often complex in that it is rich in detail and spans several parts of patients’ care journey, providing a depth of insight as to several themes and/or sub-themes.
Use of quantitative data
Where possible in the findings section, themes are presented in context of the most relevant quantitative survey data. This allows for insights to be considered more holistically and to provide a greater opportunity for reflection and learning.
Context to support interpretation
Many responses to the open questions were very short – often a few words or a single phrase. This limited the depth of insight possible and means that findings should be interpreted with an understanding that the qualitative dataset did not consistently provide detailed explanations or examples.
Some comments contained racist language directed towards staff. While these did not provide sufficient detail to be analysed as a thematic finding, their presence is noted here as important contextual information reflecting the conditions in which staff deliver care – and the environment in which patient feedback is generated.
2. Headline findings
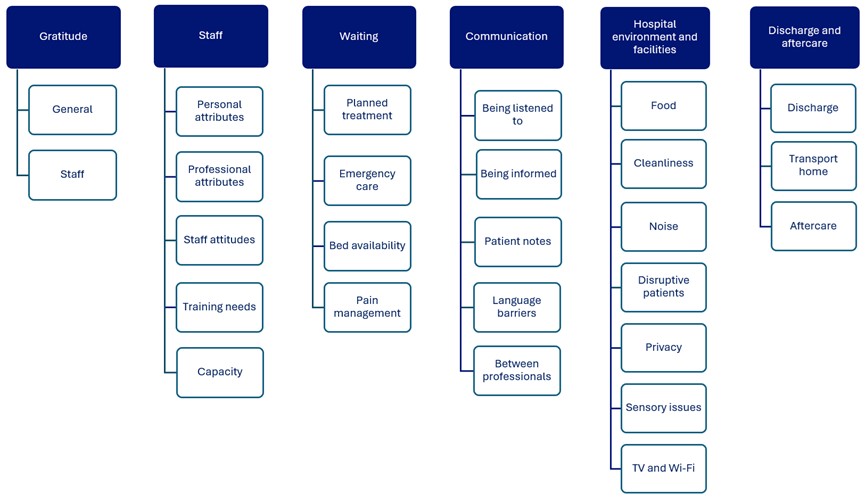
Image text:
Gratitude
- General
- Staff
Staff
- Personal attributes
- Professional attributes
- Staff attitudes
- Training needs
- Capacity
Waiting
- Planned treatment
- Emergency care
- Bed availability
- Pain management
Communication
- Being listened to
- Being informed
- Patient notes
- Language barriers
- Between professionals
Hospital environment and facilities
- Food
- Cleanliness
- Noise
- Disruptive patients
- Privacy
- Sensory issues
- TV and Wi‑Fi
Discharge and aftercare
- Discharge
- Transport home
- Aftercare
3. Thematic analysis findings
Key themes
Six key themes were identified from the thematic analysis, listed below. Within each key theme are several sub-themes which support with interpretation and use of the insights. There are 24 sub-themes in total.
- Gratitude
- Staff
- Waiting
- Communication
- Hospital environment and facilities
- Discharge and aftercare
This section of the report contains the detail of each theme with a range of quotations shared to substantiate and exemplify the experience of respondents using their own words.
Theme: Gratitude
What does the quantitative survey data tell us?
- 52% rated their overall experience of inpatient care a 9 or 10 where a score of 0 represented a ‘very poor experience’ and a 10 a ‘very good experience’ (Q48)
- Of respondents who left a viable comment, 54% rated their overall experience a 9 or 10 (Q48)
Many comments made across the three open questions asked in the survey were expressions of gratitude for the care patients had received.
General
While there was a substantive volume of gratitude, the feedback largely lacked detail or specifics about what created a good experience, with patients simple saying they were happy or that everything was ‘good’.
“I am thankful to the care I received.”
“Very good – thank you.
“Thank you NHS for the great service you provided.”
“I was only in for a few days and the care was superb.”
“I had excellent care.”
“Very pleased with the service that I was given”
Staff
Where further detail was provided in feedback, patients directed their gratitude towards staff either broadly or to specific teams involved in their care.
“I can only add how relaxed I was made to feel but such a wonderful team of doctors nurses and all the members of staff I came into contact with I honestly couldn’t give the whole team praise an thanks. 😊 x”
“Great staff and excellent care. Thank you.”
“I appreciate the efforts of the doctors and nurses who made my stay comfortable.”
“Ward 10 [location name]. Good experience, well done, I like to thank all staff.”
“Staff were excellent”
“All members of staff did their best to make patients feel comfortable. Very caring team, thank you.”
“The doctors and nurses were excellent in their care of me.”
“All the nurses that took care of me (medicine/ wound changes etc) were wonderful.”
“I can not fault the care I was given by any of the staff whether it was student nurses, ward sisters or Dr’s and consultants even house keepers and care assistants”
“The pre- operative care from the surgeon, anaesthetist and nursing staff was exceptional.”
It was observed in the comments that individual staff were singled out by some patients by naming them before highlighting specific qualities that drove the positive interactions. These comments most often link to the ‘being informed’ and ‘aftercare’ sub-themes later in this report with the common thread that staff providing clear information with compassion was highly valued.
“Excellent care throughout, starting with the Surgeon’s [name] Secretary; incredibly efficient. If [name] said she would ring you back, she did. I was kept well informed. The Surgeon, was excellent; very personable and informative.”
“[name], my nurse who was on ward with me, was a warm and caring woman who made my stay much easier, and when taking bloods and doing observations she was humorous and explained everything to me clearly and compassionately.”
“Having my hip replacement at a centre of excellence. The lady [name] who did my follow up appointment was fantastic and explained everything to me.”
Theme: Staff
What does the quantitative survey data tell us?
- 80% reported ‘always’ having confidence and trust in the doctors treating them (Q18)
- 78% reported ‘always’ having confidence and trust in the nurses treating them (Q21)
- 80% felt they were ‘always’ treated with kindness and compassion while in hospital (Q46)
- 82% felt that they were ‘always’ treated with respect and dignity while in hospital (Q47)
- 60% felt that they were ‘always’ able to talk to hospital staff about their worries and fears (Q27)
Staff were pivotal to the patient experience, with feedback demonstrating how each individual staff member plays an important role and can have a meaningful impact.
Personal attributes
Comments about staff often referred to their personal qualities which were seen to support high-quality care experiences. Patients valued compassion, kindness and helpful attributes as these were reassuring, with humour also often mentioned.
“The staff were empathetic to our needs and did everything in their power to make us comfortable.”
“Some very kind people – doctors and nurses.”
“Staff very helpful.”
“All staff were professional, kind and caring with a little bit of humour thrown in which helps.”
“The nursing staff are all wonderful. Doing their best with compassion & humour & knowledge.”
“The nurses and doctors were really nice and they helped me a lot. All staff were amazing, nothing too much trouble. Very friendly and happy to help.”
“The nurses were very kind and encouraging.”
“Dedication and kindness of the nursing staff.”
“Fantastic staff, compassionate and funny. I am grateful that I was looked after well in my ward.”
“Was treated with respect and dignity. [name] who transferred me from resuscitation to ward 35 was extremely nice and caring. The staff on the ward were amazing.”
“Everything was perfect , attentiveness, care and respect.”
“A young nurse I saw when admitted to ward met me in the corridor the next day when I was discharged from another ward and asked me how everything had gone. Real care and interest!”
“I thought the nurses who cared for me were compassionate and caring… They were constantly asking me to press the bell if I need them, they kept popping in to check on me when they did not need to.”
A few patients highlighted small acts of kindness, not related to treatment, which were notable and for which they were grateful. In the analysis these stood out as they were the sole comment made by these patients on what was good about their care.
“All of the nurses were so lovely and friendly. One gave me a small overnight bag of toiletries, knowing that I would staying and didn’t have the resources with me.”
“It was my birthday and after evening meal I was presented with a lovely cake how kind was that.”
Professional attributes
Comments about staff professionalism, knowledge and competency were often paired with comments about personal attributes. Positive experience of staff being professional created confidence and trust in the care being received.
“Knowledge and professionalism of staff is very good.”
“The fully qualified nursing staff were exceptionally well trained, knowledgeable, committed and compassionate.”
“The medical staff was professional and attentive, ensuring that I received the necessary care.”
“There was one nurse in particular who was outstanding and went above and beyond, her name was [name]. [name] and his team were professional, compassionate and made me feel incredibly safe in their capable hands.”
“I feel the doctors were very thorough in checking for all possibilities of the cause of my illness as it was hard to diagnose. It made me feel reassured they had checked for everything before I left hospital.”
“The staff was very helpful and very professional”
“The majority of staff are blessed with a good sense of humour given the difficult job that they do in difficult conditions . They all go about their tasks with a high level of professionalism and integrity.”
Staff attitudes
In contrast to the positive experiences, patients reporting negative interactions with staff highlighted how important staff attributes could be in defining the care experience. Some comments shared experiences where patients felt staff were unfriendly, impersonal or dismissive.
“Some staff members were abrupt and shown very little interest.”
“Nursing staff showed little or no compassion to patients, more interested in getting their jobs done by a ” Tick box process.”
“No human contact, reassurance, felt a bit like a machine being checked over, as if I only existed on your database.”
“There was a male nurse staff – just checking the drip and giving me medication…Due to the medication and I felt confused, my body wanted to move and he saw me swinging my legs on the side of the bed. He said that would affect my operation, so I stopped. When he was leaving the ward, he said loudly “she just arrogant”. I felt judged and misunderstood. When I next saw him, I apologised to him and said sorry to make you worry and reassured him I wouldn’t do it again. The next time he saw me…he would not acknowledge my presence (like he used to) when he was greeting other patients.”
“I felt like the assistant surgeon was very rushed to give me an update and didn’t have time for me, and that I didn’t have a lot of time to ask follow up questions in the 2 minutes I had with her.”
“I find consultants vary hugely – some make you feel listened to and the reason they are there, to care for you, however others are very dismissive, rude and make you feel like a hinderance.”
“The person who took the orders for the meals needs to be friendly to patients, miserable. seemed to hate her job.”
Within the feedback were references to ‘bedside manner’ which was sometimes used without clarity on what this meant to the patient, though some examples show it includes manners, listening and personal attributes such as empathy.
“Better bedside manner – it was clear the bed was needed so I was told to go home less than 24hrs after coming to the ward!”
“A very tiny minority of staff could improve their bedside manner.”
“The basic bedside manners of some of the staff i.e. nursers.”
“One deputy sister on [ward name] could benefit from additional training on bedside manner”
“Doctors and consultants have poor bedside manners. Speak to at you and not asked your opinion.”
Training needs
Feedback included calls for better staff knowledge and/or training. Comments shared a view that staff were inexperienced or lacked the necessary expertise for the work they were doing, with some specific references to students or newly qualified staff. Examples of training needs included patients observing difficulties with catheterisation, cannulation and blood sampling.
“There was a new qualified nurse on one of my wards. She was being shadowed but she was not competent or confident. She was looking after a very poorly lady, and she rarely interacted or communicated with her. How she became qualified baffles me.”
“There were too many student/not fully trained nurses. It created multiple problems, including a scan being done incorrectly which resulted in my being left in excruciating pain for hours, this was also exacerbated by the fact that the nurse in charge of the ward was not confident in providing the catheter I needed and so put it off for hours.”
“Some nurses I dealt with seemed completely lost and inexperienced and I’ve never really experienced that in a hospital before – nurses who couldn’t do simple tasks like like take blood or install a canulla.”
“Feel that all hospitals and nurses should be trained in accessing ports and pic lines as it is difficult to get blood from me due to chemotherapy. As they weren’t trained, it took way too many attempts to get blood which was very uncomfortable and painful for me.”
“Teach staff how to insert a canula properly. Everyone thought they knew how to – especially the doctors and critical care nurses – but they don’t always and it leaves a patient dreading the next pathetic attempt to shove it in no matter what.”
Capacity
What does the quantitative survey data tell us?
- 65% reported being able to ‘always’ get a member of staff to help when they needed attention (Q30)
- 58% reported there were ‘always’ enough nurses on duty to care for them (Q23)
Explicit mentions were made of the pressures facing staff regarding capacity. Some comments demonstrated well how observations of low staff capacity can lead to even greater appreciation of positive experiences with staff when patients had experienced first-hand the challenges the NHS workforce can face. In the examples it was acknowledged to be a systemic problem and not a criticism of individual staff members.
“Staff are clearly committed and passionate about giving care but are being stretched too thinly. Impossible number of tasks for individuals to complete in a shift.”
“Staffing levels were stretched – more staff would have been better.”
“All was good thank you, although sometimes I could see that the staff were hard pushed.”
“My only complaints are that they need more nurses and HCA’S [health care assistants].”
“Even though nurses and drs were understaffed, it never impacted on my care.”
Feedback which incorporated mentions of staffing levels and numbers being too low included some patients sharing further detail as to how this could impact on experiences of care. Examples included a lack responsiveness and delays, from missed call bells to periods of waiting, attributed to staff shortages.
“The only thing I would’ve liked was a visit from my surgeon himself post surgery, rather than one of the assistant surgeons telling me how things went. Or, alternatively, I would’ve just liked it if it didn’t feel so rished. I felt like the assistant surgeon was very rushed to give me an update and didn’t have time for me, and that I didn’t have a lot of time to ask follow up questions in the 2 minutes I had with her. I worry a bit she missed on giving me important info as she was so rushed.”
“When I did see the consultants, they were very helpful – though this was not frequent.”
“Shortage of staff, long periods of time for call bell to be answered.”
“Not a lot of nurses available during the night shift so when blood needed to be taken it was difficult for them to transport the blood to get tested. also a struggle when they couldn’t get blood and there was no one else to take over.”
“Need more doctors. Too slow due to doctor shortage.”
“There was only one qualified nurse on duty, which is fine for an overnight stay on a day surgery ward but woefully lacking for an A&E overflow ward. I felt really sorry for her, she was rushed off her feet, stressed and tearful.”
“Long periods of time for call bell to be answered. Not enough help given to improve mobility. No one really available to discuss my concerns with always very busy with apparently other more urgent needs patients.”
Observations were made of pay and working conditions for staff, with some patients suggesting this as an area to improve based on their desire to see staff rewarded.
“More staff are needed, more beds and more resources in the community to facilitate discharge plus virtual wards when step down care needed and better primary care access. Protected breaks and annual leave for staff with access to support when needed to prevent burnout.”
“Hospital staff – doctors, nurses and ancillary staff should get a huge pay rise.”
“Yes more nurses and better pay for them.”
“Nurses pay and the number of staff. Basically better all round conditions for them to do their amazing work.”
“The medical staff deserve more pay – they do such a good job.”
Theme: Waiting
What does the quantitative survey data tell us?
- 74% of respondents reported their most recent overnight hospital stay was an ‘emergency’ (Q1)
- Of those whose most recent hospital admission was ‘waiting list or planned in advance’, 58% reported that they ‘did not mind waiting as long as I did’ when asked how they felt about the length of time on the waiting list before admission to hospital (Q2)
There was negative feedback shared about the experience of waiting. This theme demonstrates that the experience of waiting, both prior to and within hospital settings, is very diverse, individual and context specific for patients.
Emergency care
There was negative feedback shared about the experience of waiting for an ambulance and/or to be seen in accident and emergency (A&E). Patients did not always clarify which part of the experience required them to wait. When shared, examples varied and included being transferred from ambulance and waiting for assessment or triage.
“The lenth of time that I had to wait for the ambulance after my fall.”
“After falling and suffering a head injury it took three hours for an ambulance to arrive.”
“I was in the ambulance for 5 hrs, they were brilliant nurses on the ward was very good.”
“Less time taken from being transferred from ambulance into A&E once ambulance had arrived at hospital.”
“I was first taken to A&E by ambulance … They thought I needed a scan…. I waited 11 hours to be seen by a doctor in A&E. I was in pain and constantly vomiting”
“Once at the hospital it took another hour and a half to be admitted to A&E.”
“Two visits to A&E before i could be admitted to the neurology ward. My first visit was over 12 hours waiting, even though I’d only been discharged after an operation for brain tumour 24 hours earlier.”
“Given that [location name] had spoken full details of my condition to [location name] prior to my transfer, I expected to be admitted straight to a ward rather than have to go through A&E.”
Among those who commented on their experience, there lacked consistency as to what would be considered a reasonable timeframe for waiting. Some comments explicitly referred to their wait time as unacceptable, while others stated that they wanted to have been seen ‘quicker’ and highlighted waiting time as an area for improvement.
“14 hours sitting in A & E is not acceptable.”
“Quicker triage through casualty, to prevent serious problems occuring.”
“Yes! Waiting for over 12 hours on a corridor is dreadful. No one should have to experience this.”
“I waited 25 hours in A and E and would have valued quicker triage and examination.”
“I was initially told to report to A&E for an urgent scan and arrived 6.30pm. I had few updates on this and sat up all night and had the scan about 14 hours later. I then was sent back to A&E to await results which came about 2 hours later.”
“waiting time in emergency worst experience EVER.”
Bed availability
What does the quantitative survey data tell us?
- 35% reported they ‘did not have to wait’ to get to a bed on a ward, after arriving at hospital (Q5)
- 53% of patients who had to wait to be admitted onto a ward did so for 6 hours or more (Q7)
Feedback included examples of waiting for a bed, which further demonstrated there was variation amongst patients as to what was considered a ‘long’ wait. Patients shared diverse examples of the impact of issues with bed availability, which included among others, moving wards, delays to surgery, and being treated in corridors.
“I was 17 hours on trolley in corridor, no mobility at all. Admitted to ward [name] 7.50pm. Doctor came to do bloods etc. midnight; told me she would make a plan. Different doctor saw me midday [following day] and told me I could go home. He had no knowledge that I’d had a knee replacement.”
“Less time waiting for a bed.”
“Have a bed ready, have a system in place that works when nurses request beds.”
“I was moved into a new ward after my operation and this was delayed as there were no beds available.”
“I waited to go on the ward for around 6 hours and then there were no beds so had to spend the night on a trolley.”
“Waiting time for a bed was too long. Waited 131/2 hours for a bed on a ward. Quite traumatising.”
“Yes admission to the ward quicker so I could rest and receive treatment.”
“I had been preparing to be an inpatient. Was called 16 hours before my surgery to say there wasn’t bed space and I would have to be a day case which was extremely stressful and made me worry about the quality of care I would receive.”
“I moved bed space on the ward 3 times over night, the third time was in a corridor for about an hour waiting for the bed space I was going into to be cleaned, which was quite disruptive.”
“I did not get to go in the hospital I was in the ambulance all night and was treated in there as there was no beds available.”
Surgery
Feedback from those who were admitted for planned surgery shared their negative experiences while on a waiting list. Patients could describe this as a stressful time for them, with examples of waits for over a year before being called for surgery then at short notice.
“Shorter waiting times between diagnosis and operation.”
“It took a very long while for me to get my operation. I was in acute pain for a year.”
“Shorten the waiting time for surgery…In [date], I was diagnosed to have narrowing of the lad of the coronery vessel in [location name] and referred to [location name]. I was given a date in [date] for surgery. Before this day, in [date], it was found that the hepatitis B virus was activated by the Startin I was taking and the surgery (angio-plasty) had to be post-poned to [date].”
“The waiting list experience and the nature in which patients are booked for surgery is really stressful. You’re on a waiting list for over a year and then suddenly expected to be ready for surgery with less than 1 weeks notice.”
Respondents expressed frustration at delays to planned surgery which resulted in long waits once in the hospital. This could be exacerbated by having to abstain from food and drinks.
“I signed in at 7am and wasn’t called for surgery till 5.00 I think 10 1/2hrs is to long.”
“The wait for my admission was unacceptable, I had had no food from 3pm the day before my stent fitment, and after waiting from 7pm until 00.15am to get a bed, it was too late to eat. Therefore I hade no food until the next morning.”
“I checked into the treatment centre at 6:05am fasting from midnight for my knee replacement operation. I was told I was third in line. Around 4pm I was told that there had been a medical emergency hence the delay.”
Pain management
What does the quantitative survey data tell us?
- 76% said that staff ‘always’ did everything they could to help control their pain (Q29)
Waiting for pain relief was highlighted as an area for improvement in the patient feedback. Examples demonstrate how distressing this could be for patients, and they expressed frustration when pain medication wasn’t offered or timely. It was unclear in feedback where in the journey these issues had been encountered at the hospital.
“Why did I start to feel like I was pestering just to get some pain relief.”
“On certain occasions I asked for pain relief and they would maybe forget untill I was in unbearable pain till I started crying that’s when I would get pain relief.”
“I was blatenly lied to about medication. Not given pain relief at correct times.”
“Making sure correct pain relief is prescribed and making sure that the dosage matches what is taken at home. When asking for pain relief making sure it’s given in a timely manner.”
“There were too many times i was left in extreme pain, that would leave me in pain crying out for help. The response was always delayed, with some nurses having no urgency or addressing me as though i was overreacting.”
“On arrival at A&E I saw a doctor who said I needed a cannula and IV pain relief. He left the cubicle, never to be seen again. A few hours later a man and woman could be heard beyond the curtain arguing over whose responsibility it was to put in a cannula. Several hours later I was moved to a corridor somewhere. I felt this is so staff did not have to hear me almost screaming and delirious with pain. Eventually, I was given morphine after a cannula put in. I had been in extreme pain since 9.00am. Finally, was given pain relief at about 5pm!”
Theme: Communication
What does the quantitative survey data tell us?
- 76% felt that when doctors spoke about their care in front of them, they were ‘always’ included (Q19)
- 77% felt that when nurses spoke about their care in front of them, they were ‘always’ included (Q22)
- 37% reported that staff involved them in decisions about their care and treatment ‘a great deal’ (Q25)
- 61% said they had ‘never’ been told something by a member of staff that was different to what they had been told by another member of staff (Q24)
Feedback on communication was predominantly negative and highlights the important role it has in building trust and confidence through patients feeling they are involved and able to engage with those making decisions about their care.
Being listened to
Negative feedback on communication with staff focused on patients not feeling listened to. Examples focused either on medication or feeling concerned that opportunities had been missed when the patient did not feel that their voice was heard in decision making about their treatment and care.
“A nurse would only give me Paracetamol for pain. I told her they make me constipated, she kept saying they did not. I kept asking the doctor how should my tummy feel, he said I’ve told you before and walked off. He discharged me as the diarrhoea had stopped, I was extremely constipated. I was rushed into [location name] … 7 days later.”
“On arriving on ward nurse put me on penicillin drip although I explained I was allergic. Next day I came out in rash. Another nurse quickly changed drip to another antibiotic.”
“One (brilliantly attentive) nurse told me to decline any morphine when moving to next ward as it made me very very sick. She told me they would gove me alternative medication. Upon getting to next ward they told me i had to have morphine and needed to stop resisting. I ended up having it and was very poorly.”
“Listen to patient – don’t brush off because old – I accept understaffed, overworked, dependent on foreign staff with no English. Should have listened to first student radiographer who was brushed off by senior and the month of pain discomfort, and finally agony crawling on floor needing 3rd admission, could have been prevented.”
“The initial nurses/doctors I saw when I came in completely did not listen to me. I tried to explain how I had back pain and lost control of my bowels and bladder (been sent for [Location] Urgent Care). 6 hours later being stood in a cold corridor due to no seats available, I was told I was going home and I had a tummy bug.”
A noteworthy exception demonstrates that there is a need to consider how to balance patient involvement to ensure confidence in treatment decisions. In this example, the patient felt they were being asked to decide about medication which they deemed inappropriate.
“Night nurse asked whether I wanted the anti-nausea injection to go with the other medicines I was being given against pain. She should not have left it up to me – I didn’t know, said no to reduce number of meds, but was then vomiting. Some things medical staff should know better than patients and then just administer. Or at least strongly suggest one takes the medically recommended route.”
Being informed
The importance of clear explanations and feeling fully informed about treatment was evident in feedback about communication with staff. In positive comments, patients emphasised the value placed on transparency and ongoing communication as key to feeling informed.
“Excellent care throughout, starting with the Surgeon’s [name] Secretary; incredibly efficient. If [name] said she would ring you back, she did. I was kept well informed. The Surgeon, was excellent; very personable and informative.”
“My consultant surgeon not only did a good job at the time, but she took time to explain my condition and treatment options beforehand. Also straight answers to my questions both before and after surgery.”
“The care of the orthopaedic consultant [name] especially in explaining the complex options for my shoulder surgery was excellent and the care pops opcare on the trauma ward was very good.”
“I had surgery which was great and all information was explained to me in detail so I was pleased, so all in all it was a great experience.”
“the surgeon visited to enquire of my wellbeing in the theatre the surgeon told of the procedure & the roll of the team and what would happen after the operation.”
“The Doctors are very professional, they always come to visit us everyday and asked questions about things concerning about conditions.”
“All of the staff I encountered kept me well informed as to what treatment I would be receiving and any amendments to that treatment.”
“[name], my nurse who was on ward with me, was a warm and caring woman who made my stay much easier, and when taking bloods and doing observations she was humorous and explained everything to me clearly and compassionately.”
While negative comments gave less detail, they demonstrate the importance to patients of feeling informed about their care. Examples covered a wide variety of situations and elements of the care journey, including surgery, urgent and emergency care, in and out of hospital, and aftercare.
“The biggest issue for me was mis-inforamation which leads to unnecessary stress and anxiety. Communication basically stops after 4pm in the day until the morning shift begins and you are left in limbo wondering what is happening with your careplan.”
“Discussion or explanation regarding the change in surgical procedure.”
“Doctor could have taken time to explain my condition and treatment plan. Plus explain the medication I had and why.”
“Doctors were sometimes very uncommunicative”
“More information if possible about treatment.”
“Too many tasks trying to be done at breakfast. Ive food, pils, blood tests, blood pressure, doc visit etc one day 8-10 people all speaking at once, trying to do job, then you see no-one for next 23/12 hrs.”
“A & E staff could be more effectual in letting patients know progress and waiting time before they will be seen.”
“Should have been given more information about my condition and how to manage it.”
Patient notes
Patients shared examples in areas for improvement that evidenced administrative errors in patient notes. This included observations of inaccurate or incomplete documentation, or where staff were seen to have not engaged with a patients’ notes.
“Communication needs a big improvement. Between staff, staff and patients/family, between wards and between hospitals. Written notetaking was an issue where staff could not read or interpret the situation.”
“READ THE CORRECT NOTES FOR PATIENT.”
“My discharge notes were inaccurate.”
“My ECG notes were lost. They should not be on paper but on the IT system.”
“Have consultants at least look at a patients notes before attending them.”
Language barriers
Occasionally, feedback included patients who had struggled to understand staff due to language barriers and/or accents.
“Sometimes struggling to understand staff due to language barriers and them sometimes not understanding what is being asked.”
“I struggled to understand some of the nurse team both pre and post op. It also took them quite a while to come and check in on me when I was out on the ward. I was ok with that but a lot of others may not have been.”
“Sorry to say this, and I appreciate my care, but better spoken English.”
“Occasionally it was difficult to fully understand what they were saying as their accent was difficult and their English not clear.”
“Their [in]ability to communicate in English.”
“Teaching staff to speak English.”
“Definitely! Communications with nurses with English as a second language was a barrier.”
Between professionals
Communication between professionals was raised as an area for improvement. Examples shared included between hospitals, between GP and hospital, and between professionals within the same hospital. A range of impacts were observed in the feedback which included a lack of confidence in decisions due to conflicting information from staff and more negative consequences such as making medication decisions for themselves.
“There was never enough information passed on from hospital to hospital, even staff and doctors wouldn’t be fully aware of your medical issues.”
“Communication between [location name] + [location name] hospital.”
“Felt a little isolated like the nurses didn’t understand my needs fully as I was transferred from another hospital 4 weeks after my accident”
“There were also conflicting views about the medication I should take after treatment from the surgeon, and the stroke clinician. I was released into GP care, and have had NO contact from them at all, so have been self medicating as 111 just said contact your GP.”
“Lack of communication between initial gynaecologist I saw and first consultant.”
“The only issue I feel worth mentioning is communication between nursing and medical staff, to be perfectly honest there isn’t any. They work in complete isolation which means nursing staff are not included in the discussions during morning ward rounds so have limited knowledge of sudden changes to patients treatments unless and until they read the notes on the computer.”
“I was 17 hours on trolley in corridor, no mobility at all. Admitted to ward [name] 7.50pm. Doctor came to do bloods etc. midnight; told me she would make a plan. Different doctor saw me midday [following day] and told me I could go home. He had no knowledge that I’d had a knee replacement.”
“The virtual people who read my results every day for my blood oxygen kept ringing me back every day to see if it was correct as it was low. Surely it should have been put on my notes as it was low whilst I was on the hospital ward. My husband had to take me to [location name] for a blood oxygen test and the staff on the sec ward did not appear to know much about the virtual ward.!!!!”
Theme: Hospital environment and facilities
Predominantly, the hospital environment and facilities were discussed in negative terms and there were lots of suggestions to improve the experience. It is noteworthy that for many respondents this formed the sole focus of their feedback. This indicates that the environment and facilities while inpatient play a crucial role and have a lasting impact.
Food
What does the quantitative survey data tell us?
- 48% reported they were ‘always’ able to get hospital food outside of set mealtimes (Q15)
Food was a common focus of feedback and was predominately negative. There were comments expressing dissatisfaction with both the choice and quality of the food available during their stay in hospital. This included calls for access to a wider range of food through vending machines.
“The food supplied by the hospital needs a great deal of improvement. When it is served it looks unappetising and tastes disgustingly bland, also, it was only lukewarm at best.”
“Healthy choices on food menu are lacking.”
“Yes, food was terrible and always tasted same. Awful. Was so bad I came out of hospital 1 1/2 stone lighter as just couldn’t eat it!”
“The food was atrocious – cold and inedible.”
“Food. Meals were very bland and tasteless. Tea was abominable!”
“Meals, i was given mashed potato every day twice a day for 5 days with every meal, Which led to constipation, Menu was very limited everything had mashed potatoes.”
“Having healthier options in the vending machines would make a big difference, particularly in the evening when the hospital’s coffee shop is closed. It was quite challenging to find something to eat or drink.”
“Having more vending machines throughout the hospital, I know this seems insignificant but more variety of drinks specifically Sprite or 7-Up.”
Limited food options were highlighted by patients who had dietary requirements, such as patients with allergies, who were vegan and those with health conditions.
“Better understanding of diet and allergies giving better food choices.”
“I have Coeliac disease, which means that I adhere to a strict gluten-free diet. Despite this being in my records and my declaring it on the preadmission forms, at the pre-op assessment and on admission to the hospital on the day of my procedure, when I reached the recovery ward there was no food available that I could eat and the caterers had gone home. All I had to eat in 36 hours was an apple and orange left over from someone else’s meal. Having said this, the following day I found the gluten free options on the meal menue to be excellent, just not available when I needed them.”
“Food was a slight problem, I’m on a low residue diet so choice of meals was very limited.”
“I was vegan and was not given any food until breakfast the next morning. This was just dry toast and a piece of fruit as there wasnt any dairy free options. For lunch I was given a sandwich however the salad was so old and limp it was a salmonella health risk to eat. I told another nurse I was vegan and she bought me biscuits which contained milk so i was very very hungry.”
“I have angina so salt, fat and sugar are a problem with my condition. More boiled, unsalted fish could have been offered.”
“I did not receive the appropriate diet to reduce my weight particularly as my mobility level was very low following my stroke.”
A noteworthy exception was a small number of positive comments about hospital food.
“The food was good.”
“I enjoyed the food.”
“The food was also much better than other hospitals I have been in, and an amazingly wide choice.”
“Food better than l expected”
“I thought that the food in the hospital was particularly good: high quality and with the right amount of choice- and it was delivered hot and at the right times.”
“Amazing mushroom soup – best I’ve had.”
Cleanliness
What does the quantitative survey data tell us?
- 70% reported the hospital room or ward was ‘very clean’ (Q11)
There was mixed feedback about cleanliness, with both positive and negative comments observed. Positive comments tended to lack detail, simply highlighting that the patients found the facilities to be ‘clean’.
“The facilities were clean and well-maintained, and the overall experience was positive.”
“The ward was spotlessly clean.”
“The ward was cleaner than I expected.”
“The hospital was clean, comfortable, well staffed and well equipped.”
“The hospital itself is well signposted, clean, tidy and above all does not have the “hospital smell” that is prevalent in all other hospitals I have been in”
When raised as an area for improvement, comments did include specific examples where better cleaning was needed. Areas highlighted by patients as needing attention included bed linen, under beds and toilets.
“Cleanliness in wards and toilets.”
“Better cleaning, under the beds were dirty and had dropped pills from former patients. No one cleaned her tray, toilets whilst she was there for three days.”
“A matron would keep wards clean of fluids, blood and filth under beds for a start. Place is a breeding ground for more illnesses whilst your in there…”
“Think bathroom means (toilets) could be improved. Some times it very dirty.”
“Cleanliness on the ward – toilet/wash areas especially were completely unhygeinic.”
“The only thing I can think of is that the room I was in wasn’t cleaned for the first 2 days of my one week stay.”
“The cleanliness. I really hated being there and did not want to stay overnight. It did not feel very hygienic. I had multiple nurses spill my blood on my clothes and on my bedsheets – they did not replace the bed sheets.”
Noise
What does the quantitative survey data tell us?
- 36% reported they were ‘not’ prevented from sleeping at night (Q8)
- Of those who said they had been prevented from sleeping, the most common reasons included: noise from other patients (37%), discomfort from pain (23%) and noise from medical equipment (18%) (Q8)
Noise was highlighted as an area to improve, and the most common example shared was noise at night. Sometimes feedback was unclear on when or where noise was problematic for patients. Where patients described the source of noise this included medical equipment, doors, staff and phones or other devices such as TV and radios.
“Noise levels at night. Very noisy had to wear ear plugs.”
“Noise levels.”
“My stay this time was on a respiratory ward and it was nearly impossible to sleep/relax day or night due to patient and equipment noise. It was verging on unbearable and I did seriously consider leaving.”
“The monitoring equipment used within the wards are noisy and prevent patients from sleeping. Monitoring alarms could be sent to nursing stations and handheld units held by the nurses rather than loud audible bleeps, etc.”
“The lighting machine sounds and other patience was very loud.”
“Night noise from the nursing station.”
“At night staff could be quiet and fix doors so they don’t slam shut after a person has gone through.”
“Tv on the wards can be a problem, especially the volume, and not being switched off until after midnight.”
“Realising that staff turning on a radio to dance to is not appropriate.”
“Polite reminders to patients using mobile phones to keep volumes down.”
Disruptive patients
Patients described disturbances while in hospital caused by the actions of other patients or their visitors, highlighting this as an area for improvement. This included experiences that left patients feeling unsafe themselves and/or concerned for the safety of others, such as staff.
“I expect these days it’s inevitable that there are always rude and disrespectful patients but allowing 8 visitors for one patient was disruptive and affected all of the other patients on the 4 bedded ward.”
“One annoying male patient who was being loud and disruptive day and night and who kept drinking the hand gel because it contained alcohol.🍸”
“Other patients were out of control which disrupted everyone else’s stay and ability to get care.”
“There are patients in ward neighbours were too loud, lounging, shouting and screaming. Sometimes even bullying the staffs.”
“Two of the patients on the ward were abusive towards the staff and they had to get security.”
“I think if disruptive, aggressive, racist patients continue their behaviour they should be removed or security called.”
“Close proximity of chemicals and police not good on ward 26. They should be segregrated from other patients.”
“Security needs really improving in September I was beaten up by a fellow patient. I note on my latest visit, that nothing had been improved security wise.”
A noteworthy pattern was observed in this feedback which specifically related disruption in context of dementia or mental health. Patients shared the detrimental impact this had on their ability to rest and recover in this context.
“Patients suffering from confusion should be given medication to calm them. On my ward was a very confused woman who kept everyone awake. When she was not confused she was aggressive, racist, vulgar, and the staff just accepted it at the expense of other patients rest.”
“Very elderly with obvious mental health issues should not be put in the same ward as those with health conditions that need treatment and rest, the elderly are not to blame but when there is constant screaming and crying it’s very difficult for people like myself who are struggling to cope with being in hospital and need to rest and receive treatment and recover.”
“Mixing sick people with dementia patients who are violent and disruptive 24 hours a day is not the best environment for any recovery…It felt like the duty of care was only directed at the 2 patients with dementia and the rest of us had to suck it up.”
Privacy
What does the quantitative survey data tell us?
- 89% reported they were ‘always’ given enough privacy when being examined or treated (Q28)
There were both positive and negative experiences shared relating to privacy while in hospital. Patients who had access to their own room would share this as a particularly good aspect of their stay, especially if this included their own bathroom facilities.
“Privacy own room en suite facility tv that worked.”
“It was pleasant as I was in an isolation room due to what was wrong with me also had my own bathroom.”
“I had my own room.”
“She had her own room (GREAT SIZE VERY SPACIOUS) IT WAS VERY CLEAN AND NO SMELLS).”
“It is positive, that I was given my own room for this hospital stay, which enabled me to have a better quality of rest and to recover before my discharge.”
“I had a private room with my own facilities.”
There were negative experiences shared where patients felt they had lacked privacy, which ranged from requests for their own space to issues of respect and dignity.
“When completing the arrival proforma with many personal questions it would be much better to have a private room”
“I had to ask a nurse to close the curtain as she was about to give me a stomach injection in full view of other patients and their visitors.”
“While moving me from a treatment area, a nurse said she needed to check my skin and simply pulled my pants down without asking. This was in a public place. No one passed, but they could easily have done so. I was shocked and so was my husband. There was a complete lack of respect and disregard of dignity.”
“A room to yourself a bit of privacy.”
Sensory issues
Patients reported that they struggled to get comfortable in the ward or room they had stayed in. Sensory issues were described, with the brightness, temperature, beds and bedding being uncomfortable.
“Room was very cold and i was told there were no more blankets available for overnight stays. I was supposed to just be a day case so was not prepared for an overnight stay.”
“Ventilation in the ward, to hot/cold.”
“Bedding was sparse and tatty and the ward was cold. Medical staff talked, laughed and joked loudly during the night.”
“Upgrading heating systems in all rooms.”
“I was extremely cold all the first night, I kept telling people and only got very thin blankets (6) which didn’t help much. Large window next to me with no covering. I was awake most of first night from cold.”
“The beds were uncomfortable. (They needed thicker matress covers and lighter blankets).”
“No pillow for first 18 hours on ward.”
“If the light could be off during the night?”
“Location of patient bed away from noise and lighting reduced noise at night.”
“Turning off excess lighting at night (e.g. patients who have fallen asleep with their lights left on/what looks like a ‘SAD’ lamp in monitor form”
TV and Wi-Fi
Having access to a television and/or the internet was shared as an area for improvement. Most of this feedback described the value in entertainment terms, passing time more quickly, whereas for others it was a practical need of staying in touch with friends and family during the hospital stay.
“No tv. Internet didn’t work.”
“There was only one thing, all the televisions were out of service, not all patients have iPhones etc.”
“I couldn’t get Wi-Fi access to inform friends and family where I was. I asked one member of staff and was told there was no internet. But I could see other people using their phones. I asked another member of staff who gave me instructions on the NHS Wi-Fi.”
“TV not working, missing cable.”
“on SME entertainment more TV rooms/ more TV’s, better access to [location] hospital radio – not everyone wants to stare at a 2″ wide mobile phone screen for hours on end! Otherwise long, boring, endless days.”
Theme: Discharge and aftercare
Feedback relating to discharge through to aftercare indicated areas for improvement to ensure patients are clear on what would happen next. Clarity on next steps links this theme to ‘Communication’ outlined earlier in this report.
Discharge
What does the quantitative survey data tell us?
- 34% reported that staff involved them ‘a great deal’ in decisions about leaving hospital (Q35)
- 29% felt that staff involved their family or carers ‘a great deal’ in decisions about them leaving hospital (Q36)
- 49% said that they were ‘definitely’ given enough notice before leaving hospital (Q38)
Patients shared negative experiences of discharge, highlighting this as an area to improve.
A range of issues were noted with this part of the journey, which included:
- (Long) waits
- Feeling rushed
- Waiting for prescription / medication
- Lack of engagement with carers re: aftercare
- Not provided equipment
While some patients described a long wait before discharge as the issue, for others discharge was experienced as rushed and left them feeling it was too soon for them to leave.
“Discharge takes a really long time sometimes.”
“Not being discharged properly.”
“discharge – which was a shambles.”
“The speed from been informed okay to go home to actual discharge speeded up with a discharge lounge with specific discharge team as this would free up beds.”
“Waited 9 hours for discharge letter from doctor. (No one seems to know what was happening). Letter seemed to be there all along.”
“I was whisked out of ward too fast to change, so was waiting and went home in pyjamas and robe.”
“My only concern is that the consultant on my final ward was not a lung specialist and due to demand on beds sent me home far too early as the lung and asthma nurses were extremely concerned about me.”
“I was also discharged abruptly and placed in an office, whilst i was still poorly.”
“Earlier communication of time of release to make arrangements. … One of the nurses explained that ‘the bed manager had said he needs the bed so tell him (me) he has to go home.”
The length of time waiting for prescriptions was highlighted in the feedback from patients describing delays with their discharge experience.
“Length of time waiting for prescription drugs when you could have gone home.”
“After discharge papers were issued at ward I was sent down to “discharge lounge”, which was actually a treatment room to await prescriptions. They took 5-hours to turn up and I was in considerable discomfort/pain due to the surgery and just wanted to get home and lie down!! Hospital pharmacy needs a good shakeup! – long waits seem to be very much the norm.”
“Moved to a room to sit for well over an hour to get medication before leaving.”
“The worst part of my stay in hospital was the waiting about for the medication, I had to take home. At 10.30am a chemist came to see me to ask if I was allergic to any medication , this was impressive, but by 5pm the meds still hadn’t arrived on the ward, so one of the nurses chased it up .when the meds came they were wrong.so one of the nurses took it back, and at 8 PM I was still on the ward, it was dark and I was worried about driving home, so I decided to discharged myself and come back the next day for my meds. The medication was waiting for me the next morning when I arrived, but again it was not correct.so in the end the meds were sent by taxi.”
A range of issues were noted with this part of the journey, which included patients feeling they were not provided with the equipment needed for discharge or there had been a lack of engagement with carers to ensure support once in place at discharge.
“my discharge was classed as a “failed discharge” I did not have the right equipment nor care package and it took days to sort out, meaning my wife slept on the floor downstairs for 3 nights and myself in a chair as we didn’t have the right equipment to move me.”
“Carers could have been more involved in discharge discussions and decisions.”
“I had informed the surgeon nobody is home until Friday (surgery was Wednesday) to which he said I’d leave Saturday morning and I arranged on that basis. Thursday midday I was told to leave. I explained I had no home support. Begrudgingly I was allowed to stay but was frowned on.”
“There are no wheelchairs available in the wards to use to get back to the car park on discharge. Sometimes a distance of about a quarter of a mile to be walked. The carer has to search the corridors, usually unsuccessfully, trying to find one. This is a serious problem.”
Transport home
Feedback on negative experiences at discharge included patients who had expected they would be provided with transport home once they left the hospital. Where this didn’t happen, patients were left feeling frustrated with some upset at the unexpected financial cost for personal taxis as their only alternative route home. The reason for not being offered or provided with patient transport was unclear.
“when I was discharged there was no transport to take me home I had no money and no idea where I was I’m not familiar with the area I was very distressed as I couldn’t take the train I have vertigo and labrynthitis. The sister in charge was not sympathetic or even helpful at all and left me feeling very anxious and vulnerable it cost me over £100 to get home by taxi which I borrowed from my neighbour because I couldn’t afford it.”
“Discharge to [location name] hospital process and booking of patient transport. I was told I was leaving [location name] on [date] but was delayed disappointing that ward staff blamed transport yet next day transport told me the ward said I wasn’t ready when they called to collect me.”
“The only problems I had, was when I got ready to leave t go home I was taken outside in a wheelchair where it was very cold and windy. I was told my family could not be there to take me home… work situations etc. so I was eventually put in a taxi. My wife had been told I could use a taxi when I left and paid for by the hospital admin. However when I got home my wife had to pay taxi driver £60 pounds..!!”
“I had been promised, in writing, transport home; after waiting over 1 hour 30 minutes for the ambulance, I asked how much longer it would be only to be told “Oh, I didn’t know you needed an ambulance.”
Aftercare
What does the quantitative survey data tell us?
- 46% reported that they ‘definitely’ knew what would happen next with their care before they left hospital (Q42)
- 77% said that before they left they were given information about what they should or should not do after leaving the hospital (Q39)
- 48% said that after leaving the hospital, they ‘definitely’ got enough support from health or social care services to help them recover or manage their condition (Q45)
While there was variation as to how aftercare was experienced, for most there was a lack of follow up contact or a lack of clarity in what the next steps would be. Further issues included examples whereby follow-up appointments were cancelled or delayed and this left patients feeling unsure whether there would be any further engagement, and unclear as to where to go if they had questions.
“I had to chase for an outpatient appointment once discharged.”
“More specific aftercare advice for age and ongoing other health problems for each patient.”
“Follow up care was non existent – if I hadn’t persistently phoned I would not have had any follow up. I didn’t see my consultant /registrar in outpatients and no physio or follow up.”
“I’ve had no follow up even though I was in hospital for 8 days with seizures and I have not been told what to expect of if I will have them again.”
“I was seen by the physio after the operation, given a sheet with exercises on, shown what to do then sent home with no further aftercare or contact with the hospital team. The problem is that you have no idea if you are recovering properly and no confirmation you are doing things correctly, just left to yourself after a major trauma operation.”
“Since I left hospital, all appointments made by the hospital have been cancelled by the hospital. All appointments made by the GP have been cancelled by the GP. I have therefore have no follow up care.”
“I was practically thrown out of the hospital at 6.30 in the morning when I was told it needed to see other people. There was no follow-up.”
“I believe the after care could have been better. I was discharged on a Sunday evening, with a prescription that I wasn’t able to get because the pharmacies were closed… I am currently waiting for my post op check up 5 months on.”
“I am still awaiting medication to be proscribed by the specialist I saw and I have been trying to cope with the condition since leaving hospital 3.5 months ago.”
While feedback on the support after a stay in hospital was predominantly negative, some comments shared positive surprise at the aftercare they experienced. Good coordination of care left patients feeling reassured and confident in the care they received in these examples.
“Organising care package after my discharge.”
“After care experience was amazing. Staff from surgeons to nurses and aftercare were very supportive and encouraging.”
“Staff showed great patience and kindness and worked hard to get me home with the support needed.”
“Having my hip replacement at a centre of excellence. The lady [name] who did my follow up appointment was fantastic and explained everything to me.”
“The surgical procedure for a cataract was excellent, as was the post-op nursing care.”
Other observations
Below is a list of other topics commented upon in the data that were noted during the analysis process. There was a lack of volume of comments or depth and detail to inform themes and sub-themes but suggestions are noteworthy:
- gratitude for being treated quickly
- a need for privacy for those at end of life
- being unable to identify staff roles (e.g. nurse, HCA, caterer, volunteer) cited as a cause for unease
- report of being told ambulance was on its way but not arriving
- concern that had not had all the tests or scans that ‘should’ be done
- broken lifts for extended periods having a negative impact on a wheelchair user ability to move around during their stay
- negative feedback on ‘uncomfortable’ chairs in waiting areas
4. Conclusions
This is the first national qualitative analysis delivered for the Adult Inpatient survey, and the breadth of the insights demonstrates the value of inviting respondents to share their experiences in their own words. This approach has enabled respondents’ voices to shape the focus of the findings, highlighting what is important to them and what impacts their experience of hospital care.
Overall, the report shows that patients tend to focus reflections on their experience in hospital on the interactions with staff along with hospital facilities and environment. There was also a focus on the early part of the patient’s journey, particularly the waiting experience, and on discharge and aftercare. This appears to reflect the elements of the journey where patients feel least confident.
Reflecting on what constitutes high-quality hospital care, the analysis points to a gold standard for experience: transparency throughout the journey on waiting times and next steps, and responsive care delivered by staff who offer compassion, listen and communicate effectively. Trust and confidence emerge as the foundation – critical is that patients feel both heard and informed through ongoing communication and being appropriately involved in decisions about their care. It is also pivotal that patients feel they are in an environment that is calm and safe to promote recovery and ensure that basic needs such as food, rest and sleep are met.
The diversity of patients, their expectations and needs identified in this analysis demonstrate a challenging context. The findings demonstrate a level of complexity, including at discharge and follow-up, with patients looking to feel both cared for and empowered to navigate aftercare for themselves.
This report offers a comprehensive view of improvement opportunities but has limitations in determining which matter most. The absence of feedback, most notably around experiences of treatment and procedures, should not be seen as evidence that issues do not exist in other areas. Triangulation with other datasets and targeted engagement activities is recommended to identify high-impact priorities.
5. Appendix: Qualitative analysis
Survey methodology
In 2020, the Adult Inpatient Survey transitioned from an entirely paper-based survey to a mixed-mode data collection method (so has since been available as an online survey and a paper questionnaire).
The Adult Inpatient Survey looks at the experiences of people aged 16 and over who stayed in hospital for at least one night for tests, medical treatment or surgery during November. All data was collected between January and April 2025. The survey received feedback from 62,444 adults – a response rate of 41%.
Qualitative analysis
Thematic analysis was undertaken to achieve a deep understanding of the findings from the open questions asked in the survey. This sought to facilitate reflection and learning across services delivering hospital care in England.
To analyse qualitative data, the standard six steps of thematic analysis were used to identify patterns of meaning within the data and explore commonality and contrast – see Figure 1.
Figure 1: Thematic analysis approach
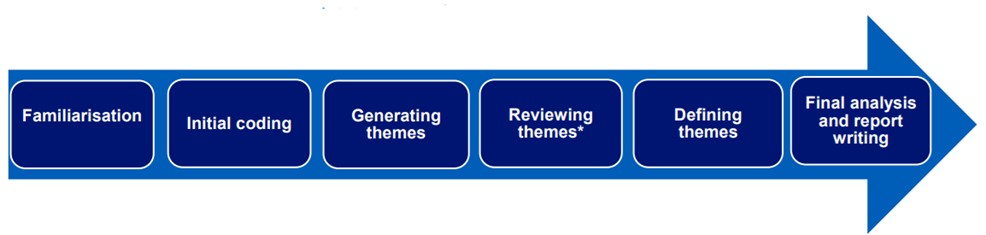
Image text:
- familiarisation
- initial coding
- generating themes
- reviewing themes
- defining themes
- final analysis and report writing
An inductive approach was undertaken for the data analysis of responses to QA and QB, which is a systematic method where themes emerge from the data without any pre-existing framework being used. As a high level of consistency was found between the themes that emerged and the responses to QC, a deductive approach was used for the analysis of QC comments. This means that the thematic codes created in the analysis of responses to QA and QB were used to analyse QC.
The results of the thematic analysis have been reviewed and are shared in context of the relevant quantitative survey findings. This exploits the value of both the quantitative results, which tells us the proportion of respondents feeling a certain way, and the qualitative findings, which tells us why people feel that way. For example, where there is a high degree of agreement / positive experience evidenced in the survey data, the thematic findings offer an opportunity to understand why there was not 100% agreement / positive experience and therein, where the opportunities lie for reflection and learning.
Sub-group comparisons
Sub-group comparisons were not the focus of the analysis. Where variations were observed in the national sample, this has been included within commentary. It is recommended that further focused sampling would allow for in-depth exploration of how experiences of urgent and emergency care may vary for different groups. Observations included will unlikely be exhaustive due to the national sample and focus.
6. Appendix: Sampling approach
42,361 written responses were collected in total, meaning 68% of the survey sample provided qualitative data in answering at least one of the three open ended questions.
Qualitative data cleaning
Before sampling, further data cleaning was carried out to identify and remove extremely short comments which were of no analytical value, for example those which simply stated ‘No’, ‘N/A’ or consisted of a single character.
For QA, 6,799 comments were removed in this way, leaving 35,562 comments for the sample to be drawn from. For QB, 11,701 comments were removed, leaving 30,660 comments for the sample to be drawn from. For QC, 22,769 comments were removed, leaving 19,592 comments for the sample to be drawn from.
Sampling
It was decided to sample each of the questions separately so that all respondents with viable response to each open question had the potential to be included in the final sample for analysis. A total sample of 2,063 responses (686 (QA), 691 (QB), 686 (QC)) were analysed.
To ensure a robust approach to sampling, a purposive sampling approach was taken. This is an established best practice technique when analysing qualitative data, as it ensures that the data has enough diversity across the most relevant criteria to allow the impact of the criteria to be explored and compared. For example, if age is a criteria, including responses from all the different age groups in sufficient volume means that differences in experiences between age groups can be explored.
The criteria chosen to sample on were the age, ethnicity, sex, and deprivation level of respondents, as these were key demographic groups recorded in the data. A sample matrix was drawn up to establish how many comments from each of the demographic groups were to be included in the analysis to allow for sufficient coverage.
In addition to the three key demographic groups a minimum of 30 comments were included on all other characteristics including sexual orientation for instance. Please note that as there was a low volume of data from respondents identifying as Intersex, all of this cohort were included in the sample. The breakdown of the volume of comments in the sample by these different criteria is provided below.
Once the original sample of 2,063 comments had been analysed it was seen that data saturation had been reached, i.e. no new themes were emerging from the data. Had this not been achieved, additional comments would have been added to the sample as necessary, in line with best practice in qualitative analysis.
The tables below show the number of comments in the analysed sample per question. The sampling approach ensured sufficient coverage across key demographic groups to allow for exploration of how experiences may vary.
Table 1: Number of comments in analysed sample per characteristic for QA
| Characteristic | Sub-group | Number of comments analysed | % of comments analysed | % of comments overall |
|---|---|---|---|---|
| Characteristic | Sub-group | Number of comments analysed | % of comments analysed | % of comments overall |
| Age | 16-35 | 47 | 6.9% | 4.7% |
| 36-50 | 60 | 8.7% | 8.4% | |
| 51-65 | 180 | 26.2% | 24.5% | |
| 66-80 | 256 | 37.3% | 41.3% | |
| 81+ | 143 | 20.8% | 21.1% | |
| Ethnic background | White | 532 | 77.6% | 87.9% |
| Mixed | 30 | 4.4% | 1.2% | |
| Asian | 32 | 4.7% | 3.0% | |
| Black | 30 | 4.4% | 1.3% | |
| Other | 30 | 4.4% | 0.3% | |
| Not given | 32 | 4.7% | 5.3% | |
| Deprivation level (IMD Quintile) | 1 (most deprived) | 105 | 15.3% | 15.1% |
| 2 | 122 | 17.8% | 18.0% | |
| 3 | 142 | 20.7% | 21.2% | |
| 4 | 142 | 20.7% | 21.8% | |
| 5 (least deprived) | 154 | 22.4% | 22.2% | |
| Blanks | 21 | 3.1% | 1.7% | |
| Sex | Female | 355 | 51.7% | 53.7% |
| Male | 313 | 45.6% | 45.9% | |
| Intersex | 15 | 2.2% | 0.0% | |
| Prefer not to say | 3 | 0.4% | 0.3% | |
| Gender different to assigned at birth | Yes | 30 | 4.4% | 0.3% |
| Sexual orientation | Heterosexual or Straight | 583 | 85.0% | 92.5% |
| Other | 5 | 0.7% | 0.5% | |
| Gay or Lesbian | 30 | 4.4% | 5.0% | |
| Bisexual | 31 | 4.5% | 5.0% | |
| Prefer not to say | 22 | 3.2% | 2.8% | |
| Not given | 15 | 2.2% | 2.2% |
Table 2: Number of comments in analysed sample per characteristic for QB
| Characteristic | Sub-group | Number of comments analysed | % of comments analysed | % of comments overall |
|---|---|---|---|---|
| Age | 16-35 | 56 | 8.1% | 5.3% |
| 36-50 | 86 | 12.4% | 9.3% | |
| 51-65 | 170 | 24.6% | 25.2% | |
| 66-80 | 268 | 38.8% | 40.7% | |
| 81+ | 111 | 16.1% | 19.5% | |
| Ethnic background | White | 527 | 76.3% | 87.8% |
| Mixed | 31 | 4.5% | 1.2% | |
| Asian | 30 | 4.3% | 3.1% | |
| Black | 35 | 5.1% | 2.4% | |
| Other | 30 | 4.3% | 0.3% | |
| Not given | 38 | 5.5% | 5.3% | |
| Deprivation level (IMD Quintile) | 1 (most deprived) | 100 | 14.5% | 14.8% |
| 2 | 135 | 19.5% | 18.0% | |
| 3 | 149 | 21.6% | 21.1% | |
| 4 | 147 | 21.3% | 21.9% | |
| 5 (least deprived) | 150 | 21.7% | 22.6% | |
| Blanks | 10 | 1.4% | 1.6% | |
| Sex | Female | 388 | 56.2% | 54.8% |
| Male | 289 | 41.8% | 44.8% | |
| Intersex | 10 | 1.4% | 1.7% | |
| Prefer not to say | 4 | 0.6% | 0.4% | |
| Gender different to assigned at birth | Yes | 30 | 4.3% | 0.3% |
| Sexual orientation | Heterosexual or Straight | 597 | 86.4% | 92.6% |
| Other | 4 | 0.6% | 0.5% | |
| Gay or Lesbian | 30 | 4.3% | 5.0% | |
| Bisexual | 32 | 4.6% | 5.0% | |
| Prefer not to say | 17 | 2.5% | 2.9% | |
| Not given | 11 | 1.6% | 1.7% |
Table 3: Number of comments in analysed sample per characteristic for QC
| Characteristic | Sub-group | Number of comments analysed | % of comments analysed | % of comments analysed |
|---|---|---|---|---|
| Age | 16-35 | 56 | 8.1% | 5.3% |
| 36-50 | 86 | 12.4% | 9.3% | |
| 51-65 | 170 | 24.6% | 25.2% | |
| 66-80 | 268 | 38.8% | 40.7% | |
| 81+ | 111 | 16.1% | 19.5% | |
| Ethnic background | White | 527 | 76.3% | 87.8% |
| Mixed | 31 | 4.5% | 1.2% | |
| Asian | 30 | 4.3% | 3.1% | |
| Black | 35 | 5.1% | 2.4% | |
| Other | 30 | 4.3% | 0.3% | |
| Not given | 38 | 5.5% | 5.3% | |
| Deprivation level (IMD Quintile) | 1 (most deprived) | 100 | 14.5% | 14.8% |
| 2 | 135 | 19.5% | 18.0% | |
| 3 | 149 | 21.6% | 21.1% | |
| 4 | 147 | 21.3% | 21.9% | |
| 5 (least deprived) | 150 | 21.7% | 22.6% | |
| Blanks | 10 | 1.4% | 1.6% | |
| Sex | Female | 388 | 56.2% | 54.8% |
| Male | 289 | 41.8% | 44.8% | |
| Intersex | 10 | 1.4% | 1.7% | |
| Prefer not to say | 4 | 0.6% | 0.4% | |
| Gender different to assigned at birth | Yes | 30 | 4.3% | 0.3% |
| Sexual orientation | Heterosexual or Straight | 597 | 86.4% | 92.6% |
| Other | 4 | 0.6% | 0.5% | |
| Gay or Lesbian | 30 | 4.3% | 5.0% | |
| Bisexual | 32 | 4.6% | 5.0% | |
| Prefer not to say | 17 | 2.5% | 2.9% | |
| Not given | 11 | 1.6% | 1.7% |