
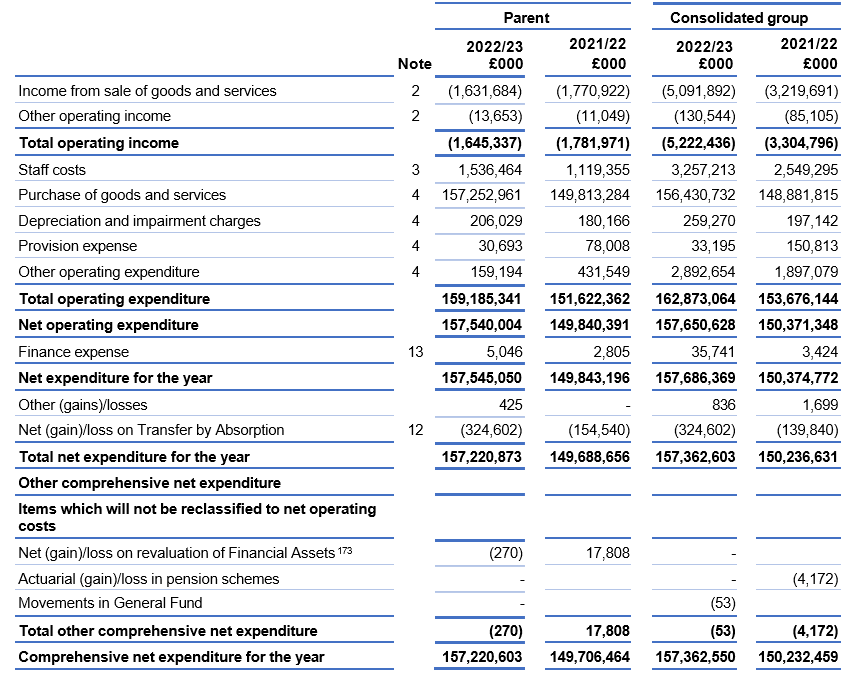
Statement of comprehensive net expenditure for the year ended 31 March 2023
|
|
Note |
Parent |
|
Consolidated group | ||||
|
2022/23 |
|
2021/22 £000 |
|
2022/23 |
|
2021/22 £000 | ||
|
Income from sale of goods and services |
2 |
(1,631,684) |
|
(1,770,922) |
|
(5,091,892) |
|
(3,219,691) |
|
Other operating income |
2 |
(13,653) |
|
(11,049) |
|
(130,544) |
|
(85,105) |
|
Total operating income |
|
(1,645,337) |
|
(1,781,971) |
|
(5,222,436) |
|
(3,304,796) |
|
Staff costs |
3 |
1,536,464 |
|
1,119,355 |
|
3,257,213 |
|
2,549,295 |
|
Purchase of goods and services |
4 |
157,252,961 |
|
149,813,284 |
|
156,430,732 |
|
148,881,815 |
|
Depreciation and impairment charges |
4 |
206,029 |
|
180,166 |
|
259,270 |
|
197,142 |
|
Provision expense |
4 |
30,693 |
|
78,008 |
|
33,195 |
|
150,813 |
|
Other operating expenditure |
4 |
159,194 |
|
431,549 |
|
2,892,654 |
|
1,897,079 |
|
Total operating expenditure |
|
159,185,341 |
|
151,622,362 |
|
162,873,064 |
|
153,676,144 |
|
Net operating expenditure |
|
157,540,004 |
|
149,840,391 |
|
157,650,628 |
|
150,371,348 |
|
Finance expense |
13 |
5,046 |
|
2,805 |
|
35,741 |
|
3,424 |
|
Net expenditure for the year |
|
157,545,050 |
|
149,843,196 |
|
157,686,369 |
|
150,374,772 |
|
Other (gains)/losses |
|
425 |
|
– |
|
836 |
|
1,699 |
|
Net (gain)/loss on Transfer by Absorption |
12 |
(324,602) |
|
(154,540) |
|
(324,602) |
|
(139,840) |
|
Total net expenditure for the year |
|
157,220,873 |
|
149,688,656 |
|
157,362,603 |
|
150,236,631 |
|
Other comprehensive net expenditure |
|
|
|
|
|
|
|
|
|
Items which will not be reclassified to net operating costs |
|
|
|
|
|
|
|
|
|
Net (gain)/loss on revaluation of Financial Assets172F[1] |
|
(270) |
|
17,808 |
|
– |
|
|
|
Actuarial (gain)/loss in pension schemes |
|
– |
|
|
|
– |
|
(4,172) |
|
Movements in General Fund |
|
– |
|
|
|
(53) |
|
|
|
Total other comprehensive net expenditure |
|
(270) |
|
17,808 |
|
(53) |
|
(4,172) |
|
Comprehensive net expenditure for the year |
|
157,220,603 |
|
149,706,464 |
|
157,362,550 |
|
150,232,459 |
On 1 February 2023, NHS Digital became part of the NHS England parent account.
As a result, the assets, liabilities and ongoing operational income and expenditure relating to former NHS Digital functions form part of the NHS England parent account from this date.
In October 2021 NHS England, the Parent, acquired 100% of the shareholding of SCCL. As a result, the assets, liabilities and ongoing operational income and expenditure form part of the NHS England Consolidated Group Account from this date.
The notes on pages 143 to 185 form part of this statement.
Statement of financial position as at 31 March 2023
|
Non-current assets: |
|
Parent |
|
Consolidated group | ||||
|
Note |
31 March 2023 £000 |
|
31 March £000 |
|
31 March £000 |
|
31 March 2022 £000 | |
|
Property, plant and equipment |
5 |
410,196 |
|
396,194 |
|
481,317 |
|
474,993 |
|
Right Of Use Assets |
6 |
123,458 |
|
– |
|
327,731 |
|
– |
|
Intangible assets |
7 |
369,427 |
|
56,119 |
|
373,851 |
|
58,223 |
|
Trade and other receivables |
9 |
4,693 |
|
– |
|
4,816 |
|
1,496 |
|
Other financial assets |
9 |
141,462 |
|
141,192 |
|
1,106 |
|
2,106 |
|
Total non-current assets |
1,049,236 |
|
593,505 |
|
1,188,821 |
|
536,818 | |
|
|
|
|
|
|
|
|
|
|
|
Current assets: |
|
|
|
|
|
|
|
|
|
Inventories |
8 |
8,980 |
|
29,911 |
|
174,371 |
|
193,056 |
|
Trade and other receivables |
9 |
1,004,283 |
|
724,623 |
|
2,696,447 |
|
3,738,887 |
|
Cash and cash equivalents |
10 |
374,885 |
|
229,575 |
|
625,049 |
|
385,172 |
|
Total current assets |
1,388,148 |
|
984,109 |
|
3,495,867 |
|
4,317,115 | |
|
Total assets |
2,437,384 |
|
1,577,614 |
|
4,684,688 |
|
4,853,933 | |
|
|
|
|
|
|
|
|
|
|
|
Current liabilities |
|
|
|
|
|
|
|
|
|
Trade and other payables |
11 |
(5,004,887) |
|
(3,021,567) |
|
(13,348,391) |
|
(11,022,960) |
|
Right of use asset lease liabilities |
6 |
(27,004) |
|
– |
|
(55,455) |
|
– |
|
Other financial liabilities |
11 |
– |
|
– |
|
(65,355) |
|
(10,538) |
|
Provisions |
14 |
(36,443) |
|
(82,584) |
|
(190,214) |
|
(250,926) |
|
Total current liabilities |
|
(5,068,334) |
|
(3,104,151) |
|
(13,659,415) |
|
(11,284,424) |
|
Total assets less current liabilities |
|
(2,630,950) |
|
(1,526,537) |
|
(8,974,727) |
|
(6,430,491) |
|
|
|
|
|
|
|
|
|
|
|
Non-current liabilities |
|
|
|
|
|
|
|
|
|
Trade and other payables |
11 |
(3,360) |
|
(31) |
|
(4,026) |
|
(876) |
|
Right of use asset lease liabilities |
6 |
(104,730) |
|
– |
|
(276,127) |
|
– |
|
Other financial liabilities |
11 |
– |
|
– |
|
(781,673) |
|
(2,234,536) |
|
Provisions |
14 |
(428,451) |
|
(352,452) |
|
(477,202) |
|
(413,543) |
|
Total non-current liabilities |
|
(536,541) |
|
(352,483) |
|
(1,539,028) |
|
(2,648,955) |
|
Total assets less total liabilities |
|
(3,167,491) |
|
(1,879,020) |
|
(10,513,755) |
|
(9,079,446) |
|
|
|
|
|
|
|
|
|
|
|
Financed by taxpayers’ equity and other reserves |
|
|
|
|
|
|
|
|
|
General fund |
|
(3,152,183) |
|
(1,861,212) |
|
(10,515,993) |
|
(9,076,430) |
|
Revaluation reserve |
|
2,230 |
|
– |
|
2,238 |
|
18 |
|
Other reserves |
|
(17,538) |
|
(17,808) |
|
– |
|
(3,034) |
|
Total taxpayers’ equity |
|
(3,168,491) |
|
(1,879,020) |
|
(10,513,755) |
|
(9,079,446) |
The notes on pages 143 to 185 form part of this statement.
The financial statements on pages 138 to 142 were approved by the Board on 21 January 2024 and signed on its behalf by:
Amanda Pritchard, Accounting Officer
Statement of changes in taxpayers’ equity for the year ended 31 March 2023
|
Parent 2022/23 |
General fund |
Revaluation reserve |
Other |
Total |
|
Balance at 01 April 2022 |
(1,861,212) |
– |
(17,808) |
(1,879,020) |
|
Total net expenditure for the period |
(157,220,873) |
– |
– |
(157,220,873) |
|
Net gain/(loss) on revaluation of property, plant and equipment |
– |
– |
270 |
270 |
|
Transfers in reserves following Absorption |
(2,230) |
2,230 |
– |
– |
|
Transfers by absorption to (from) other bodies |
3,891 |
– |
– |
3,891 |
|
Comprehensive net expenditure for the period |
(157,219,212) |
2,230 |
270 |
(157,216,712) |
|
Grant in aid |
155,928,241 |
– |
– |
155,928,241 |
|
Balance at 31 March 2023 |
(3,152,183) |
2,230 |
(17,538) |
(3,167,491) |
|
Parent 2021/22 |
General fund |
Revaluation reserve |
Other |
Total |
|
Balance at 01 April 2021 |
(2,601,953) |
– |
– |
(2,601,953) |
|
Total net expenditure for the year |
(149,688,656) |
– |
– |
(149,688,656) |
|
Net gain/(loss) on revaluation of other investments and Financial Assets (excluding available for sale financial assets) |
– |
– |
(17,808) |
(17,808) |
|
Transfers by absorption to (from) other bodies |
– |
– |
– |
– |
|
Comprehensive net expenditure for the year |
(149,688,656) |
– |
(17,808) |
(149,706,464) |
|
Grant in aid |
150,429,397 |
– |
– |
150,429,397 |
|
Balance at 31 March 2022 |
(1,861,212) |
– |
(17,808) |
(1,879,020) |
|
Consolidated group 2022/23 |
General fund |
Revaluation reserve |
Other |
Total |
|
Balance at 01 April 2022 |
(9,076,430) |
18 |
(3,034) |
(9,079,446) |
|
Changes in total taxpayers’ equity for 2022/23 |
|
|
|
|
|
Total net expenditure for the year |
(157,362,603) |
– |
– |
(157,362,603) |
|
Other movements in reserves |
(2,981) |
– |
3,034 |
53 |
|
Transfers in reserves following absorption |
(2,230) |
2,230 |
– |
– |
|
Transfers between reserves |
10 |
(10) |
– |
– |
|
Transfers by absorption to (from) other bodies |
– |
– |
– |
– |
|
Comprehensive net expenditure for the year |
(157,367,804) |
2,220 |
3,034 |
(157,362,550) |
|
Grant in aid |
155,928,241 |
– |
– |
155,928,241 |
|
Balance at 31 March 2023 |
(10,515,993) |
2,238 |
– |
(10,513,755) |
|
Consolidated group 2021/22 |
General fund |
Revaluation reserve |
Other |
Total |
|
Balance at 01 April 2021 |
(9,269,196) |
18 |
(7,206) |
(9,276,384) |
|
Total net expenditure for the year |
(150,236,633) |
– |
– |
(150,236,633) |
|
Movements in other reserves |
2 |
– |
4,172 |
4,174 |
|
Movements in general fund |
– |
– |
– |
– |
|
Comprehensive net expenditure for the period |
(150,236,631) |
– |
4,172 |
(150,232,459) |
|
Grant in aid |
150,429,397 |
– |
– |
150,429,397 |
|
Balance at 31 March 2022 |
(9,076,430) |
18 |
(3,034) |
(9,079,446) |
The general fund is used in public sector accounting to reflect the total assets less liabilities of an entity, which are not assigned to another reserve.
Other reserves in the parent relate to fair value losses on equity investments designated as fair value through other comprehensive income under IFRS 9
Other reserves in the group reflect pension assets/liabilities in respect of staff in non-NHS defined benefit schemes in CCGs/ICBs. Full details can be found in the CCG/ICBs statutory accounts published on their websites.
The notes on pages 143 to 185 form part of this statement.
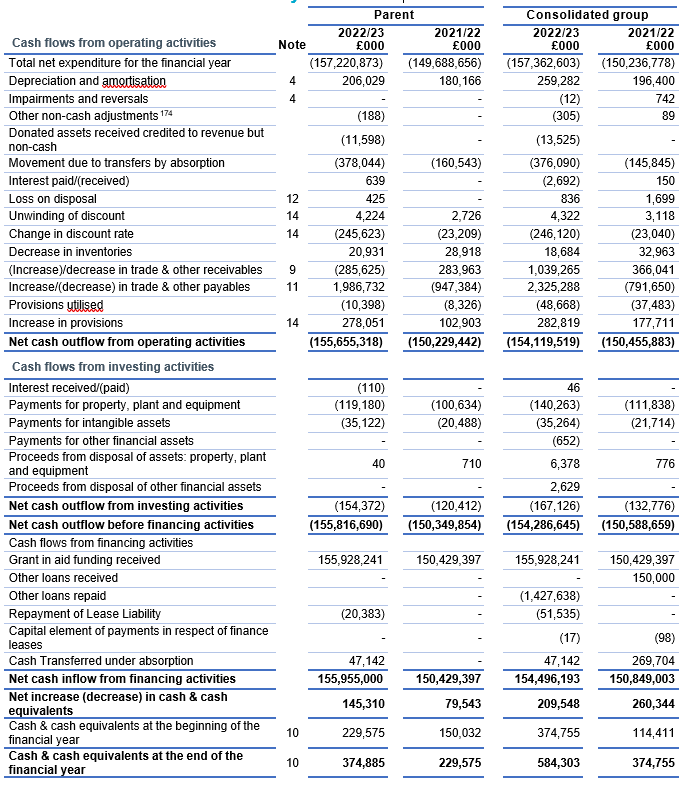
Statement of cash flows for the year ended 31 March 2023
|
|
|
Parent |
|
Consolidated group |
| ||||
Cash flows from operating activities |
Note |
2022/23 £000 |
|
2021/22 £000 |
|
2022/23 £000 |
|
2021/22 £000 | |
|
Total net expenditure for the financial year |
(157,220,873) |
|
(149,688,656) |
|
(157,362,603) |
|
(150,236,778) | ||
|
Depreciation and amortisation |
4 |
206,029 |
|
180,166 |
|
259,282 |
|
196,400 | |
|
Impairments and reversals |
4 |
– |
|
– |
|
(12) |
|
742 | |
|
Other non-cash adjustments173F[2] |
|
(188) |
|
– |
|
(305) |
|
89 | |
|
Donated assets received credited to revenue but non-cash |
|
(11,598) |
|
– |
|
(13,525) |
|
– | |
|
Movement due to transfers by absorption |
|
(378,044) |
|
(160,543) |
|
(376,090) |
|
(145,845) | |
|
Interest paid/(received) |
|
639 |
|
– |
|
(2,692) |
|
150 | |
|
Loss on disposal |
12 |
425 |
|
– |
|
836 |
|
1,699 | |
|
Unwinding of discount |
14 |
4,224 |
|
2,726 |
|
4,322 |
|
3,118 | |
|
Change in discount rate |
14 |
(245,623) |
|
(23,209) |
|
(246,120) |
|
(23,040) | |
|
Decrease in inventories |
|
20,931 |
|
28,918 |
|
18,684 |
|
32,963 | |
|
(Increase)/decrease in trade & other receivables |
9 |
(285,625) |
|
283,963 |
|
1,039,265 |
|
366,041 | |
|
Increase/(decrease) in trade & other payables |
11 |
1,986,732 |
|
(947,384) |
|
2,325,288 |
|
(791,650) | |
|
Provisions utilised |
|
(10,398) |
|
(8,326) |
|
(48,668) |
|
(37,483) | |
|
Increase in provisions |
14 |
278,051 |
|
102,903 |
|
282,819 |
|
177,711 | |
|
Net cash outflow from operating activities |
(155,655,318) |
|
(150,229,442) |
|
(154,119,519) |
|
(150,455,883) | ||
Cash flows from investing activities |
|
|
|
|
|
|
|
| |
|
Interest received/(paid) |
|
(110) |
|
– |
|
46 |
|
– | |
|
Payments for property, plant and equipment |
|
(119,180) |
|
(100,634) |
|
(140,263) |
|
(111,838) | |
|
Payments for intangible assets |
|
(35,122) |
|
(20,488) |
|
(35,264) |
|
(21,714) | |
|
Payments for other financial assets |
|
– |
|
– |
|
(652) |
|
– | |
|
Proceeds from disposal of assets: property, plant and equipment |
|
40 |
|
710 |
|
6,378 |
|
776 | |
|
Proceeds from disposal of other financial assets |
|
– |
|
– |
|
2,629 |
|
– | |
|
Net cash outflow from investing activities |
|
(154,372) |
|
(120,412) |
|
(167,126) |
|
(132,776) | |
|
Net cash outflow before financing activities |
|
(155,816,690) |
|
(150,349,854) |
|
(154,286,645) |
|
(150,588,659) | |
|
Cash flows from financing activities |
|
|
|
|
|
|
|
| |
|
Grant in aid funding received |
|
155,928,241 |
|
150,429,397 |
|
155,928,241 |
|
150,429,397 | |
|
Other loans received |
|
– |
|
– |
|
– |
|
150,000 | |
|
Other loans repaid |
|
|
|
– |
|
(1,427,638) |
|
– | |
|
Repayment of Lease Liability |
|
(20,383) |
|
– |
|
(51,535) |
|
– | |
|
Capital element of payments in respect of finance leases |
|
– |
|
– |
|
(17) |
|
(98) | |
|
Cash Transferred under absorption |
|
47,142 |
|
– |
|
47,142 |
|
269,704 | |
|
Net cash inflow from financing activities |
|
155,955,000 |
|
150,429,397 |
|
154,496,193 |
|
150,849,003 | |
|
Net increase (decrease) in cash & cash equivalents |
|
145,310 |
|
79,543 |
|
209,548 |
|
260,344 | |
|
Cash & cash equivalents at the beginning of the financial year |
10 |
229,575 |
|
150,032 |
|
374,755 |
|
114,411 | |
|
Cash & cash equivalents at the end of the financial year |
10 |
374,885 |
|
229,575 |
|
584,303 |
|
374,755 | |
The notes on pages 143 to 185 form part of this statement.
There is no separate disclosure under IAS 7 for cash and non-cash movements for financing activities because the values are immaterial.
Notes to the financial statements
1. Statement of accounting policies
These financial statements have been prepared in a form directed by the Secretary of State under Schedule 1(A), paragraph 15(2) of the NHS Act 2006 (as amended by the Health and Care Act 2022) and in accordance with the Financial Reporting Manual (FReM) 2022/23 issued by HM Treasury and the DHSC Group Accounting Manual (GAM) issued by the Department of Health & Social Care. The accounting policies contained in the FReM and DHSC GAM apply International Financial Reporting Standards (IFRS) as adapted or interpreted for the public sector context. Where the FReM or DHSC GAM permits a choice of accounting policy, the accounting policy which is judged to be most appropriate to the particular circumstances of NHS England for the purpose of giving a true and fair view has been selected. The particular policies adopted by NHS England are described below. They have been applied consistently in dealing with items considered material to the accounts.
The functional and presentational currency is pounds sterling and figures are expressed in pounds thousands unless expressly stated. 2 sets of figures are presented – the first relating to NHS England itself (the Parent) and a second set of consolidated figures (Consolidated Group). The entities making up the Consolidated Group are declared in Note 22.
Exchange gains and losses on monetary items (arising on settlement of the transaction or on retranslation at the Statement of Financial Position date) are recognised in the Statement of Comprehensive Net Expenditure in the period in which they arise.
1.1 Operating segments
Income and expenditure are analysed in the Operating Segments note (note 18) and reflect the management information used within NHS England. Information on assets less liabilities is not separately reported to the Chief Operating Decision Maker and therefore in accordance with IFRS 8 does not form part of the disclosure in note 18.
1.2 Accounting convention
These accounts have been prepared under the historical cost convention, modified to account for the revaluation of property, plant and equipment, intangible assets, and certain financial assets and financial liabilities.
1.3 Basis of consolidation
These accounts comprise the results of the NHS England statutory entity as well as the consolidated position of NHS England, 106 related CCGs, 42 ICBs and Supply Chain Coordination Limited. Transactions between entities included in the consolidation are eliminated.
For 2022/23 4 CCG audits and 5 ICB audits are incomplete at the time of finalising the NHS England group account on 4 January 2024. Unaudited information has been used to prepare the NHS England group account.
Details of the entities outstanding are shown in the table below.
|
Entities outstanding |
|
Reason for delay | |
|
– NHS Birmingham and Solihull CCG – NHS West Essex CCG – NHS Hertfordshire And West Essex Integrated Care Board – NHS North West London CCG – NHS North West London Integrated Care Board – NHS Suffolk And North East Essex Integrated Care Board – NHS Birmingham And Solihull Integrated Care Board |
|
The auditor, BDO LLP, has not been able to complete its audit prior to this group account being prepared. No significant issues that would impact on the completion of the NHS England group account have been reported to us. | |
|
– NHS Herefordshire and Worcestershire CCG – NHS Herefordshire And Worcestershire Integrated Care Board
|
|
The auditor, Deloitte LLP, has not been able to complete its audit prior to this group account being prepared due to the late appointment of an auditor by the CCG and the ICB. This followed the CCG and the ICB having difficulty appointing an auditor due to the wider capacity constraints in the local audit market. No significant issues that would impact on the completion of the NHS England group account have been reported to us. | |
A summary of the financial statements of these commissioners is presented below:
|
|
Operating Income |
Operating expenditure |
Total Assets |
Total liabilities |
Reserves | |
|
NHS Commissioner |
|
£000 |
£000 |
£000 |
£000 |
£000 |
|
NHS Birmingham and Solihull CCG |
|
(3,573) |
588,567 |
33,205 |
(140,923) |
(107,718) |
|
NHS Birmingham And Solihull Integrated Care Board |
|
(3,049) |
2,264,631 |
4,845 |
(204,485) |
(199,640) |
|
NHS Herefordshire and Worcestershire CCG |
|
(1,552) |
365,555 |
17,653 |
(92,012) |
(74,359) |
|
NHS Herefordshire And Worcestershire Integrated Care Board |
|
(6,046) |
1,242,816 |
20,283 |
(107,774) |
(87,491) |
|
NHS West Essex CCG |
|
(821) |
175,850 |
1,957 |
(46,132) |
(44,175) |
|
NHS Hertfordshire And West Essex Integrated Care Board |
|
(16,185) |
2,221,768 |
23,059 |
(205,787) |
(182,728) |
|
NHS North West London CCG |
|
(1,889) |
1,085,030 |
62,141 |
(402,393) |
(340,252) |
|
NHS North West London Integrated Care Board |
|
(11,383) |
3,568,190 |
43,200 |
(453,957) |
(410,757) |
|
NHS Suffolk And North East Essex Integrated Care Board |
|
(11,515) |
1,577,760 |
14,514 |
(143,320) |
(128,806) |
|
Total |
|
(56,013) |
13,090,167 |
220,857 |
(1,796,783) |
(1,575,926) |
With reference to materiality for these consolidated accounts of £1.5 billion, operating expenditure for these entities is material so we have performed additional assurance procedures on these balances. Following these procedures, we are satisfied that the residual balances over which uncertainty remains are not material to these consolidated accounts.
The NHS England group account for 2021/22 was finalised using unaudited information for three NHS commissioners. These three commissioners have now published audited accounts for 2021/22 and there were no changes in their financial information as presented in the NHS England group account for 2021/22.
CSUs form part of NHS England and provide services to CCGs and ICBs. The CSU results are included within the Parent accounts as they are not separate legal entities.
From 1 July 2022 NHS England took on the functions of NHS TDA and Monitor and on this date their functions, assets and liabilities were transferred into the NHS England statutory entity.
From 1 February 2023 the functions, assets and liabilities of NHS Digital were transferred into the NHS England statutory entity and are now included as part of the NHS England parent account.
1.4 Comparative information
The comparative information provided in these financial statements is for the year ended 31 March 2022.
1.5 Going concern
NHS England’s financial statements are produced on a going concern basis. NHS England is financed by grant-in-aid and draws its funding from the DHSC. Parliament has demonstrated its commitment to fund the DHSC for the foreseeable future via the latest Spending Review and the passing of the Health and Care Act 2022. In the same way, the DHSC has demonstrated commitment to the funding of NHS England. It is therefore considered appropriate to adopt the going concern basis for the preparation of these financial statements.
1.6 Transfer of functions
As public sector bodies within a Departmental Boundary are deemed to operate under common control, business reconfigurations are outside the scope of IFRS 3 Business Combinations. When functions transfer between two public sector bodies the FReM requires the application of “absorption accounting”. Absorption accounting requires that entities account for their transactions in the period in which those transactions took place. Where assets and liabilities transfer, the gain or loss resulting is recognised in the Statement of Net Comprehensive Expenditure and is disclosed separately from operating costs.
1.7 Revenue recognition
In the application of IFRS 15 a number of practical expedients have been employed. These are as follows:
- NHS England is not required to disclose information regarding performance obligations that are part of a contract that has an original expected duration of one year or less
- NHS England is not required to disclose information where revenue is recognised in line with the practical expedient offered in the Standard, where the right to consideration corresponds directly with the value of the performance completed to date.
The main source of funding for NHS England is grant-in-aid from the Department of Health & Social Care. NHS England is required to maintain expenditure within this allocation.
The Department of Health & Social Care also approves a cash limit for the period.
NHS England is required to draw down cash in accordance with this limit. Grant-in-aid is drawn down and credited to the general fund. Grant-in-aid is recognised in the financial period in which it is received.
Revenue in respect of services provided is recognised when (or as) performance obligations are satisfied by transferring promised services to the customer and is measured at the amount of the transaction price allocated to that performance obligation.
IFRS 15 is applicable to revenue in respect of dental and prescription charges in line with the adaptation in IFRS 15 which states that the definition of a contract includes revenue received under legislation and regulations. Revenue for these charges is recognised when the performance event occurs, such as the issue of a prescription or payment for dental treatment.
Income received in respect of penalty charge notices issued in relation to non-payment of prescribing and dental charges is recognised on a cash receipts basis.
Where income is received for a specific performance obligation that is to be satisfied in the following year, that income is deferred.
Other operating revenue is recognised when the service is rendered and the stage completion of the transaction at the end of the reporting period can be measured reliably, and it is probable that the economic benefit associated with the transaction will flow to the group. Income is measured at fair value of the consideration receivable.
The value of the benefit received when NHS England accesses funds from the government’s apprenticeship service are recognised as income in accordance with IAS 20, Accounting for Government Grants. Where these funds are paid directly to an accredited training provider, non-cash income and a corresponding non-cash training expense are recognised, both equal to the cost of the training funded.
1.8 Employee benefits
Recognition of short-term benefits – retirement benefit costs:
Past and present employees are covered by the provisions of the NHS Pensions schemes. The schemes are unfunded, defined benefit schemes that cover NHS employers, general practitioners and other bodies allowed under the direction of the Secretary of State in England and Wales. The schemes are not designed to be run in a way that would enable NHS bodies to identify their share of the underlying assets and liabilities. Therefore, the schemes are accounted for as if they were a defined contribution scheme; the cost recognised in these accounts represents the contributions payable for the year. Details of the benefits payable under these provisions can be found on the NHS Pensions website at www.nhsbsa.nhs.uk/pensions.
For early retirements other than those due to ill health, the additional pension liabilities are not funded by the scheme. The full amount of the liability for the additional costs is charged to expenditure at the time the organisation commits itself to the retirement, regardless of the method of payment.
Salaries, wages and employment related payments, including payments arising from the apprenticeship levy, are recognised in the period in which the service is received from employees. The cost of leave earned but not taken by employees at the end of the period is recognised in the financial statements to the extent that employees are permitted to carry forward leave into the following year.
1.9 Other expenses
Other operating expenses are recognised when, and to the extent that, the goods or services have been received. They are measured at the fair value of the consideration payable.
1.10 Value added tax
Most of the activities of the group are outside the scope of value added tax (VAT). Irrecoverable VAT is charged to the relevant expenditure category or included in the capitalised purchase cost of non-current assets. Where output tax is charged or input VAT is recoverable, the amounts are stated net of VAT.
1.11 Property, plant and equipment
Recognition
Property, plant and equipment is capitalised if:
- it is held for use in delivering services or for administrative purposes
- it is probable that future economic benefits will flow to, or service potential will be supplied to, the group
- it is expected to be used for more than 1 financial year
- the cost of the item can be measured reliably; and either
- the item cost at least £5,000, or
- collectively, a number of items have a total cost of at least £5,000 and individually have a cost of more than £250, where the assets are functionally interdependent, they have broadly simultaneous purchase dates, are anticipated to have simultaneous disposal dates and are under single managerial control
Where an asset includes a number of components with significantly different asset lives, the components are treated as separate assets and depreciated over their individual useful economic lives.
Measurement of property, plant and equipment
All property, plant and equipment is measured initially at cost, representing the cost directly attributable to acquiring or constructing the asset and bringing it to the location and condition necessary for it to be capable of operating in the manner intended by management. Assets that are held for their service potential and are in use are measured subsequently at their current value in existing use.
IT equipment, transport equipment, furniture and fittings, and plant and machinery that are held for operational use are valued at depreciated historical cost as a proxy for current value in existing use. This is in accordance with FReM requirements as these assets have short useful lives or low values or both.
Balances held in the Revaluation reserve relate to balances inherited as at 1 April 2013. In line with our accounting policy, no further revaluation gains have been recognised.
Subsequent expenditure
Where subsequent expenditure enhances an asset beyond its original specification, the directly attributable cost is capitalised. Where subsequent expenditure restores the asset to its original specification, the expenditure is capitalised and any existing carrying value of the item replaced is charged to operating expenses.
1.12 Intangible non-current assets
Intangible non-current assets are non-monetary assets without physical substance that are capable of sale separately from the rest of the group’s business or arise from contractual or other legal rights. They are recognised only when it is probable that future economic benefits will flow to, or service potential be provided to, the group; where the cost of the asset can be measured reliably; and where the cost is at least £5,000 or collectively the cost is at least £5,000 with each individual item costing more than £250.
Intangible non-current assets acquired separately are initially recognised at cost. Software that is integral to the operation of hardware is capitalised as part of the relevant item of property, plant and equipment. Software that is not integral to the operation of hardware is capitalised as an intangible asset.
Following initial recognition, intangible assets are carried at depreciated historic cost as a proxy for current value in existing use.
1.13 Research and development
Expenditure on research is not capitalised; it is recognised as an operating expense in the period in which it is incurred.
Internally generated assets are recognised if, and only if, all of the following have been demonstrated:
- the technical feasibility of completing the intangible asset so that it will be available for use
- the intention to complete the intangible asset and use it
- the ability to sell or use the intangible asset
- how the intangible asset will generate probable future economic benefits or service potential
- the availability of adequate technical, financial, and other resources to complete the intangible asset and sell or use it
- the ability to reliably measure the expenditure attributable to the intangible asset during its development.
The amount initially recognised for internally generated intangible assets is the sum of the expenditure incurred from the date when the criteria for recognition are initially met. Where no internally generated intangible asset can be recognised, the expenditure is recognised in the period in which it is incurred.
1.14 Depreciation, amortisation and impairments
Freehold land, assets under construction, investment properties, stockpiled goods and assets held for sale are neither depreciated nor amortised.
Otherwise, depreciation or amortisation, as appropriate, is charged to write off the costs or valuation of property, plant and equipment and intangible non-current assets, less any residual value, on a straight-line basis over their estimated remaining useful lives. The estimated useful life of an asset is the period over which economic benefits or service potential is expected to be obtained from the asset. Estimated useful lives and residual values are reviewed each year end, with the effect of any changes recognised on a prospective basis. Assets held under finance leases are depreciated over the shorter of the lease term and the estimated useful life.
Depreciation/amortisation is charged as follows:
|
|
|
Minimum life (years) |
|
Maximum life (years) |
|
Buildings excluding dwellings |
|
5 |
|
20 |
|
Plant and machinery |
|
5 |
|
10 |
|
Transport equipment |
|
5 |
|
10 |
|
Information technology |
|
2 |
|
10 |
|
Furniture and fittings |
|
5 |
|
10 |
|
Computer software: purchased |
|
2 |
|
5 |
|
Licences and trademarks |
|
2 |
|
5 |
|
Development expenditure (internally generated) |
|
2 |
|
5 |
1.15 Government grants
Government grant funded assets are capitalised at their fair value on receipt, with a matching credit to income. Deferred income is recognised only where conditions attached to the grant preclude immediate recognition of the gain.
1.16 Leases
A lease is a contract or part of a contract that conveys the right to use an asset for a period of time in exchange for consideration.
IFRS 16 Leases is effective across the public sector from 1 April 2022. The transition to IFRS 16 has been completed in accordance with paragraph C5 (b) of the Standard, applying IFRS 16 requirements retrospectively recognising the cumulative effects at the date of initial application.
In the transition to IFRS 16 a number of elections and practical expedients offered in the Standard have been employed. These are as follows:
NHS England has applied the practical expedient offered in the Standard per paragraph C3 to apply IFRS 16 to contracts or arrangements previously identified as containing a lease under the previous leasing standards IAS 17 Leases and IFRIC 4 Determining whether an Arrangement contains a Lease and not to those that were identified as not containing a lease under previous leasing standards.
On initial application NHS England has measured the right of use assets for leases previously classified as operating leases per IFRS 16 C8 (b)(ii), at an amount equal to the lease liability adjusted for accrued or prepaid lease payments.
No adjustments have been made for operating leases in which the underlying asset is of low value per paragraph C9 (a) of the Standard.
The transitional provisions have not been applied to operating leases whose terms end within 12 months of the date of initial application has been employed per paragraph C10 (c) of IFRS 16.
Hindsight is used to determine the lease term when contracts or arrangements contain options to extend or terminate the lease in accordance with C10 (e) of IFRS 16.
Due to transitional provisions employed the requirements for identifying a lease within paragraphs 9 to 11 of IFRS 16 are not employed for leases in existence at the initial date of application. Leases entered into on or after 1 April 2022 will be assessed under the requirements of IFRS 16.
There are further expedients or election that have been employed by NHS England in applying IFRS 16. These include:
The measurement requirements under IFRS 16 are not applied to leases with a term of 12 months or less under paragraph 5 (a) of IFRS 16.
The measurement requirements under IFRS 16 are not applied to leases where the underlying asset is of a low value which are identified as those assets of a value of less than £5,000, excluding any irrecoverable VAT, under paragraph 5 (b) of IFRS 16.
NHS England will not apply IFRS 16 to any new leases of intangible assets applying the treatment described in section 1.12 instead.
HM Treasury have adapted the public sector approach to IFRS 16 which impacts on the identification and measurement of leasing arrangements that will be accounted for under IFRS 16.
NHS England is required to apply IFRS 16 to lease like arrangements entered into with other public sector entities that are in substance akin to an enforceable contract, that in their formal legal form may not be enforceable. Prior to accounting for such arrangements under IFRS 16 NHS England has assessed that in all other respects these arrangements meet the definition of a lease under the Standard.
NHS England is required to apply IFRS 16 to lease like arrangements entered into in which consideration exchanged is nil or nominal, therefore significantly below market value. These arrangements are described as peppercorn leases. Such arrangements are again required to meet the definition of a lease in every other respect prior to inclusion in the scope of IFRS 16. The accounting for peppercorn arrangements aligns to that identified for donated assets. Peppercorn leases are different in substance to arrangements in which consideration is below market value but not significantly below market value.
The nature of the accounting policy change for the lessee is more significant than for the lessor under IFRS 16. IFRS 16 introduces a singular lessee approach to measurement and classification in which lessees recognise a right of use asset.
For the lessor leases remain classified as finance leases when substantially all the risks and rewards incidental to ownership of an underlying asset are transferred to the lessee. When this transfer does not occur, leases are classified as operating leases.
1.16.1 NHS England as a lessee
At the commencement date for the leasing arrangement a lessee shall recognise a right of use asset and corresponding lease liability. NHS England employs a revaluation model for the subsequent measurement of its right of use assets unless cost is considered to be an appropriate proxy for current value in existing use or fair value in line with the accounting policy for owned assets. Where consideration exchanged is identified as below market value, cost is not considered to be an appropriate proxy to value the right of use asset.
Lease payments are apportioned between finance charges and repayment of the principal. Finance charges are recognised in the Statement of Comprehensive Net Expenditure. Irrecoverable VAT is expensed in the period to which it relates and therefore not included in the measurement of the lease liability and consequently the value of the right of use asset.
The incremental borrowing rate of 0.95% has been applied to the lease liabilities recognised at the date of initial application of IFRS 16. Where changes in future lease payments result from a change in an index or rate or rent review, the lease liabilities are remeasured using an unchanged discount rate.
Where there is a change in a lease term or an option to purchase the underlying asset NHS England applies a revised rate to the remaining lease liability.
Where existing leases are modified NHS England must determine whether the arrangement constitutes a separate lease and apply the Standard accordingly.
Lease payments are recognised as an expense on a straight-line or another systematic basis over the lease term, where the lease term is in substance 12 months or less or is elected as a lease containing low value underlying asset by NHS England.
1.17 Non-current assets held for sale
Non-current assets are classified as held for sale if their carrying amount will be recovered principally through a sale transaction rather than through continuing use. This condition is satisfied once both of the following criteria are met:
- the asset is available for immediate sale in its present condition subject only to terms which are usual and customary for such sales; and
- the sale is highly probable
Non-current assets held for sale are measured at the lower of their previous carrying amount and fair value less costs to sell. Fair value is open market value including alternative uses.
The profit or loss arising on disposal of an asset is the difference between the sale proceeds and the carrying amount and is recognised in the statement of comprehensive net expenditure. On disposal, the balance for the asset in the revaluation reserve is transferred to retained earnings.
Property, plant and equipment that is to be scrapped or demolished does not qualify for recognition as held for sale. Instead, it is retained as an operational asset and its economic life is adjusted. The asset is de-recognised when it is scrapped or demolished.
1.18 Inventories
Inventories are valued at the lower of cost and net realisable value and are utilised using the First in First Out method of inventory controls.
1.19 Cash and cash equivalents
Cash is cash in hand and deposits with any financial institution repayable without penalty on notice of not more than 24 hours. Cash equivalents are investments that mature in 3 months or less from the date of acquisition and are readily convertible to known amounts of cash with insignificant risk of change in value.
In the statement of cash flows, cash and cash equivalents are shown net of bank overdrafts that are repayable on demand and that form an integral part of cash management. Cash, bank and overdraft balances are recorded at current values.
1.20 Provisions
Provisions are recognised when there exists a present legal or constructive obligation as a result of a past event, it is probable that the group will be required to settle the obligation, and a reliable estimate can be made of the amount of the obligation. The amount recognised as a provision is the best estimate of the expenditure required to settle the obligation at the end of the reporting period, taking into account the risks and uncertainties. Where a provision is measured using the cash flows estimated to settle the obligation, its carrying amount is the present value of those cash flows using HM Treasury’s discount rates.
Provisions are subject to 3 separate discount rates according to the expected timing of cashflows:
- a nominal short-term rate of 3.27 percent (2021/22: 0.47 percent in real terms) is applied to inflation adjusted expected cash flows up to and including 5 years from Statement of Financial Position date
- a nominal medium-term rate of 3.20 percent (2021/22: 0.70 percent in real terms) is applied to inflation adjusted expected cash flows over 5 years up to and including 10 years from the Statement of Financial Position date
- a nominal long-term rate of 3.51 percent (2021/22: 0.95 percent in real terms) is applied to inflation adjusted expected cash flows over 10 years and up to and including 40 years from the Statement of Financial Position date
1.21 Clinical negligence costs
NHS Resolution operates a risk pooling scheme under which NHS England, CCGs and ICBs pay an annual contribution to NHS Resolution, which in turn settles all clinical negligence claims. The contribution is charged to expenditure. Although NHS Resolution is administratively responsible for all clinical negligence cases, the legal liability rests with the group.
1.22 Non-clinical risk pooling
The NHS England group participates in the Property Expenses Scheme and the Liabilities to Third Parties scheme. Both are risk pooling schemes under which NHS England, CCGs and ICBs pay an annual contribution to NHS Resolution and, in return, receive assistance with the cost of claims arising. The annual membership contributions, and any excesses payable in respect of particular claims, are charged to operating expenses when they become due.
1.23 Contingent liabilities and contingent assets
A contingent liability is:
- a possible obligation that arises from past events and whose existence will be confirmed only by the occurrence or non-occurrence of one or more uncertain future events not wholly within the control of the organisation
- a present obligation that is not recognised because it is not probable that a payment will be required to settle the obligation, or the amount of the obligation cannot be measured sufficiently reliably
A contingent liability is disclosed unless the possibility of a payment is remote.
A contingent asset is a possible asset that arises from past events and whose existence will be confirmed by the occurrence or non-occurrence of one or more uncertain future events not wholly within the control of the organisation. A contingent asset is disclosed where an inflow of economic benefits is probable.
Where the time value of money is material, contingent liabilities that are required to be disclosed under IAS37 are stated at discounted amounts.
1.24 Financial assets
Financial assets are recognised on the statement of financial position when the group becomes party to the financial instrument contract or, in the case of trade receivables, when the goods or services have been delivered. Financial assets are de-recognised when the contractual rights have expired, or the asset has been transferred and the group has transferred substantially all of the risks and rewards of ownership or has not retained control of the asset.
As available for sale financial assets, the group’s investments are measured at fair value. With the exception of impairment losses, changes in value are taken to the revaluation reserve. Accumulated gains or losses are recycled to the consolidated statement of net comprehensive expenditure on de- recognition.
Financial assets are classified into the following categories: financial assets at amortised cost, financial assets at fair value through other comprehensive income, and financial assets at fair value through profit and loss. The classification is determined by the cash flow and business model characteristics of the financial assets, as set out in IFRS 9, and is determined at the time of initial recognition.
1.24.1 Financial assets at amortised cost
Financial assets measured at amortised cost are those held within a business model whose objective is to hold financial assets in order to collect contractual cash flows and where the cash flows are solely payments of principal and interest. This includes most trade receivables, loans receivable, and other simple debt instruments.
After initial recognition, these financial assets are measured at amortised cost using the effective interest method, less any impairment. The effective interest rate is the rate that exactly discounts estimated future cash receipts through the life of the financial asset to the gross carrying amount of the financial asset.
1.24.2 Financial assets at fair value through other comprehensive income
Financial assets measured at fair value through other comprehensive income are those held within a business model whose objective is achieved by both collecting contractual cash flows, and selling financial assets and where the cash flows are solely payments of principal and interest.
1.24.3 Financial assets at fair value through profit and loss
Financial assets measured at fair value through profit or loss are those that are not otherwise measured at amortised cost or fair value through other comprehensive income. This includes derivatives and financial assets acquired principally for the purpose of selling in the short term.
1.24.4 Impairment
For all financial assets measured at amortised cost or at fair value through other comprehensive income (except equity instruments designated at fair value through other comprehensive income), lease receivables and contract assets, NHS England recognises a loss allowance representing expected credit losses on the financial instrument.
NHS England adopts the simplified approach to impairment, in accordance with IFRS 9, and measures the loss allowance for trade receivables, contract assets and lease receivables at an amount equal to lifetime expected credit losses. For other financial assets, the loss allowance is measured at an amount equal to lifetime expected credit losses if the credit risk on the financial instrument has increased significantly since initial recognition (stage 2), and otherwise at an amount equal to 12-month expected credit losses (stage 1).
HM Treasury has ruled that central government bodies may not recognise stage 1 or stage 2 impairments against other government departments, their executive agencies, the Bank of England, Exchequer Funds, and Exchequer Funds’ assets where repayment is ensured by primary legislation. NHS England therefore does not recognise loss allowances for stage 1 or stage 2 impairments against these bodies. Additionally, the Department of Health and Social Care provides a guarantee of last resort against the debts of its arm’s length bodies and NHS bodies (excluding NHS charities), and NHS England does not recognise loss allowances for stage 1 or stage 2 impairments against these bodies.
For financial assets that have become credit impaired since initial recognition (stage 3), expected credit losses at the reporting date are measured as the difference between the asset’s gross carrying amount and the present value of the estimated future cash flows discounted at the financial asset’s original effective interest rate. Any adjustment is recognised in profit or loss as an impairment gain or loss.
1.25 Financial liabilities
Financial liabilities are recognised in the statement of financial position when the group becomes party to the contractual provisions of the financial instrument or, in the case of trade payables, when the goods or services have been received. Financial liabilities are de-recognised when the liability has been discharged; that is, the liability has been paid or has expired.
Financial liabilities are initially recognised at fair value.
After initial recognition, financial liabilities are measured at amortised cost using the effective interest method. The effective interest rate is the rate that exactly discounts estimated future cash payments through the life of the asset to the net carrying amount of the financial liability. Interest is recognised using the effective interest method.
1.26 Accounting standards that have been issued but have not yet been adopted
The FReM does not require the following Standards and Interpretations to be applied in 2022/23. These standards are still subject to HM Treasury FReM adoption.
IFRS 17 Insurance Contracts – Application required for accounting periods beginning on or after 1 January 2021, but not yet adopted by the FReM: early adoption is not therefore permitted.
2. Operating income
|
|
|
Parent |
|
Consolidated group | ||
|
Income from sale of goods and services (contracts) |
|
2022/23 |
2021/22 |
|
2022/23 |
2021/22 |
|
Education, training and research |
|
15,487 |
2,180 |
|
60,728 |
12,269 |
|
Non-patient care services to other bodies |
|
350,769 |
403,229 |
|
3,280,382 |
1,665,898 |
| Prescription fees and charges[3] |
|
519,753 |
641,033 |
|
670,324 |
651,964 |
|
Dental fees and charges141 |
|
631,415 |
633,809 |
|
746,642 |
633,847 |
|
Other contract income |
|
114,309 |
90,366 |
|
324,623 |
243,871 |
|
Recoveries in respect of employee benefits |
|
(49) |
305 |
|
9,193 |
11,842 |
|
Total income from sale of goods and services |
|
1,631,684 |
1,770,922 |
|
5,091,892 |
3,219,691 |
|
Other operating income |
|
|
|
|
|
|
|
Rental revenue from finance leases |
|
– |
– |
|
147 |
87 |
|
Rental revenue from operating leases |
|
– |
– |
|
4,051 |
2,053 |
|
Charitable and other contributions to revenue expenditure: non-NHS |
|
5 |
48 |
|
1,246 |
684 |
|
Receipt of donations (capital/cash)175F[4] |
|
11,598 |
– |
|
13,043 |
– |
|
Non-cash apprenticeship training grants revenue |
|
1,159 |
848 |
|
1,920 |
1,313 |
|
Other non-contract revenue |
|
891 |
10,153 |
|
110,137 |
80,968 |
|
Total other operating income |
|
13,653 |
11,049 |
|
130,544 |
85,105 |
|
Total operating income |
|
1,645,337 |
1,781,971 |
|
5,222,436 |
3,304,796 |
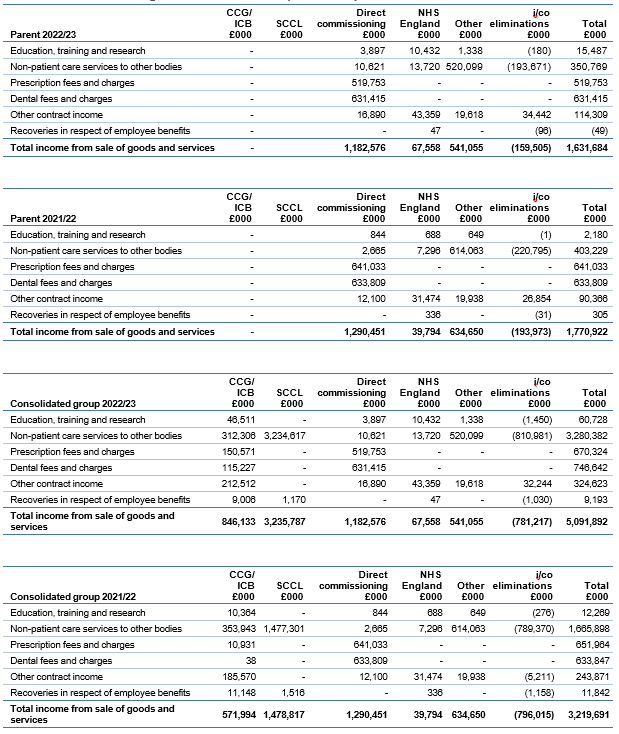
Intercompany trading is eliminated between bodies within the NHS England group upon consolidation.
In October 2021 NHS England, the Parent, acquired 100% of the shareholding of SCCL. As a result, the assets, liabilities and ongoing operational income and expenditure form part of the NHS England consolidated group account for the full year. There has therefore been a significant growth in income and expenditure year on year.
2.1 Disaggregation of revenue
We disaggregate our revenue from contracts with customers by the nature of the revenue. This is shown in Note 2. Note 2.1 provides the disaggregation in line with our operating segments reported in Note 18.
Income from sale of goods and services (contracts)
|
Parent 2022/23 |
CCG/ |
SCCL |
Direct commissioning |
NHS |
Other |
i/co eliminations |
Total |
|
Education, training and research |
– |
– |
3,897 |
10,432 |
1,338 |
(180) |
15,487 |
|
Non-patient care services to other bodies |
– |
– |
10,621 |
13,720 |
520,099 |
(193,671) |
350,769 |
|
Prescription fees and charges |
– |
– |
519,753 |
– |
– |
– |
519,753 |
|
Dental fees and charges |
– |
– |
631,415 |
– |
– |
– |
631,415 |
|
Other contract income |
– |
– |
16,890 |
43,359 |
19,618 |
34,442 |
114,309 |
|
Recoveries in respect of employee benefits |
– |
– |
– |
47 |
– |
(96) |
(49) |
|
Total income from sale of goods and services |
– |
– |
1,182,576 |
67,558 |
541,055 |
(159,505) |
1,631,684 |
|
Parent 2021/22 |
CCG/ |
SCCL |
Direct commissioning |
NHS |
Other |
i/co eliminations |
Total |
|
Education, training and research |
– |
– |
844 |
688 |
649 |
(1) |
2,180 |
|
Non-patient care services to other bodies |
– |
– |
2,665 |
7,296 |
614,063 |
(220,795) |
403,229 |
|
Prescription fees and charges |
– |
– |
641,033 |
– |
– |
– |
641,033 |
|
Dental fees and charges |
– |
– |
633,809 |
– |
– |
– |
633,809 |
|
Other contract income |
– |
– |
12,100 |
31,474 |
19,938 |
26,854 |
90,366 |
|
Recoveries in respect of employee benefits |
– |
– |
– |
336 |
– |
(31) |
305 |
|
Total income from sale of goods and services |
– |
– |
1,290,451 |
39,794 |
634,650 |
(193,973) |
1,770,922 |
|
Consolidated group 2022/23 |
CCG/ |
SCCL |
Direct commissioning |
NHS |
Other |
i/co eliminations |
Total |
|
Education, training and research |
46,511 |
– |
3,897 |
10,432 |
1,338 |
(1,450) |
60,728 |
|
Non-patient care services to other bodies |
312,306 |
3,234,617 |
10,621 |
13,720 |
520,099 |
(810,981) |
3,280,382 |
|
Prescription fees and charges |
150,571 |
– |
519,753 |
– |
– |
– |
670,324 |
|
Dental fees and charges |
115,227 |
– |
631,415 |
– |
|
– |
746,642 |
|
Other contract income |
212,512 |
– |
16,890 |
43,359 |
19,618 |
32,244 |
324,623 |
|
Recoveries in respect of employee benefits |
9,006 |
1,170 |
– |
47 |
– |
(1,030) |
9,193 |
|
Total income from sale of goods and services |
846,133 |
3,235,787 |
1,182,576 |
67,558 |
541,055 |
(781,217) |
5,091,892 |
|
Consolidated group 2021/22 |
CCG/ |
SCCL |
Direct commissioning |
NHS |
Other |
i/co eliminations |
Total |
|
Education, training and research |
10,364 |
– |
844 |
688 |
649 |
(276) |
12,269 |
|
Non-patient care services to other bodies |
353,943 |
1,477,301 |
2,665 |
7,296 |
614,063 |
(789,370) |
1,665,898 |
|
Prescription fees and charges |
10,931 |
– |
641,033 |
– |
– |
– |
651,964 |
|
Dental fees and charges |
38 |
– |
633,809 |
– |
– |
– |
633,847 |
|
Other contract income |
185,570 |
– |
12,100 |
31,474 |
19,938 |
(5,211) |
243,871 |
|
Recoveries in respect of employee benefits |
11,148 |
1,516 |
– |
336 |
– |
(1,158) |
11,842 |
|
Total income from sale of goods and services |
571,994 |
1,478,817 |
1,290,451 |
39,794 |
634,650 |
(796,015) |
3,219,691 |
3. Employee benefits
3.1. Employee benefits table
|
|
Parent |
|
Consolidated group | ||
|
Employee benefits |
2022/23 |
2021/22 |
|
2022/23 |
2021/22 |
|
Salaries and wages |
1,164,104 |
877,669 |
|
2,520,724 |
2,005,815 |
|
Social security costs |
117,935 |
89,225 |
|
256,388 |
200,621 |
|
Employer contributions to NHS Pension scheme |
174,766 |
145,748 |
|
380,334 |
328,157 |
|
Other pension costs |
11 |
7 |
|
2,941 |
1,154 |
|
Apprenticeship levy |
4,845 |
154 |
|
9,664 |
8,875 |
|
Other employment benefits |
– |
5,305 |
|
– |
154 |
|
Termination benefits |
78,859 |
1,247 |
|
91,218 |
4,519 |
|
Gross employee benefits expenditure |
1,540,520 |
1,119,355 |
|
3,261,269 |
2,549,295 |
|
Less: Employee costs capitalised |
(4,056) |
– |
|
(4,056) |
– |
|
Gross employee benefits excluding capitalised costs |
1,536,464 |
1,119,355 |
|
3,257,213 |
2,549,295 |
|
Less recoveries in respect of employee benefits |
49 |
(306) |
|
(9,193) |
(11,842) |
|
Net employee benefits |
1,536,513 |
1,119,049 |
|
3,248,020 |
2,537,453 |
Staff numbers can be found in the Accountability Report on page 88.
3.2 Pension costs
Past and present employees are covered by the provisions of the 2 NHS Pension schemes. Details of 0.42the benefits payable and rules of the schemes can be found on the NHS Pensions website at www.nhsbsa.nhs.uk/pensions. Both are unfunded defined benefit schemes that cover NHS employers, GP practices and other bodies, allowed under the direction of the Secretary of State for Health and Social Care in England and Wales. They are not designed to be run in a way that would enable NHS bodies to identify their share of the underlying scheme assets and liabilities. Therefore, each scheme is accounted for as if it were a defined contribution scheme: the cost to the NHS body of participating in each scheme is taken as equal to the contributions.
In order that the defined benefit obligations recognised in the financial statements do not differ materially from those that would be determined at the reporting date by a formal actuarial valuation, the FReM requires that “the period between formal valuations shall be four years, with approximate assessments in intervening years”. An outline of these follows:
3.2.1 Accounting valuation
A valuation of scheme liability is carried out annually by the scheme actuary (currently the Government Actuary’s Department) as at the end of the reporting period. This utilises an actuarial assessment for the previous accounting period in conjunction with updated membership and financial data for the current reporting period and is accepted as providing suitably robust figures for financial reporting purposes. The valuation of the scheme liability as at 31 March 2023, is based on valuation data as 31 March 2022, updated to 31 March 2023 with summary global member and accounting data. In undertaking this actuarial assessment, the methodology prescribed in IAS 19, relevant FReM interpretations, and the discount rate prescribed by HM Treasury have also been used.
The latest assessment of the liabilities of the scheme is contained in the report of the scheme actuary, which forms part of the annual NHS Pension Scheme Accounts. These accounts can be viewed on the NHS Pensions website and are published annually. Copies can also be obtained from The Stationery Office.
Full actuarial (funding) valuation
The purpose of this valuation is to assess the level of liability in respect of the benefits due under the schemes (taking into account recent demographic experience), and to recommend contribution rates payable by employees.
The latest actuarial valuation undertaken for the NHS Pension Scheme was completed as at 31 March 2016. The results of this valuation set the employer contribution rate payable from April 2019 to 20.6% of pensionable pay.
The actuarial valuation as at 31 March 2020 is currently underway and will set the new employer contribution rate due to be implemented from April 2024.
3.2 Pension costs
3.2.2 Scheme provisions
The NHS Pension Scheme provided defined benefits, which are summarised below. This list is an illustrative guide only, and is not intended to detail all the benefits provided by the Scheme or the specific conditions that must be met before these benefits can be obtained:
- the Scheme is a “final salary” scheme. Annual pensions are normally based on 1/80th for the 1995 section and of the best of the last 3 years pensionable pay for each year of service, and 1/60th for the 2008 section of reckonable pay per year of membership. Members who are practitioners as defined by the scheme regulations have their annual pensions based upon total pensionable earnings over the relevant pensionable service
- with effect from 1 April 2008 members can choose to give up some of their annual pension for an additional tax-free lump sum, up to a maximum amount permitted under HMRC rules. This new provision is known as ‘pension commutation’
- annual increases are applied to pension payments at rates defined by the Pensions (Increase) Act 1971 and are based on changes in retail prices in the 12 months ending 30 September in the previous calendar year. From 2011/12 the Consumer Price Index has been used and replaced the Retail Prices Index
- early payment of a pension, with enhancement, is available to members of the scheme who are permanently incapable of fulfilling their duties effectively through illness or infirmity. A death gratuity of twice final year’s pensionable pay for death in service, and 5 times their annual pension for death after retirement is payable
- for early retirements other than those due to ill health, the additional pension liabilities are not funded by the scheme. The full amount of the liability for the additional costs is charged to the employer
- members can purchase additional service in the NHS Scheme and contribute to money purchase AVC’s run by the scheme’s approved providers or by other Free Standing Additional Voluntary Contributions providers
3.2.3 Local government pension scheme
Within the group there are CCGs who account for defined benefit pension scheme assets and liabilities primarily in respect of local government super annuation schemes. These schemes are immaterial to the group financial statements and therefore have not been disclosed separately. Full disclosures are available in the underlying CCGs ICBs published accounts.
3.2.4 Principal Civil Service Pension Scheme
Past and present employees are covered by the provisions of the Principal Civil Service Pension Scheme and the Civil Servant and Other Pension Scheme. These schemes are unfunded, defined benefit schemes covering civil servants. The schemes are not designed in a way that would enable employers to identify their share of the underlying scheme assets and liabilities. Therefore, the schemes are accounted for as though they were defined contribution schemes: the cost to NHS England of participating in a scheme is taken as equal to the contributions payable to the scheme for the accounting period.
For defined contribution schemes, such as Civil Service partnership pensions, NHS England recognises the contributions payable for the year.
NHS England recognises the full cost of benefits paid under the Civil Service Compensation Scheme, including the early payment of pensions.
4. Operating expenses
|
Purchase of goods and services – cash |
|
Parent 2022/23 |
Parent 2021/22 |
|
Consolidated group 2022/23 |
Consolidated group 2021/22 |
|
Services from other CCGs, ICBs and NHS England |
|
27,230 |
12,201 |
|
– |
– |
|
Services from foundation trusts |
|
22,090,846 |
18,674,370 |
|
74,214,062 |
68,920,966 |
|
Services from other NHS trusts |
|
8,869,410 |
7,558,049 |
|
34,579,223 |
32,958,715 |
|
Services from other Whole of Government Accounts (WGA) bodies 176F[5] |
|
6,552 |
8,776 |
|
67,763 |
66,774 |
|
Purchase of healthcare from non-NHS bodies |
|
913,875 |
1,207,066 |
|
16,640,277 |
17,029,247 |
|
Purchase of social care |
|
– |
– |
|
1,024,918 |
931,424 |
|
General dental services and personal dental services |
|
2,593,407 |
3,099,805 |
|
3,023,228 |
3,099,805 |
|
Prescribing costs |
|
21,236 |
21,122 |
|
9,780,935 |
9,089,310 |
|
Pharmaceutical services |
|
1,707,263 |
2,330,486 |
|
2,123,252 |
2,341,120 |
|
General ophthalmic services |
|
440,513 |
545,904 |
|
539,053 |
561,006 |
|
GP primary care services |
|
796,452 |
1,278,041 |
|
11,506,437 |
11,365,278 |
|
Supplies and services – clinical |
|
(508,706) |
(417,252) |
|
(433,679) |
(351,453) |
|
Supplies and services – general |
|
670,147 |
526,520 |
|
1,833,574 |
1,335,720 |
|
Consultancy services |
|
17,290 |
33,899 |
|
51,147 |
75,764 |
|
Establishment |
|
333,827 |
317,982 |
|
615,275 |
608,015 |
|
Transport |
|
6,249 |
1,503 |
|
121,483 |
111,117 |
|
Premises |
|
44,400 |
68,545 |
|
299,040 |
372,604 |
|
Audit fees177F[6] |
|
800 |
480 |
|
19,944 |
10,964 |
|
Other non-statutory audit expenditure178F[7] |
|
– |
– |
|
3,525 |
2,418 |
|
Other professional fees |
|
183,381 |
153,789 |
|
269,820 |
237,105 |
|
Legal fees |
|
10,995 |
7,594 |
|
30,138 |
23,521 |
|
Education and training |
|
70,614 |
58,482 |
|
119,397 |
91,082 |
|
Funding to group bodies179F[8] |
|
118,956,021 |
114,325,074 |
|
– |
– |
|
Total purchase of goods and services – cash |
|
157,251,802 |
149,812,436 |
|
156,428,812 |
148,880,502 |
|
Other operating expenditure – cash |
|
|
|
|
|
|
|
Chair and non-executive members |
|
136 |
121 |
|
14,056 |
32,637 |
|
Grants to other bodies |
|
78,443 |
244,560 |
|
120,164 |
300,071 |
|
Clinical negligence |
|
– |
– |
|
202 |
335 |
|
Research and development (excluding staff costs) |
|
414 |
454 |
|
16,080 |
17,122 |
|
Other expenditure |
|
31,043 |
46,721 |
|
57,446 |
61,693 |
|
Other operating expenditure – cash |
|
110,036 |
291,856 |
|
207,948 |
411,858 |
|
Total operating expenses – cash |
|
157,361,838 |
150,104,292 |
|
156,636,760 |
149,292,360 |
|
Depreciation and impairment charges – non cash items |
|
|
|
|
|
|
|
Depreciation |
|
167,284 |
166,390 |
|
219,012 |
181,604 |
|
Amortisation |
|
38,745 |
13,776 |
|
40,270 |
14,796 |
|
Impairments and reversals of property, plant and equipment |
|
– |
– |
|
– |
742 |
|
Impairments and reversals of right-of-use-assets |
|
– |
– |
|
(12) |
– |
|
Total depreciation and impairment charges |
|
206,029 |
180,166 |
|
259,270 |
197,142 |
|
Purchase of goods and services – cash |
|
Parent 2022/23 |
Parent 2021/22 |
Consolidated group 2022/23 |
Consolidated group 2021/22 |
|
Provision expense – non-cash items |
|
|
|
|
|
|
Change in discount rate |
|
(245,623) |
(23,209) |
(246,120) |
(23,040) |
|
Provisions |
|
276,316 |
101,217 |
279,315 |
173,853 |
|
Total provision expense |
|
30,693 |
78,008 |
33,195 |
150,813 |
|
Purchase of goods and services – non-cash |
|
|
|
|
|
|
Non-cash apprenticeship training grants |
|
1,159 |
848 |
1,920 |
1,313 |
|
Total purchase of goods and services – non-cash |
|
1,159 |
848 |
1,920 |
1,313 |
|
Other operating expenditure – non-cash items |
|
|
|
|
|
|
Expected credit loss on receivables |
|
4,258 |
1,418 |
12,917 |
1,344 |
|
Inventories written down |
|
1,097 |
– |
2,321 |
1,529 |
|
Inventories consumed |
|
43,803 |
138,275 |
2,669,468 |
1,482,348 |
|
Total other operating expenditure |
|
49,158 |
139,693 |
2,684,706 |
1,485,221 |
|
Total other operating expenses – non-cash |
|
287,039 |
398,715 |
2,979,091 |
1,834,489 |
|
Total operating expenditure |
|
157,648,877 |
150,503,007 |
159,615,851 |
151,126,849 |
Intercompany trading is eliminated between bodies within the NHS England group upon consolidation.
In October 2021 NHS England, the Parent, acquired 100% of the shareholding of SCCL. As a result, the assets, liabilities and ongoing operational income and expenditure form part of the NHS England consolidated group account from this date. There has therefore been a significant growth in income and expenditure year on year.
5. Property, plant, and equipment
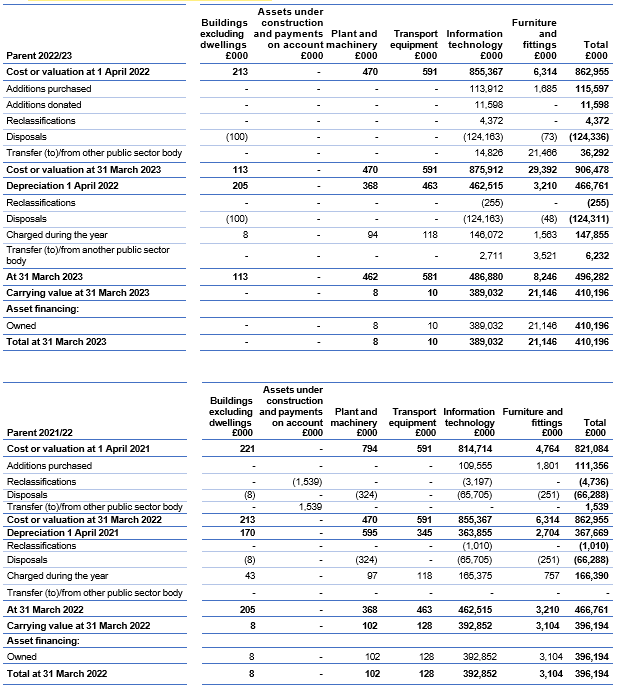
|
Parent 2022/23 |
|
Buildings excluding dwellings£000 |
Assets under construction and payments on account |
Plant and machinery |
Transport equipment |
Information technology |
Furniture and fittings |
Total |
|
Cost or valuation at 1 April 2022 |
|
213 |
– |
470 |
591 |
855,367 |
6,314 |
862,955 |
|
Additions purchased |
|
– |
– |
– |
– |
113,912 |
1,685 |
115,597 |
|
Additions donated |
|
– |
– |
– |
– |
11,598 |
– |
11,598 |
|
Reclassifications |
|
– |
– |
– |
– |
4,372 |
– |
4,372 |
|
Disposals |
|
(100) |
– |
– |
– |
(124,163) |
(73) |
(124,336) |
|
Transfer (to)/from other public sector body |
|
– |
– |
– |
– |
14,826 |
21,466 |
36,292 |
|
Cost or valuation at 31 March 2023 |
|
113 |
– |
470 |
591 |
875,912 |
29,392 |
906,478 |
|
Depreciation 1 April 2022 |
|
205 |
– |
368 |
463 |
462,515 |
3,210 |
466,761 |
|
Reclassifications |
|
– |
– |
– |
– |
(255) |
– |
(255) |
|
Disposals |
|
(100) |
– |
– |
– |
(124,163) |
(48) |
(124,311) |
|
Charged during the year |
|
8 |
– |
94 |
118 |
146,072 |
1,563 |
147,855 |
|
Transfer (to)/from another public sector body |
|
– |
– |
– |
– |
2,711 |
3,521 |
6,232 |
|
At 31 March 2023 |
|
113 |
– |
462 |
581 |
486,880 |
8,246 |
496,282 |
|
Carrying value at 31 March 2023 |
|
– |
– |
8 |
10 |
389,032 |
21,146 |
410,196 |
|
Asset financing: |
|
|
|
|
|
|
|
|
|
Owned |
|
– |
– |
8 |
10 |
389,032 |
21,146 |
410,196 |
|
Total at 31 March 2023 |
|
– |
– |
8 |
10 |
389,032 |
21,146 |
410,196 |
|
Parent 2021/22 |
|
Buildings excluding dwellings |
Assets under construction and payments on account |
Plant and machinery |
Transport equipment |
Information technology |
Furniture and fittings |
Total |
|
Cost or valuation at 1 April 2021 |
|
221 |
– |
794 |
591 |
814,714 |
4,764 |
821,084 |
|
Additions purchased |
|
– |
– |
– |
– |
109,555 |
1,801 |
111,356 |
|
Reclassifications |
|
– |
(1,539) |
– |
– |
(3,197) |
– |
(4,736) |
|
Disposals |
|
(8) |
– |
(324) |
– |
(65,705) |
(251) |
(66,288) |
|
Transfer (to)/from other public sector body |
|
– |
1,539 |
– |
– |
– |
– |
1,539 |
|
Cost or valuation at 31 March 2022 |
|
213 |
– |
470 |
591 |
855,367 |
6,314 |
862,955 |
|
Depreciation 1 April 2021 |
|
170 |
– |
595 |
345 |
363,855 |
2,704 |
367,669 |
|
Reclassifications |
|
– |
– |
– |
– |
(1,010) |
– |
(1,010) |
|
Disposals |
|
(8) |
– |
(324) |
– |
(65,705) |
(251) |
(66,288) |
|
Charged during the year |
|
43 |
– |
97 |
118 |
165,375 |
757 |
166,390 |
|
Transfer (to)/from other public sector body |
|
– |
– |
– |
– |
– |
– |
– |
|
At 31 March 2022 |
|
205 |
– |
368 |
463 |
462,515 |
3,210 |
466,761 |
|
Carrying value at 31 March 2022 |
|
8 |
– |
102 |
128 |
392,852 |
3,104 |
396,194 |
|
Asset financing: |
| |||||||
|
Owned |
|
8 |
– |
102 |
128 |
392,852 |
3,104 |
396,194 |
|
Total at 31 March 2022 |
|
8 |
– |
102 |
128 |
392,852 |
3,104 |
396,194 |
|
Consolidated group 2022/23 |
|
Buildings excluding dwellings |
Assets under construction and payments on account |
Plant and machinery |
Transport equipment |
Information technology |
Furniture |
Total |
|
Cost or valuation at 1 April 2022 |
|
9,064 |
26,019 |
30,893 |
694 |
931,368 |
21,042 |
1,019,080 |
|
Addition of assets under construction and payments on account |
|
– |
14,949 |
– |
– |
– |
– |
14,949 |
|
Additions purchased |
|
11 |
– |
179 |
– |
116,285 |
1,797 |
118,272 |
|
Additions donated |
|
– |
– |
– |
– |
11,598 |
– |
11,598 |
|
Reclassifications |
|
– |
(5,148) |
– |
– |
5,788 |
45 |
685 |
|
Disposals |
|
(1,191) |
– |
(20,734) |
– |
(141,976) |
(3,320) |
(167,221) |
|
Transfer (to)/from other public sector body |
|
– |
– |
– |
– |
32,737 |
22,606 |
55,343 |
|
Cost or valuation at 31 March 2023 |
|
7,884 |
35,820 |
10,338 |
694 |
955,800 |
42,170 |
1,052,706 |
|
Depreciation 1 April 2022 |
|
3,199 |
– |
18,522 |
566 |
509,975 |
11,825 |
544,087 |
|
Reclassifications |
|
– |
– |
– |
– |
(236) |
– |
(236) |
|
Disposals |
|
(1,191) |
– |
(14,185) |
– |
(141,719) |
(3,294) |
(160,389) |
|
Charged during the year |
|
863 |
– |
3,884 |
118 |
156,396 |
2,528 |
163,789 |
|
Transfer (to)/from other public sector body |
|
– |
– |
– |
– |
19,477 |
4,661 |
24,138 |
|
At 31 March 2023 |
|
2,871 |
– |
8,221 |
684 |
543,893 |
15,720 |
571,389 |
|
Carrying value at 31 March 2023 |
|
5,013 |
35,820 |
2,117 |
10 |
411,907 |
26,450 |
481,317 |
|
Asset financing: |
|
|
|
|
|
|
|
|
|
Owned |
|
5,013 |
35,820 |
2,117 |
10 |
411,907 |
26,450 |
481,317 |
|
Total at 31 March 2023 |
|
5,013 |
35,820 |
2,117 |
10 |
411,907 |
26,450 |
481,317 |
|
Consolidated group 2021/22 |
|
Buildings excluding dwellings |
Assets under construction and payments on account £000 |
Plant and machinery |
Transport equipment |
Information technology |
Furniture and fittings |
Total |
|
Cost or valuation at 1 April 2021 |
|
2,643 |
115 |
10,337 |
694 |
878,009 |
16,007 |
907,805 |
|
Addition of assets under construction and payments on account |
|
– |
15,154 |
– |
– |
– |
– |
15,154 |
|
Additions purchased |
|
– |
– |
125 |
– |
113,179 |
1,891 |
115,195 |
|
Reclassifications |
|
(38) |
(16,527) |
11 |
– |
11,362 |
(38) |
(5,230) |
|
Disposals |
|
(216) |
(115) |
(3,267) |
– |
(84,358) |
(3,183) |
(91,139) |
|
Impairments charged |
|
– |
– |
– |
– |
– |
– |
– |
|
Transfer (to)/from other public sector body |
|
6,675 |
27,392 |
23,687 |
– |
13,176 |
6,365 |
77,295 |
|
Cost or valuation at 31 March 2022 |
|
9,064 |
26,019 |
30,893 |
694 |
931,368 |
21,042 |
1,019,080 |
|
Depreciation 1 April 2021 |
|
896 |
– |
7,864 |
448 |
413,065 |
11,695 |
433,968 |
|
Reclassifications |
|
(38) |
– |
12 |
– |
(1,441) |
(35) |
(1,502) |
|
Disposals |
|
(127) |
– |
(2,902) |
– |
(83,583) |
(2,799) |
(89,411) |
|
Impairments charged |
|
742 |
– |
– |
– |
– |
– |
742 |
|
Charged during the year |
|
572 |
– |
2,667 |
118 |
176,060 |
2,187 |
181,604 |
|
Transfer (to)/from other public sector body |
|
1,154 |
– |
10,881 |
– |
5,874 |
777 |
18,686 |
|
At 31 March 2022 |
|
3,199 |
– |
18,522 |
566 |
509,975 |
11,825 |
544,087 |
|
Carrying value at 31 March 2022 |
|
5,865 |
26,019 |
12,371 |
128 |
421,393 |
9,217 |
474,993 |
|
Asset financing |
|
|
|
|
|
|
|
|
|
Owned |
|
5,865 |
26,019 |
11,860 |
128 |
421,393 |
9,217 |
474,482 |
|
Held on finance lease |
|
– |
– |
511 |
– |
– |
– |
511 |
|
Total at 31 March 2022 |
|
5,865 |
26,019 |
12,371 |
128 |
421,393 |
9,217 |
474,993 |
6. Right-of-use assets
6.1 Right-of-use assets
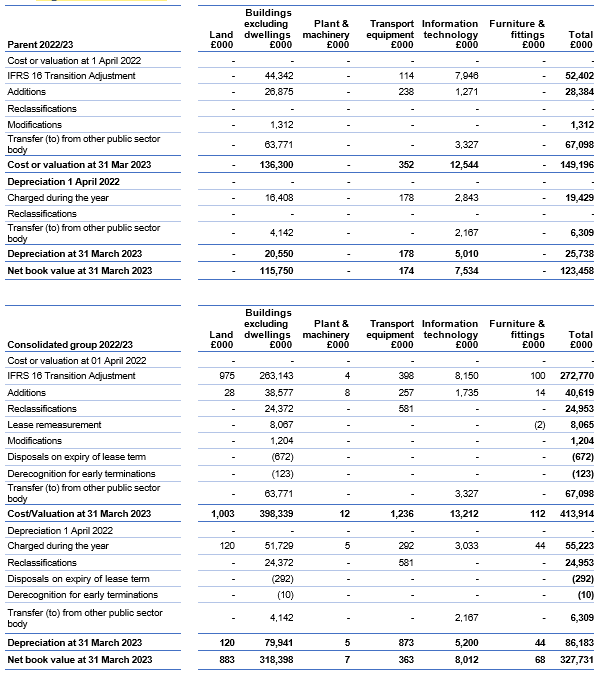
|
Parent 2022/23 |
|
Land |
Buildings excluding dwellings |
Plant & machinery |
Transport equipment |
Information technology |
Furniture & fittings |
Total |
|
Cost or valuation at 1 April 2022 |
|
– |
– |
– |
– |
– |
– |
– |
|
IFRS 16 Transition Adjustment |
|
– |
44,342 |
– |
114 |
7,946 |
– |
52,402 |
|
Additions |
|
– |
26,875 |
– |
238 |
1,271 |
– |
28,384 |
|
Reclassifications |
|
– |
– |
– |
– |
– |
– |
– |
|
Modifications |
|
– |
1,312 |
– |
– |
– |
– |
1,312 |
|
Transfer (to) from other public sector body |
|
– |
63,771 |
– |
– |
3,327 |
– |
67,098 |
|
Cost or valuation at 31 Mar 2023 |
|
– |
136,300 |
– |
352 |
12,544 |
– |
149,196 |
|
Depreciation 1 April 2022 |
|
– |
– |
– |
– |
– |
– |
– |
|
Charged during the year |
|
– |
16,408 |
– |
178 |
2,843 |
– |
19,429 |
|
Reclassifications |
|
– |
– |
– |
– |
– |
– |
– |
|
Transfer (to) from other public sector body |
|
– |
4,142 |
– |
– |
2,167 |
– |
6,309 |
|
Depreciation at 31 March 2023 |
|
– |
20,550 |
– |
178 |
5,010 |
– |
25,738 |
|
Net book value at 31 March 2023 |
|
– |
115,750 |
– |
174 |
7,534 |
– |
123,458 |
|
Consolidated group 2022/23 |
|
Land |
Buildings excluding dwellings |
Plant & machinery |
Transport equipment |
Information technology |
Furniture & fittings |
Total |
|
Cost or valuation at 01 April 2022 |
|
– |
– |
– |
– |
– |
– |
– |
|
IFRS 16 Transition Adjustment |
|
975 |
263,143 |
4 |
398 |
8,150 |
100 |
272,770 |
|
Additions |
|
28 |
38,577 |
8 |
257 |
1,735 |
14 |
40,619 |
|
Reclassifications |
|
– |
24,372 |
– |
581 |
– |
– |
24,953 |
|
Lease remeasurement |
|
– |
8,067 |
– |
– |
– |
(2) |
8,065 |
|
Modifications |
|
– |
1,204 |
– |
– |
– |
– |
1,204 |
|
Disposals on expiry of lease term |
|
– |
(672) |
– |
– |
– |
– |
(672) |
|
Derecognition for early terminations |
|
– |
(123) |
– |
– |
– |
– |
(123) |
|
Transfer (to) from other public sector body |
|
– |
63,771 |
– |
– |
3,327 |
– |
67,098 |
|
Cost/Valuation at 31 March 2023 |
|
1,003 |
398,339 |
12 |
1,236 |
13,212 |
112 |
413,914 |
|
Depreciation 1 April 2022 |
|
– |
– |
– |
– |
– |
– |
– |
|
Charged during the year |
|
120 |
51,729 |
5 |
292 |
3,033 |
44 |
55,223 |
|
Reclassifications |
|
– |
24,372 |
– |
581 |
– |
– |
24,953 |
|
Disposals on expiry of lease term |
|
– |
(292) |
– |
– |
– |
– |
(292) |
|
Derecognition for early terminations |
|
– |
(10) |
– |
– |
– |
– |
(10) |
|
Transfer (to) from other public sector body |
|
– |
4,142 |
– |
– |
2,167 |
– |
6,309 |
|
Depreciation at 31 March 2023 |
|
120 |
79,941 |
5 |
873 |
5,200 |
44 |
86,183 |
|
Net book value at 31 March 2023 |
|
883 |
318,398 |
7 |
363 |
8,012 |
68 |
327,731 |
6.2 Right of use asset lease liabilities
|
2022/23 |
|
Parent £’000 |
|
Consolidated group £’000 |
|
Right of use asset lease liabilities at 01 April 2022 |
|
|
| |
|
IFRS 16 Transition Adjustment |
|
(52,402) |
|
(305,211) |
|
Addition of Assets under Construction & Payments on Account |
|
– |
|
– |
|
Additions purchased |
|
(28,080) |
|
(40,851) |
|
Reclassifications |
|
– |
|
1,301 |
|
Interest expense relating to lease liabilities |
|
– |
|
(2,846) |
|
Repayment of lease liabilities (including interest) |
|
(795) |
|
51,112 |
|
Lease remeasurement |
|
20,383 |
|
(12,747) |
|
Modifications |
|
(71) |
|
25 |
|
Disposals on expiry of lease term |
|
– |
|
366 |
|
Derecognition for early terminations |
|
– |
|
172 |
|
Transfer from/(to) other public sector body |
|
– |
|
(56,054) |
|
Other |
|
(70,769) |
|
33,151 |
|
Right of use asset lease liabilities on 31 March 2023 |
|
(131,734) |
|
(331,582) |
6.3 Right of use asset lease liabilities – maturity analysis of undiscounted future lease payments
|
2022/23 |
|
Parent |
|
Consolidated group £’000 |
|
Within 1 year |
|
(29,398) |
|
(61,974) |
|
Between 1 and 5 years |
|
(58,783) |
|
(146,360) |
|
After 5 years |
|
(50,603) |
|
(139,362) |
|
Balance on 31 December 2022 |
|
(138,784) |
|
(347,696) |
|
Effect of discounting |
|
7,050 |
|
16,114 |
|
Included in: |
|
|
| |
|
Current right of use asset lease liabilities |
|
(27,004) |
|
(55,455) |
|
Non-current right of use asset lease liabilities |
|
(104,730) |
|
(276,127) |
|
Balance at 31 December 2022 |
|
(131,734) |
|
(331,582) |
6.4 Impact of IFRS 16
The table below reconciles the amount disclosed as future operating lease commitments on 31 March 2022 as disclosed in the NHS England parent 2021/22 financial statements to the amount recognised on the Statement of Financial Position in respect of right of use lease liabilities on adoption of IFRS 16.
|
Consolidated group 2022/23 |
Parent |
|
Consolidated |
|
Operating lease commitments under IAS 17 on 31 March 2022 |
(58,846) |
|
(212,098) |
|
Incremental borrowing rate |
0.95% |
|
0.95% |
|
Operating lease commitments under IAS17 discounted using incremental |
(58,842) |
|
(178,453) |
|
Add: Finance lease liabilities at 31 March 2022 |
– |
|
(79,319) |
|
Add: Residual value guarantees |
– |
|
(1,192) |
|
Add: Rentals associated with extension options reasonably certain to be exercised |
– |
|
(20,494) |
|
Add: Leases without full documentation previously excluded from operating lease disclosure |
(9,799) |
|
(10,069) |
|
Add: Differences in the assessment of the lease term used for future minimum payments at |
(1,889) |
|
(407) |
|
Less: Short-term leases (including those with <12 months at application date) |
2,458 |
|
2,816 |
|
Less: Low value leases |
– |
|
116 |
|
Less: Variable payments not included in the valuation of the lease liabilities |
– |
|
6,416 |
|
Less: Correction of immaterial prior period error in IAS 17 disclosure |
7,014 |
|
5,177 |
|
Add/Less: Other |
6,656 |
|
(29,802) |
|
Lease liability on 1 April 2022 under IFRS 16 |
(52,402) |
|
(305,211) |
The comparative information for future minimum lease payments under IAS 17 is below
|
Payments recognised as an expense under IAS17 |
Parent 2021/22 |
|
Consolidated group 2021/22 | ||||
|
Buildings |
Other |
Total |
|
Buildings |
Other |
Total | |
|
Minimum lease payments |
49,087 |
465 |
49,552 |
|
120,934 |
1,235 |
122,169 |
|
Contingent rents |
– |
– |
– |
|
– |
1,531 |
1,531 |
|
Total |
49,087 |
465 |
49,552 |
|
120,934 |
2,766 |
123,700 |
|
Future minimum lease payments under IAS17 Payable: |
Parent 2021/22 |
|
Consolidated group 2021/22 | ||||
|
Buildings |
Other |
Total |
|
Buildings |
Other |
Total | |
|
No later than 1 year |
26,069 |
199 |
26,268 |
|
52,001 |
684 |
52,685 |
|
Between 1 and 5 years |
25,787 |
137 |
25,924 |
|
99,539 |
533 |
100,072 |
|
After 5 years |
6,654 |
– |
6,654 |
|
59,341 |
– |
59,341 |
|
Total |
58,510 |
336 |
58,846 |
|
210,881 |
1,217 |
212,098 |
6.5 Amounts recognised in statement comprehensive net expenditure
|
Parent 2022/23 |
|
£’000 |
|
Depreciation expense on right-of-use assets |
|
19,430 |
|
Interest expense on lease liabilities |
|
795 |
|
Expense relating to short-term leases |
|
3,315 |
|
Consolidated group 2022/23 |
| |
|
Depreciation expense on right-of-use assets |
|
55,222 |
|
Interest expense on lease liabilities |
|
2,805 |
|
Expense relating to short-term leases |
|
3,540 |
|
Expense relating to leases of low value assets |
|
(34) |
|
Expense relating to variable lease payments not included in the measurement of the lease liability |
|
971 |
6.6 Amounts recognised in statement of cash flows
|
Parent 2022/23 |
|
£’000 |
|
Total cash outflow on leases under IFRS 16 |
|
20,383 |
|
Consolidated group 2022/23 |
|
£’000 |
|
Total cash outflow on leases under IFRS 16 |
|
51,535 |
|
Total cash outflow for lease payments not included within the measurement of lease liabilities |
|
283 |
7. Intangible non-current assets
|
Parent 2022/23 |
|
Computer |
|
Development expenditure (internally generated) |
|
Websites |
|
Total |
|
Cost or valuation on 1 April 2022 |
|
57,742 |
|
17,141 |
|
– |
|
74,883 |
|
Additions purchased |
|
5,459 |
|
29,663 |
|
– |
|
35,122 |
|
Additions internally generated |
|
– |
|
3,686 |
|
– |
|
3,686 |
|
Reclassifications |
|
(4,372) |
|
– |
|
– |
|
(4,372) |
|
Disposals |
|
(749) |
|
(7,798) |
|
– |
|
(8,547) |
|
Transfer (to)/from another public sector body |
|
16,959 |
|
570,133 |
|
4,127 |
|
591,219 |
|
On 31 March 2023 |
|
75,039 |
|
612,825 |
|
4,127 |
|
691,991 |
|
Amortisation 1 April 2022 |
|
15,902 |
|
2,862 |
|
– |
|
18,764 |
|
Reclassifications |
|
(235) |
|
490 |
|
– |
|
255 |
|
Disposals |
|
(749) |
|
(7,359) |
|
– |
|
(8,108) |
|
Charged during the year |
|
14,384 |
|
24,231 |
|
130 |
|
38,745 |
|
Transfer (to)/from another public sector body |
|
13,186 |
|
256,505 |
|
3,217 |
|
272,908 |
|
At 31 March 2023 |
|
42,488 |
|
276,729 |
|
3,347 |
|
322,564 |
|
Carrying value at 31 March 2023 |
|
32,551 |
|
336,096 |
|
780 |
|
369,427 |
|
Asset financing: |
|
|
|
|
|
|
|
|
|
Owned |
|
32,551 |
|
336,096 |
|
780 |
|
369,427 |
|
Total at 31 March 2023 |
|
32,551 |
|
336,096 |
|
780 |
|
369,427 |
|
Parent 2021/22 |
|
Computer |
|
Development expenditure (internally generated) |
|
Websites |
|
Total |
|
Cost or valuation at 1 April 2021 |
|
46,886 |
|
4,216 |
|
– |
|
51,102 |
|
Additions purchased |
|
9,103 |
|
11,386 |
|
– |
|
20,489 |
|
Reclassifications |
|
3,197 |
|
1,539 |
|
– |
|
4,736 |
|
Disposals |
|
(1,444) |
|
– |
|
– |
|
(1,444) |
|
At 31 March 2022 |
|
57,742 |
|
17,141 |
|
– |
|
74,883 |
|
Amortisation 1 April 2021 |
|
4,218 |
|
1,204 |
|
– |
|
5,422 |
|
Reclassifications |
|
1,010 |
|
– |
|
– |
|
1,010 |
|
Disposals |
|
(1,444) |
|
– |
|
– |
|
(1,444) |
|
Charged during the year |
|
12,118 |
|
1,658 |
|
– |
|
13,776 |
|
At 31 March 2022 |
|
15,902 |
|
2,862 |
|
– |
|
18,764 |
|
Carrying value at 31 March 2022 |
|
41,840 |
|
14,279 |
|
– |
|
56,119 |
|
Asset financing: |
|
|
|
– |
| |||
|
Owned |
|
41,840 |
|
14,279 |
|
– |
|
56,119 |
|
Total at 31 March 2022 |
|
41,840 |
|
14,279 |
|
– |
|
56,119 |
|
Consolidated group 2022/23 |
|
Computer |
|
Development expenditure (internally |
|
Websites |
|
Total |
|
Cost or valuation at 1 April 2022 |
|
66,011 |
|
18,777 |
|
– |
|
84,788 |
|
Additions purchased |
|
5,598 |
|
29,663 |
|
0 |
|
35,261 |
|
Additions internally generated |
|
– |
|
3,686 |
|
– |
|
3,686 |
|
Reclassifications |
|
(685) |
|
– |
|
0 |
|
(685) |
|
Disposals |
|
(4,523) |
|
(7,885) |
|
– |
|
(12,408) |
|
Transfer (to)/from other public sector body |
|
16,959 |
|
570,133 |
|
4,127 |
|
591,219 |
|
At 31 March 2023 |
|
83,360 |
|
614,374 |
|
4,127 |
|
701,861 |
|
Amortisation 1 April 2022 |
|
22,288 |
|
4,277 |
|
– |
|
26,565 |
|
Reclassifications |
|
(254) |
|
490 |
|
– |
|
236 |
|
Disposals |
|
(4,523) |
|
(7,446) |
|
– |
|
(11,969) |
|
Charged during the year |
|
15,690 |
|
24,450 |
|
130 |
|
40,270 |
|
Transfer (to) from another public sector body |
|
13,186 |
|
256,505 |
|
3,217 |
|
272,908 |
|
At 31 March 2023 |
|
46,387 |
|
278,276 |
|
3,347 |
|
328,010 |
|
Carrying value at 31 March 2023 |
|
36,973 |
|
336,098 |
|
780 |
|
373,851 |
|
Asset financing: |
|
|
|
|
|
|
|
|
|
Owned |
|
36,973 |
|
336,098 |
|
780 |
|
373,851 |
|
Total at 31 March 2023 |
|
36,973 |
|
336,098 |
|
780 |
|
373,851 |
|
Consolidated group 2021/22 |
|
Computer |
|
Development expenditure (internally |
|
Websites |
|
Total |
|
Cost or valuation at 1 April 2021 |
|
55,979 |
|
5,851 |
|
– |
|
61,830 |
|
Additions purchased |
|
10,327 |
|
11,386 |
|
– |
|
21,713 |
|
Reclassifications |
|
3,690 |
|
1,540 |
|
– |
|
5,230 |
|
Disposals |
|
(5,127) |
|
– |
|
– |
|
(5,127) |
|
Transfer (to)/from other public sector body |
|
1,142 |
|
– |
|
– |
|
1,142 |
|
At 31 March 2022 |
|
66,011 |
|
18,777 |
|
– |
|
84,788 |
|
Amortisation 1 April 2021 |
|
12,197 |
|
2,398 |
|
– |
|
14,595 |
|
Reclassifications |
|
1,502 |
|
– |
|
– |
|
1,502 |
|
Disposals |
|
(5,089) |
|
– |
|
– |
|
(5,089) |
|
Charged during the year |
|
12,917 |
|
1,879 |
|
– |
|
14,796 |
|
Transfer (to) from another public sector body |
|
761 |
|
– |
|
– |
|
761 |
|
At 31 March 2022 |
|
22,288 |
|
4,277 |
|
– |
|
26,565 |
|
Carrying value at 31 March 2022 |
|
43,723 |
|
14,500 |
|
– |
|
58,223 |
|
Asset financing: |
|
|
|
|
| |||
|
Owned |
|
43,723 |
|
14,500 |
|
– |
|
58,223 |
|
Total at 31 March 2022 |
|
43,723 |
|
14,500 |
|
– |
|
58,223 |
8. Inventories
|
Parent 2022/23 |
|
Consumables |
|
Loan equipment |
|
Other |
|
Total |
|
Balance at 1 April 2022 |
|
7,528 |
|
– |
|
22,383 |
|
29,911 |
|
Additions |
|
– |
|
– |
|
23,969 |
|
23,969 |
|
Inventories recognised as an expense in the period |
|
(1,234) |
|
– |
|
(42,569) |
|
(43,803) |
|
Write-down of inventories (including losses) |
|
(1,097) |
|
– |
|
– |
|
(1,097) |
|
Balance at 31 March 2023 |
|
5,197 |
|
– |
|
3,783 |
|
8,980 |
|
Parent 2021/22 |
|
Consumables |
|
Loan equipment |
|
Other |
|
Total |
|
Balance at 1 April 2021 |
|
15,966 |
|
– |
|
42,863 |
|
58,829 |
|
Additions |
|
– |
|
– |
|
109,357 |
|
109,357 |
|
Inventories recognised as an expense in the period |
|
(8,438) |
|
– |
|
(129,837) |
|
(138,275) |
|
Balance at 31 March 2022 |
|
7,528 |
|
– |
|
22,383 |
|
29,911 |
|
Consolidated group 2022/23 |
|
Consumables |
|
Loan equipment |
|
Other |
|
Total |
|
Balance at 1 April 2022 |
|
159,684 |
|
8,320 |
|
25,052 |
|
193,056 |
|
Additions |
|
2,620,255 |
|
1,907 |
|
30,942 |
|
2,653,104 |
|
Inventories recognised as an expense in the period |
|
(2,624,088) |
|
(1,967) |
|
(43,413) |
|
(2,669,468) |
|
Write-down of inventories (including losses) |
|
(2,321) |
|
– |
|
– |
|
(2,321) |
|
Transfer (to)/from other public sector body |
|
– |
|
– |
|
– |
|
– |
|
Balance at 31 March 2023 |
|
153,530 |
|
8,260 |
|
12,581 |
|
174,371 |
|
Consolidated group 2021/22 |
|
Consumables |
|
Loan equipment |
|
Other |
|
Total |
|
Balance at 1 April 2021 |
|
17,640 |
|
9,814 |
|
43,814 |
|
71,268 |
|
Additions |
|
1,336,502 |
|
3,280 |
|
111,133 |
|
1,450,915 |
|
Inventories recognised as an expense in the period |
|
(1,345,363) |
|
(4,774) |
|
(132,211) |
|
(1,482,348) |
|
Write-down of inventories (including losses) |
|
(1,529) |
|
– |
|
– |
|
(1,529) |
|
Transfer (to)/from other public sector body |
|
152,434 |
|
– |
|
2,316 |
|
154,750 |
|
Balance at 31 March 2022 |
|
159,684 |
|
8,320 |
|
25,052 |
|
193,056 |
9. Trade and other receivables
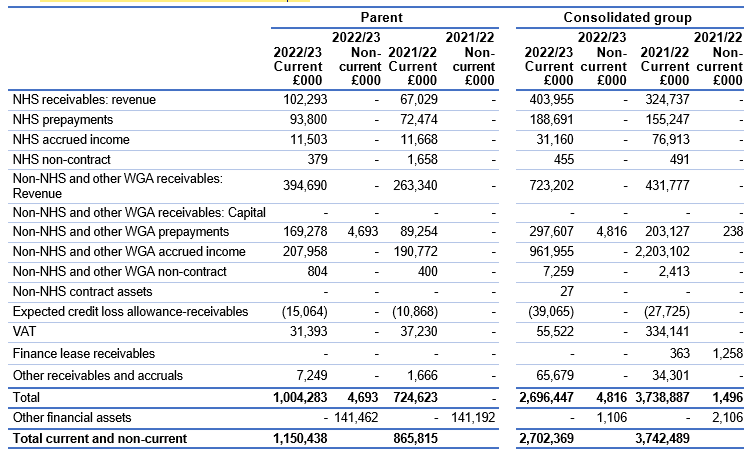
|
|
Parent |
|
Consolidated group | ||||||
|
2022/23 |
2022/23 |
2021/22 |
2021/22 |
|
2022/23 |
2022/23 |
2021/22 |
2021/22 | |
|
NHS receivables: revenue |
102,293 |
– |
67,029 |
– |
|
403,955 |
– |
324,737 |
– |
|
NHS prepayments |
93,800 |
– |
72,474 |
– |
|
188,691 |
– |
155,247 |
– |
|
NHS accrued income |
11,503 |
– |
11,668 |
– |
|
31,160 |
– |
76,913 |
– |
|
NHS non-contract |
379 |
– |
1,658 |
– |
|
455 |
– |
491 |
– |
|
Non-NHS and other WGA receivables: Revenue |
394,690 |
– |
263,340 |
– |
|
723,202 |
– |
431,777 |
– |
|
Non-NHS and other WGA receivables: Capital |
– |
– |
– |
– |
|
– |
– |
– |
– |
|
Non-NHS and other WGA prepayments |
169,278 |
4,693 |
89,254 |
– |
|
297,607 |
4,816 |
203,127 |
238 |
|
Non-NHS and other WGA accrued income |
207,958 |
– |
190,772 |
– |
|
961,955 |
– |
2,203,102 |
– |
|
Non-NHS and other WGA non-contract |
804 |
– |
400 |
– |
|
7,259 |
– |
2,413 |
– |
|
Non-NHS contract assets |
– |
– |
– |
– |
|
27 |
– |
– |
– |
|
Expected credit loss allowance-receivables |
(15,064) |
– |
(10,868) |
– |
|
(39,065) |
– |
(27,725) |
– |
|
VAT |
31,393 |
– |
37,230 |
– |
|
55,522 |
– |
334,141 |
– |
|
Finance lease receivables |
– |
– |
– |
– |
|
– |
– |
363 |
1,258 |
|
Other receivables and accruals |
7,249 |
– |
1,666 |
– |
|
65,679 |
– |
34,301 |
– |
|
Total |
1,004,283 |
4,693 |
724,623 |
– |
|
2,696,447 |
4,816 |
3,738,887 |
1,496 |
|
Other financial assets |
– |
141,462 |
– |
141,192 |
|
– |
1,106 |
– |
2,106 |
|
Total current and non-current |
1,150,438 |
|
865,815 |
|
|
2,702,369 |
|
3,742,489 |
|
10. Cash and cash equivalents
|
|
|
Parent |
|
Consolidated group | ||
|
Note |
2022/23 |
2021/22 |
|
2022/23 |
2021/22 | |
|
Balance at 1 April |
|
229,575 |
150,032 |
|
374,755 |
114,411 |
|
Transfer in from other org under absorption |
|
47,142 |
– |
|
47,142 |
269,704 |
|
Net change in year |
|
98,168 |
79,543 |
|
162,406 |
(9,360) |
|
Balance at statement of financial position date |
|
374,885 |
229,575 |
|
584,303 |
374,755 |
|
Made up of: |
|
|
|
|
| |
|
Cash with the Government Banking Service |
|
345,398 |
214,719 |
|
596,028 |
370,517 |
|
Hosted cash/cash in hand |
|
28,454 |
13,634 |
|
27,988 |
13,433 |
|
Current investments |
|
1,033 |
1,222 |
|
1,033 |
1,222 |
|
Cash and cash equivalents as in statement of financial position |
|
374,885 |
229,575 |
|
625,049 |
385,172 |
|
Bank overdraft: Government Banking Service |
11 |
– |
– |
|
(40,746) |
(10,417) |
|
Total bank overdrafts |
|
– |
– |
|
(40,746) |
(10,417) |
|
Balance at statement of financial position date |
|
374,885 |
229,575 |
|
584,303 |
374,755 |
For details of bank overdraft see note 11 .
Included within hosted cash/cash in hand above is £21.5 million (2021/22 £13.6 million) held on behalf of NHS England by the NHS Business Services Authority.
Current investments within cash and cash equivalents include cash held in solicitor commercial escrow accounts that is not available for use by the group.
11. Trade and other payables
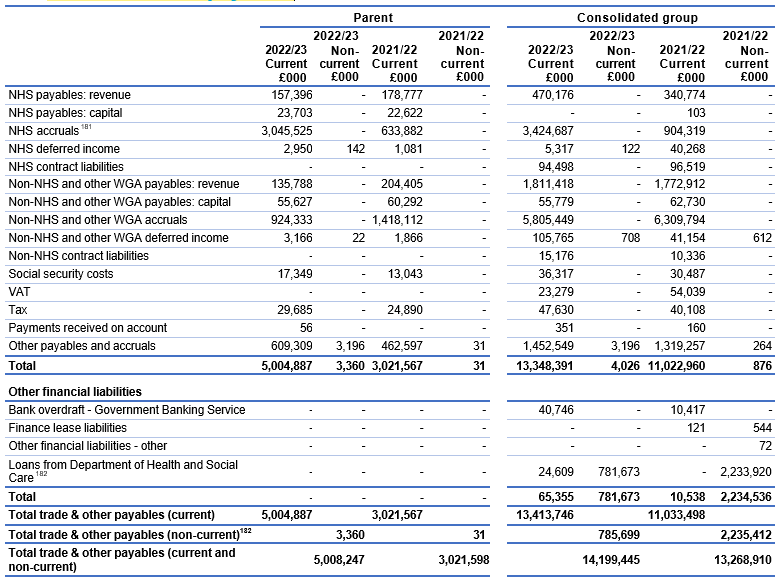
|
|
Parent |
|
Consolidated group | ||||||
|
2022/23 |
2022/23 |
2021/22 |
2021/22 |
|
2022/23 |
2022/23 |
2021/22 |
2021/22 | |
|
NHS payables: revenue |
157,396 |
– |
178,777 |
– |
|
470,176 |
– |
340,774 |
– |
|
NHS payables: capital |
23,703 |
– |
22,622 |
– |
|
– |
– |
103 |
– |
|
NHS accruals180F[9] |
3,045,525 |
– |
633,882 |
– |
|
3,424,687 |
– |
904,319 |
– |
|
NHS deferred income |
2,950 |
142 |
1,081 |
– |
|
5,317 |
122 |
40,268 |
– |
|
NHS contract liabilities |
– |
– |
– |
– |
|
94,498 |
– |
96,519 |
– |
|
Non-NHS and other WGA payables: revenue |
135,788 |
– |
204,405 |
– |
|
1,811,418 |
– |
1,772,912 |
– |
|
Non-NHS and other WGA payables: capital |
55,627 |
– |
60,292 |
– |
|
55,779 |
– |
62,730 |
– |
|
Non-NHS and other WGA accruals |
924,333 |
– |
1,418,112 |
– |
|
5,805,449 |
– |
6,309,794 |
– |
|
Non-NHS and other WGA deferred income |
3,166 |
22 |
1,866 |
– |
|
105,765 |
708 |
41,154 |
612 |
|
Non-NHS contract liabilities |
– |
– |
– |
– |
|
15,176 |
|
10,336 |
– |
|
Social security costs |
17,349 |
– |
13,043 |
– |
|
36,317 |
– |
30,487 |
– |
|
VAT |
– |
– |
– |
– |
|
23,279 |
– |
54,039 |
– |
|
Tax |
29,685 |
– |
24,890 |
– |
|
47,630 |
– |
40,108 |
– |
|
Payments received on account |
56 |
– |
– |
– |
|
351 |
– |
160 |
– |
|
Other payables and accruals |
609,309 |
3,196 |
462,597 |
31 |
|
1,452,549 |
3,196 |
1,319,257 |
264 |
|
Total |
5,004,887 |
3,360 |
3,021,567 |
31 |
|
13,348,391 |
4,026 |
11,022,960 |
876 |
|
Other financial liabilities |
|
|
|
|
|
|
|
|
|
|
Bank overdraft – Government Banking Service |
– |
– |
– |
– |
|
40,746 |
– |
10,417 |
– |
|
Finance lease liabilities |
– |
– |
– |
– |
|
– |
– |
121 |
544 |
|
Other financial liabilities – other |
– |
– |
– |
– |
|
– |
– |
– |
72 |
|
Loans from Department of Health and Social Care181F[10] |
– |
– |
– |
– |
|
24,609 |
781,673 |
– |
2,233,920 |
|
Total |
– |
– |
– |
– |
|
65,355 |
781,673 |
10,538 |
2,234,536 |
|
Total trade & other payables (current) |
5,004,887 |
|
3,021,567 |
|
|
13,413,746 |
|
11,033,498 |
|
|
Total trade & other payables (non-current)182 |
|
3,360 |
|
31 |
|
|
785,699 |
|
2,235,412 |
|
Total trade & other payables (current and non-current) |
|
5,008,247 |
|
3,021,598 |
|
|
14,199,445 |
|
13,268,910 |
12. Net gain/(loss) on transfer by absorption
Business combinations within the public sector are accounted for using absorption accounting principles.
2022/23
On 1 July 2022, the functions of NHS TDA and Monitor transferred to NHS England. The impact of the transfer of the assets and liabilities is shown under NHSI. In addition, the CCGs were dissolved under the Health and Care Act 2022 and the liabilities of the CCGs were transferred in full to the ICBs. There is no impact on the group position as the transactions eliminate in full.
On 1 October 2022, NHS England transferred responsibility for the provisions and liabilities held by NHS England in relation to previously unassessed periods of care (PUPOC) transactions. These transfers eliminate on consolidation to leave nil impact in the group position.
On 1 February 2023, the functions of NHS Digital transferred to NHS England. The assets and liabilities related to the transfer are shown in the table below.
|
Parent 2022/23 |
|
NHSI |
|
NHS Digital |
|
NHS Provider |
|
ICBs |
|
Transfer of property plant and equipment |
|
425 |
|
30,780 |
|
– |
|
(1,145) |
|
Transfer of right-of-use assets |
|
1,946 |
|
58,843 |
|
– |
|
– |
|
Transfer of intangibles |
|
11,030 |
|
307,281 |
|
– |
|
– |
|
Transfer of cash and cash equivalents |
|
41,438 |
|
5,704 |
|
– |
|
– |
|
Transfer of receivables |
|
6,738 |
|
56,404 |
|
(34) |
|
(14,063) |
|
Transfer of payables |
|
(41,571) |
|
(74,777) |
|
330 |
|
8,808 |
|
Transfer of provisions |
|
(3,146) |
|
(6,020) |
|
– |
|
2,398 |
|
Transfer of right-of-use liabilities |
|
(1,949) |
|
(68,820) |
|
– |
|
– |
|
Transfer of PUPOC provision to ICBs |
|
– |
|
– |
|
– |
|
3,165 |
|
Transfer of PUPOC liability to ICBs |
|
– |
|
– |
|
– |
|
4,728 |
|
Net gain on transfers by absorption |
|
14,911 |
|
309,395 |
|
296 |
|
3,891 |
|
Group 2022/23 |
|
NHSI |
|
NHS Digital |
|
NHS Provider |
|
Transfer of property plant and equipment |
|
425 |
|
30,780 |
|
– |
|
Transfer of right-of-use assets |
|
1,946 |
|
58,843 |
|
– |
|
Transfer of intangibles |
|
11,030 |
|
307,281 |
|
– |
|
Transfer of cash and cash equivalents |
|
41,438 |
|
5,704 |
|
– |
|
Transfer of receivables |
|
6,738 |
|
56,404 |
|
6,072 |
|
Transfer of payables |
|
(41,571) |
|
(74,777) |
|
(4,350) |
|
Transfer of provisions |
|
(3,146) |
|
(6,020) |
|
(1,426) |
|
Transfer of right-of-use liabilities |
|
(1,949) |
|
(68,820) |
|
– |
|
Transfer of PUPOC provision to ICBs |
|
– |
|
– |
|
– |
|
Transfer of PUPOC liability to ICBs |
|
– |
|
– |
|
– |
|
Net gain on transfers by absorption |
|
14,911 |
|
309,395 |
|
296 |
2021/22
On 1 October 2021, the activities of Public Health England were divided between DHSC, the UK Health Security Agency, NHS Digital and NHS England. The assets and liabilities transferred to NHS England, the parent, are included in the table below.
On 1 October 2021, the entire shareholding of SCCL transferred from DHSC to NHS England, the parent entity. On consolidation into the NHS England group this equity investment is eliminated and replaced with the net assets and liabilities of SCCL. The value of the net assets transferred under the absorption method is included in the table below.
|
|
|
Parent 2021/22 |
|
Consolidated group 2021/22 | ||
|
|
PHE |
DHSC |
|
PHE |
SCCL | |
|
Transfer of property plant and equipment |
|
– |
– |
|
– |
57,270 |
|
Transfer of intangibles |
|
1,543 |
– |
|
1,543 |
380 |
|
Transfer of financial assets |
|
– |
159,000 |
|
– |
– |
|
Transfer of cash and cash equivalents |
|
– |
– |
|
– |
269,704 |
|
Transfer of inventories |
|
– |
– |
|
– |
154,751 |
|
Transfer of receivables |
|
727 |
– |
|
727 |
370,615 |
|
Transfer of other current assets |
|
– |
– |
|
– |
2,162,901 |
|
Transfer of payables |
|
(6,730) |
– |
|
(6,730) |
(189,221) |
|
Transfer of other current liabilities |
|
– |
– |
|
– |
(595,377) |
|
Transfer of provisions |
|
– |
– |
|
– |
(2,803) |
|
Transfer of non-current borrowings |
|
– |
– |
|
– |
(2,083,920) |
|
Net gain/(loss) on transfers by absorption |
|
(4,460) |
159,000 |
|
(4,460) |
144,300 |
13. Finance costs
|
Interest |
|
Parent |
|
Consolidated group | ||
|
|
2022/23 |
2021/22 |
|
2022/23 |
2021/22 | |
|
Interest on loans and overdrafts |
|
– |
– |
|
28,560 |
150 |
|
Interest on obligations under finance leases |
|
795 |
– |
|
2,805 |
27 |
|
Interest on late payment of commercial debt |
|
– |
– |
|
3 |
– |
|
Other interest expense |
|
27 |
79 |
|
51 |
79 |
|
Total interest |
|
822 |
79 |
|
31,419 |
256 |
|
Other finance costs |
|
– |
– |
|
– |
50 |
|
Provisions: unwinding of discount |
|
4,224 |
2,726 |
|
4,322 |
3,118 |
|
Total finance costs |
|
5,046 |
2,805 |
|
35,741 |
3,424 |
14. Provisions
|
Parent |
|
2022/23 |
2022/23 |
2021/22 |
2021/22 |
|
Restructuring |
|
647 |
– |
3,651 |
– |
|
Redundancy |
|
1,449 |
– |
1,686 |
– |
|
Legal claims |
|
135 |
148 |
133 |
158 |
|
Continuing care |
|
1,444 |
– |
5,228 |
– |
|
Clinician tax charge |
|
5,231 |
272,397 |
2,955 |
286,607 |
|
Other |
|
27,537 |
155,906 |
68,931 |
65,687 |
|
Total |
|
36,443 |
428,451 |
82,584 |
352,452 |
|
Total current and non-current |
|
464,894 |
|
435,036 |
|
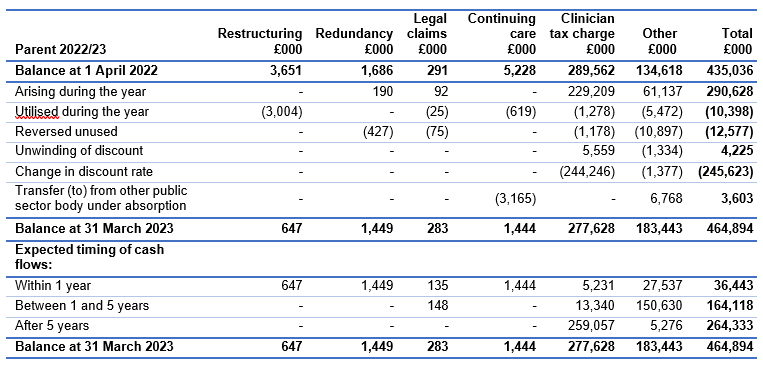
|
Parent 2022/23 |
Restructuring |
Redundancy |
Legal claims |
Continuing care |
Clinician tax charge |
Other |
Total |
|
Balance at 1 April 2022 |
3,651 |
1,686 |
291 |
5,228 |
289,562 |
134,618 |
435,036 |
|
Arising during the year |
– |
190 |
92 |
– |
229,209 |
61,137 |
290,628 |
|
Utilised during the year |
(3,004) |
– |
(25) |
(619) |
(1,278) |
(5,472) |
(10,398) |
|
Reversed unused |
– |
(427) |
(75) |
– |
(1,178) |
(10,897) |
(12,577) |
|
Unwinding of discount |
– |
– |
– |
– |
5,559 |
(1,334) |
4,225 |
|
Change in discount rate |
– |
– |
– |
– |
(244,246) |
(1,377) |
(245,623) |
|
Transfer (to) from other public sector body under absorption |
– |
– |
– |
(3,165) |
– |
6,768 |
3,603 |
|
Balance at 31 March 2023 |
647 |
1,449 |
283 |
1,444 |
277,628 |
183,443 |
464,894 |
|
Expected timing of cash flows: |
|
|
|
|
|
|
|
|
Within 1 year |
647 |
1,449 |
135 |
1,444 |
5,231 |
27,537 |
36,443 |
|
Between 1 and 5 years |
– |
– |
148 |
– |
13,340 |
150,630 |
164,118 |
|
After 5 years |
– |
– |
– |
– |
259,057 |
5,276 |
264,333 |
|
Balance at 31 March 2023 |
647 |
1,449 |
283 |
1,444 |
277,628 |
183,443 |
464,894 |
|
Consolidated group |
|
2022/23 |
2022/23 |
2021/22 |
2021/22 |
|
Restructuring |
|
14,922 |
358 |
14,040 |
984 |
|
Redundancy |
|
2,770 |
1,786 |
5,980 |
– |
|
Legal claims |
|
10,123 |
888 |
8,651 |
1,065 |
|
Continuing care |
|
69,807 |
21,845 |
86,532 |
31,646 |
|
Clinician tax charge |
|
5,231 |
272,397 |
2,955 |
286,607 |
|
Other |
|
87,361 |
179,928 |
132,768 |
93,241 |
|
Total |
|
190,214 |
477,202 |
250,926 |
413,543 |
|
Total current and non-current |
|
667,416 |
|
664,469 |
|
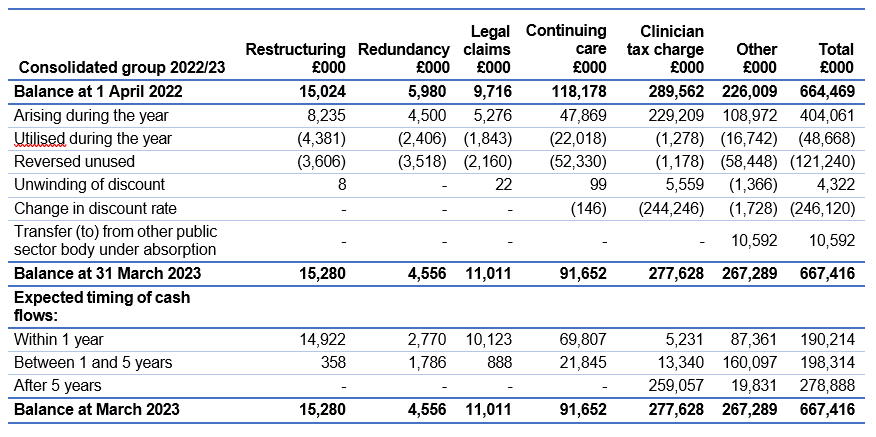
|
Consolidated group 2022/23 |
Restructuring |
Redundancy |
Legal claims |
Continuing care |
Clinician tax charge |
Other |
Total |
|
Balance at 1 April 2022 |
15,024 |
5,980 |
9,716 |
118,178 |
289,562 |
226,009 |
664,469 |
|
Arising during the year |
8,235 |
4,500 |
5,276 |
47,869 |
229,209 |
108,972 |
404,061 |
|
Utilised during the year |
(4,381) |
(2,406) |
(1,843) |
(22,018) |
(1,278) |
(16,742) |
(48,668) |
|
Reversed unused |
(3,606) |
(3,518) |
(2,160) |
(52,330) |
(1,178) |
(58,448) |
(121,240) |
|
Unwinding of discount |
8 |
– |
22 |
99 |
5,559 |
(1,366) |
4,322 |
|
Change in discount rate |
– |
– |
– |
(146) |
(244,246) |
(1,728) |
(246,120) |
|
Transfer (to) from other public sector body under absorption |
– |
– |
– |
– |
– |
10,592 |
10,592 |
|
Balance at 31 March 2023 |
15,280 |
4,556 |
11,011 |
91,652 |
277,628 |
267,289 |
667,416 |
|
Expected timing of cash flows: |
|
|
|
|
|
|
|
|
Within 1 year |
14,922 |
2,770 |
10,123 |
69,807 |
5,231 |
87,361 |
190,214 |
|
Between 1 and 5 years |
358 |
1,786 |
888 |
21,845 |
13,340 |
160,097 |
198,314 |
|
After 5 years |
– |
– |
– |
– |
259,057 |
19,831 |
278,888 |
|
Balance at March 2023 |
15,280 |
4,556 |
11,011 |
91,652 |
277,628 |
267,289 |
667,416 |
NHS Continuing Healthcare is a package of health and social care arranged and funded solely by the NHS for a person aged 18 or over to meet physical or mental health needs which have arisen as a result of disability, accident, or illness. Where an individual has both health and social care needs, but they have been assessed as having a ‘primary health need’ under the National Framework for NHS Continuing Healthcare and NHS-funded Nursing Care, the NHS has responsibility for providing for all of that individual’s assessed needs, both the health and social care. The amount included in the table above as ‘Continuing Care’ represents the best estimate, at the year-end date, of the liabilities of NHS England group relating to the obligation of the NHS to pay for cases of such care and hence its responsibility for reimbursing patients and their families for costs incurred.
The clinician tax charge is the pensions reimbursement provision in the parent of £278 million for the commitment to pay clinicians in the NHS Pension Scheme for the effect of the 2019/20 Scheme Pays deduction on their income from the NHS Pension Scheme in retirement, in line with the ministerial direction to DHSC and NHS England.
Other provisions in both the parent and the group are primarily provisions for pension disputes and dilapidations.
The NHS Resolution financial statements disclose a provision of £70,041,046 as of 31 March 2023 in respect of clinical negligence liabilities and employment liability scheme of NHS England (31 March 2022: £74,786,491).
15. Contingencies
|
Contingent liabilities |
|
Parent |
|
Consolidated group | ||
|
|
2022/23 |
2021/22 |
|
2022/23 |
2021/22 | |
|
Employment tribunal |
|
975 |
338 |
|
975 |
438 |
|
NHS Resolution employee liability claim |
|
18 |
9 |
|
100 |
10 |
|
Continuing healthcare |
|
– |
– |
|
14,066 |
12,955 |
|
Legal claims |
|
2,907 |
2,278 |
|
3,107 |
2,589 |
|
Legacy Pension issues |
|
250 |
250 |
|
250 |
250 |
|
Her Majesty’s Revenue and Customs |
|
– |
– |
|
21,000 |
– |
|
Liverpool Community Health Trust (re Maternity and neonatal care investigation) |
|
500 |
– |
|
500 |
– |
|
Christies Foundation Trust (re Maternity and neonatal care investigation) |
|
300 |
– |
|
300 |
– |
|
Sandwell Children’s Trust Complex Placements |
|
– |
– |
|
– |
1,592 |
|
GP Non Reimbursable property costs |
|
– |
– |
|
1,907 |
2,990 |
|
Other |
|
– |
1,673 |
|
35 |
1,673 |
|
Total contingent liabilities |
|
4,950 |
4,548 |
|
42,240 |
22,497 |
|
Contingent assets |
|
Parent |
|
Consolidated group | ||
|
|
2022/23 |
2021/22 |
|
2022/23 |
2021/22 | |
|
Legal cases |
|
1,707 |
2,522 |
|
1,707 |
2,522 |
|
Employee pension issues |
|
162 |
– |
|
162 |
– |
|
Rates Rebates |
|
– |
– |
|
– |
251 |
|
Total contingent assets |
|
1,869 |
2,522 |
|
1,869 |
2,773 |
Contingent liabilities are those for which provisions have not been recorded as there is a possible obligation depending on uncertain future events, or a present obligation where payment is not probable, or the amount cannot be measured reliably.
Contingent assets are those where a possible asset arises from a past event and whose existence will be confirmed only by the occurrence or non-occurrence of an uncertain future event not wholly within the control of the entity. These are disclosed only when the inflow of economic benefit is probable.
16. Commitments
16.1 Capital commitments
|
|
|
Parent |
|
Consolidated group | ||
|
|
2022/23 |
2021/22 |
|
2022/23 |
2021/22 | |
|
Property, plant and equipment |
|
8,379 |
32,734 |
|
13,114 |
37,626 |
|
Total |
|
8,379 |
32,734 |
|
13,114 |
37,626 |
16.2 Other financial commitments
NHS England has entered into non-cancellable contracts (which are not leases, private finance initiative contracts or other service concession arrangements) which expire as follows:
|
|
|
Parent |
|
Consolidated group | ||
|
|
2022/23 |
2021/22 |
|
2022/23 |
2021/22 | |
|
In not more than 1 year |
|
580,377 |
517,836 |
|
863,719 |
777,875 |
|
In more than 1 year but not more than 5 years |
|
509,223 |
505,649 |
|
549,901 |
590,205 |
|
In more than 5 years |
|
25,436 |
– |
|
63,171 |
44,716 |
|
Total |
|
1,115,036 |
1,023,485 |
|
1,476,791 |
1,412,796 |
In the parent account the most significant contracts relate to:
- Delivery of administration services for Primary Care contract with Capita Business Services Ltd
- PET Scanner contract with Alliance Medical
- Health & Justice contract with Spectrum
- Integrated Single Financial Environment contract with NHS SBS
Excluding the largest parent financial commitments already disclosed, the most significant other group commitments relate to:
- a contract between NHS Banes, Swindon & Wiltshire CCG and Wiltshire Health & Care Ltd in relation to the Adult Community Services
17. Financial instruments
17.1 Financial risk management
Financial reporting standard IFRS 7 requires disclosure of the role that financial instruments have had during the period in creating or changing the risks a body faces in undertaking its activities.
Because NHS England is financed through parliamentary funding, it is not exposed to the degree of financial risk faced by business entities. Also, financial instruments play a much more limited role in creating or changing risk than would be typical of listed companies, to which the financial reporting standards mainly apply. NHS England has limited powers to borrow or invest surplus funds and financial assets and liabilities are generated by day-to-day operational activities rather than being held to change the risks facing the CCG in undertaking its activities.
Treasury management operations are carried out by the finance department, within parameters defined formally within the NHS England standing financial instructions and policies agreed by the CCG governing bodies. Treasury activity is subject to review by the NHS England internal auditors.
17.1.1 Currency risk
NHS England is principally a domestic organisation with the great majority of transactions, assets and liabilities being in the UK and sterling based.
NHS England has no overseas operations. NHS England therefore has low exposure to currency rate fluctuations.
17.1.2 Interest rate risk
NHS England does not have any borrowings that are subject to interest rate risk.
17.1.3 Credit risk
Because the majority of NHS England revenue comes from parliamentary funding, NHS England has low exposure to credit risk. The maximum exposure as at the end of the financial year is in receivables from customers, as disclosed in the trade and other receivables note.
17.1.4 Liquidity risk
NHS England is required to operate within revenue and capital resource limits, which are financed from resources voted annually by Parliament.
NHS England draws down cash to cover expenditure, as the need arises. NHS England is not, therefore, exposed to significant liquidity risks.
17.1.5 Financial instruments
As the cash requirements of NHS England are met through the Estimate process, financial instruments play a more limited role in creating and managing risk than would apply to a non-public sector body. The majority of financial instruments relate to contracts to buy non-financial items in line with NHS England’s expected purchase and usage requirements and NHS England is therefore exposed to little credit, liquidity or market risk.
18. Operating segments
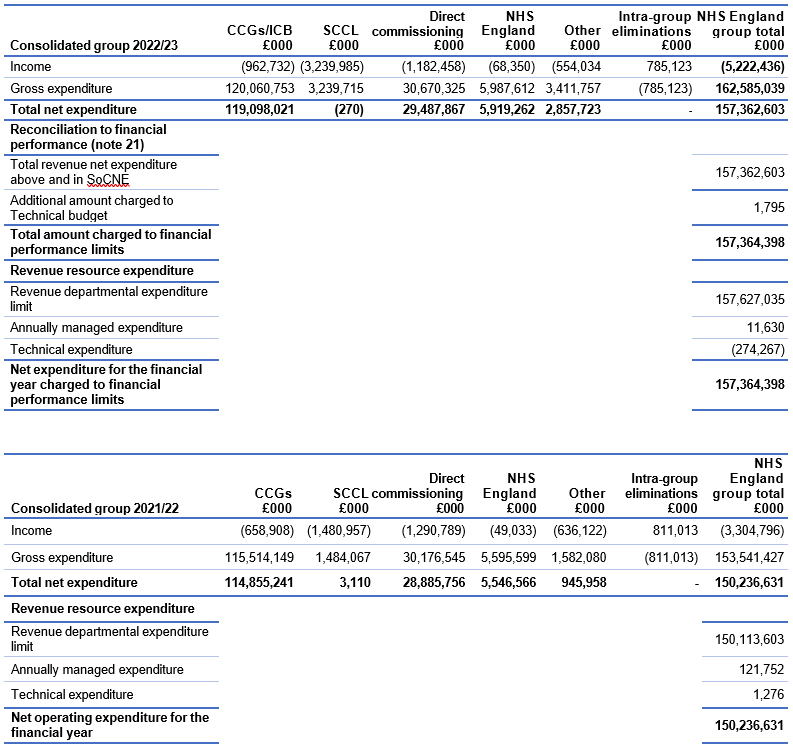
|
Consolidated group 2022/23 |
CCGs/ICB |
SCCL |
Direct commissioning |
NHS England |
Other |
Intra-group eliminations £000 |
NHS England group total |
|
Income |
(962,732) |
(3,239,985) |
(1,182,458) |
(68,350) |
(554,034 |
785,123 |
(5,222,436) |
|
Gross expenditure |
120,060,753 |
3,239,715 |
30,670,325 |
5,987,612 |
3,411,757 |
(785,123) |
162,585,039 |
|
Total net expenditure |
119,098,021 |
(270) |
29,487,867 |
5,919,262 |
2,857,723 |
– |
157,362,603 |
|
Reconciliation to financial performance (note 21) |
|
|
|
|
|
|
|
|
Total revenue net expenditure above and in SoCNE |
|
|
|
|
|
|
157,362,603 |
|
Additional amount charged to Technical budget |
|
|
|
|
|
|
1,795 |
|
Total amount charged to financial performance limits |
|
|
|
|
|
|
157,364,398 |
|
Revenue resource expenditure |
|
|
|
|
|
|
|
|
Revenue departmental expenditure limit |
|
|
|
|
|
|
157,627,035 |
|
Annually managed expenditure |
|
|
|
|
|
|
11,630 |
|
Technical expenditure |
|
|
|
|
|
|
(274,267) |
|
Net expenditure for the financial year charged to financial performance limits |
|
|
|
|
|
|
157,364,398 |
|
Consolidated group 2021/22 |
CCGs |
SCCL |
Direct commissioning |
NHS England |
Other |
Intra-group eliminations |
NHS England group total |
|
Income |
(658,908) |
(1,480,957) |
(1,290,789) |
(49,033) |
(636,122) |
811,013 |
(3,304,796) |
|
Gross expenditure |
115,514,149 |
1,484,067 |
30,176,545 |
5,595,599 |
1,582,080 |
(811,013) |
153,541,427 |
|
Total net expenditure |
114,855,241 |
3,110 |
28,885,756 |
5,546,566 |
945,958 |
– |
150,236,631 |
|
Revenue resource expenditure | |||||||
|
Revenue departmental expenditure limit |
150,113,603 | ||||||
|
Annually managed expenditure |
121,752 | ||||||
|
Technical expenditure |
1,276 | ||||||
|
Net operating expenditure for the financial year |
|
|
|
|
|
|
150,236,631 |
The reportable segments disclosed within this note reflect the current structure of NHS England with the activities of each reportable segment reflecting the remit of the organisation. These operating segments are regularly reported to the NHS England Board of Directors for financial management and decision-making purposes.
The activities of each segment are defined as follows:
- CCGs – clinically led groups that are responsible for commissioning healthcare services as defined in the Health and Social Care Act 2012
- ICBs – bodies that are responsible for planning most NHS services in their area including commissioning healthcare services, as defined in the Health and Care Act 2022
- SCCL – the management function for the NHS Supply Chain operating model
- Direct Commissioning – the services commissioned by NHS England as defined in the Health and Social Care Act 2012
- NHS England – the central administration of the organisation and centrally managed programmes
- Other – includes commissioning support units, national reserves, technical accounting items and legacy balances
Multiple transactions take place between reportable segments, all of which are eliminated upon consolidation as shown in the “”Intra-group eliminations”” column. Information on total assets and liabilities and net assets and liabilities is not separately reported to the Chief Operating Decision Maker and thus, in accordance with IFRS 8, does not form part of this disclosure.
19. Related party transactions
Related party transactions associated with the Parent are disclosed within this note. As disclosed in note 1.3 NHS England acts as the parent to 106 CCGs for 3 months (April 2022 to June 2022); plus 42 ICBs for 9 months (July 2022 to March 2023) and SCCL whose accounts are consolidated within these financial statements. These bodies are regarded as related parties with which the Parent has had various material transactions during the year; those transactions are disclosed in those entities’ financial statements.
The Department of Health and Social Care, as the parent of NHS England, is regarded as a related party. During the year, NHS England has had a significant number of material transactions with entities for which the Department is regarded as the parent Department.
For example:
- NHS foundation trusts
- NHS trusts
- NHS Litigation Authority
- NHS Business Services Authority
- NHS Property Services
- Health Education England
- NHS Shared Business Services (DH Equity Investment)
In addition, NHS England has had a number of significant transactions with other government departments and their agencies including HMRC, Ministry of Justice and His Majesty’s Prison and Probation Service. No related party transactions were noted with key management personnel other than the compensation paid to them which can be found in the remuneration report from page 109.
20. Events after the end of the reporting period
There are no adjusting events after the reporting period which will have a material effect on the financial statements of NHS England.
From 1 April 2023 Health Education England demised. The operational activities, assets and liabilities of Health Education England were transferred in full to NHS England. This transfer will be reflected as an absorption transfer in the NHS England parent account from that date.
The Accounts were authorised for issue by the Accounting Officer on the date of the Audit Certificate of the Comptroller & Auditor General.
21. Financial performance targets
The Mandate: A mandate from the government to NHS England: April 2022 to March 2023 published by the Secretary of State under section 13A of the National Health Service Act 2006, and the associated financial directions as issued by the Department of Health and Social Care, set out NHS England’s total revenue resource limit and total capital resource limit for 2022/23 and certain additional expenditure controls to which NHS England must adhere. These stem from budgetary controls that HM Treasury applies to the Department of Health and Social Care.
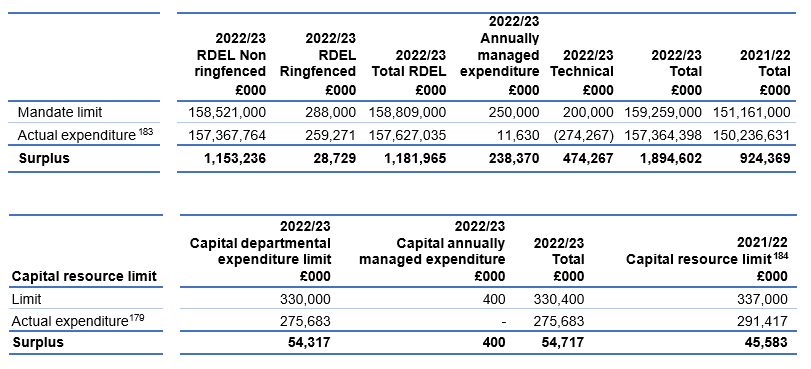
|
|
2022/23 |
2022/23 |
2022/23 |
2022/23 |
2022/23 |
2022/23 |
2021/22 | |
|
Mandate limit |
|
158,521,000 |
288,000 |
158,809,000 |
250,000 |
200,000 |
159,259,000 |
151,161,000 |
|
Actual expenditure182F[11] |
|
157,367,764 |
259,271 |
157,627,035 |
11,630 |
(274,267) |
157,364,398 |
150,236,631 |
|
Surplus |
|
1,153,236 |
28,729 |
1,181,965 |
238,370 |
474,267 |
1,894,602 |
924,369 |
|
Capital resource limit |
|
2022/23 |
2022/23 |
2022/23 |
2021/22 |
|
Limit |
|
330,000 |
400 |
330,400 |
337,000 |
|
Actual expenditure179 |
|
275,683 |
– |
275,683 |
291,417 |
|
Surplus |
|
54,317 |
400 |
54,717 |
45,583 |
NHS England is required to spend no more than £2,011,000k of its Revenue Departmental Expenditure Limit mandate on matters relating to administration. The actual amount spent on RDEL administration matters to 31st March 2023 was £1,831,625k as set out below:
|
Administration limit: |
|
2022/23 |
|
2021/22 |
|
Net administration costs before interest |
|
1,841,028 |
|
1,597,217 |
|
Less: |
|
|
|
|
|
Administration expenditure covered by AME/Technical funding |
|
(9,403) |
|
(54,718) |
|
Administration costs relating to RDEL |
|
1,831,625 |
|
1,542,499 |
|
RDEL Administration expenditure limit |
|
2,011,000 |
|
1,785,000 |
|
Underspend |
|
179,375 |
|
242,501 |
The various limits of expenditure set out in the table above stem from the limits imposed by HM Treasury on the Department of Health and Social Care. Departmental Expenditure Limits are set in the Spending Review, and government departments may not exceed the limits they have been set. This control is passed down to NHS England by the Department of Health and Social Care and NHS England may not therefore exceed its Departmental Expenditure Limit.
Annually Managed Expenditure is subject to budgets set by HM Treasury. Departments must manage AME closely and inform HM Treasury if they expect AME to rise above forecast. Any increase requires HM Treasury approval.
22. Entities within the consolidated group
NHS England acts as the Parent of the group comprising 106 CCGs for 3 months (April 2022 to June 2022) plus 42 ICBs for 9 months (July 2022 to March 2023), compared to 106 CCGs in 2021/22 whose accounts are consolidated within these Financial Statements.
A full list of the CCGs and ICBs can be found on the NHS England website.
NHS England acts as the Parent of SCCL whose accounts are consolidated within these financial statements. Copies of their accounts can be found on their website https://www.supplychain.nhs.uk/sccl/
The parent entity of NHS England is the Department of Health and Social Care.
The largest group of entities for which group accounts are drawn up and of which NHS England is a member is the DHSC.
Copies of the accounts can be obtained from the government website184F[13].
[1] The change in revaluation of financial assets represents the change on equity instruments measured at fair value through OCI in respect of NHS England investment in SCCL.
[2] Other non-cash adjustments comprise of underlying adjustments in ICB books.
[3] In line with the adaptation in the HM Treasury Financial Reporting Manual prescription fees and charges and dental fees and charges are treated as revenue arising from a contract and accounted for under IFRS15.
[4] The receipts of donation(capital/cash) is in relation to donated imaging assets from Department of Health and Social Care
[5] Services from other WGA bodies comprises expenditure with the Department of Health and Social Care (DHSC), DHSC arm’s length bodies and NHS Blood and Transplant.
[6] Audit fees for the parent are NAO fees of £550k for the NHS England financial statements and £250k for the Consolidated NHS Provider Account.
[7] In both financial years NHS England purchased no non-statutory audit services from NAO. Details of CCGs and ICBs non-statutory audit expenditure can be found in the underlying individual CCGs and ICBs accounts.
[8] Funding to group bodies is shown above and represents cash funding drawn down by the CCGs and ICBs. These balances are eliminated on consolidation.
[9] The increase in NHS accruals is in relation to the pay award.
[10] Loans from the Department of Health and Social Care represent amounts issued to Supply Chain Coordination Limited to provide a working capital facility
[11] Amounts relating to dilapidation provisions on leases within the DHSC group (£1,795k) have been charged to the Technical budget rather than to capital annually managed expenditure as directed by DHSC. Total net expenditure excluding this amount is shown in note 18.
[12] The capital resource limit in 2021/22 is comparable to the 2022/23 capital departmental expenditure limit only. NHS England did not have a limit for capital annually managed expenditure in 2021/22.