
Background
Four trusts in the Kent and Medway Imaging Network have recently undertaken a project to address the constraints leading to poor flow in CT. Among the constraints identified was a lack of formal training for radiographers in service improvement, and an absence of real-time data needed to demonstrate service flow. A key requirement to the long-term success of the programme therefore was to build in-house improvement capability skills. This has been achieved through the development of an online foundation Health Care Operations Management Programme targeted at radiology service managers. The learning from this approach will enable others to improve their access to CT by following a structured methodology and creating in-house capability.
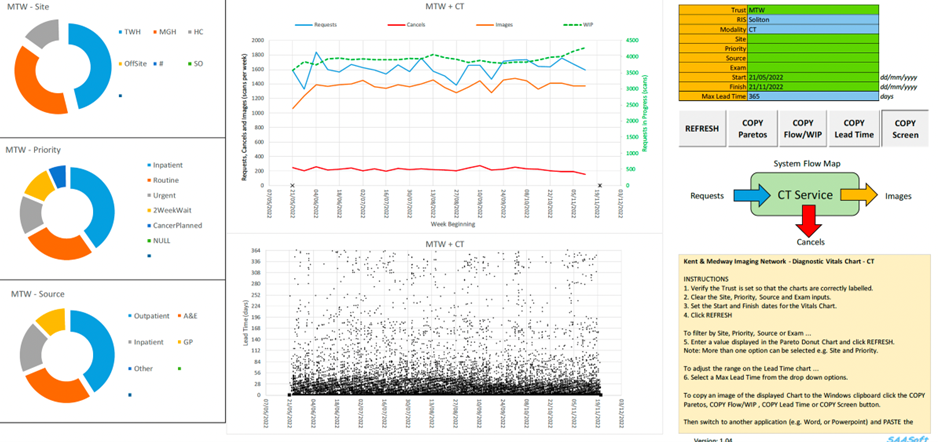
Figure 1: diagnostic vitals chart (DVC)
This is a dashboard updated and presented to the CT teams weekly so they can monitor service performance in near real-time over the previous 6 months.
Benefits seen at Kent and Medway
- each team developed a CT diagnostic vitals chart® (figure 1) which demonstrates the relationship between weekly referrals, activity, work in progress/backlog (WIP), cancellations and referral-to-scan lead times
- all teams worked to remove their policy constraints (time traps, batching and carve out) and, with no additional cost, this led to the reduction of WIP and reductions in lead times for routine scans down to 14 days and cancer lead times to less than 14 days
- 1 team eliminated their annual outsourcing costs (over £360k p.a.) and reduced their overtime costs for elective CT
- 3 teams review their DVCs every week, enabling them to react quickly to changes to proactively prevent issues
- in-house improvement capability has been developed for the long term, with 5 radiology staff being trained in the health care systems engineering improvement methodology
The steps to improve access to CT
1. Project setup
- pull together a multidisciplinary CT team including clinical and non-clinical staff
- produce a stakeholder map to identify who needs to be involved in the project
- arrange to meet weekly to map, measure and model the service before testing any changes
2. Map the CT Service
- map the processes in the current CT pathway from referral to scan including the patient and the information flows (see figure 2 below)
Figure 2: process map showing the stages and estimated timings for the day of the appointment
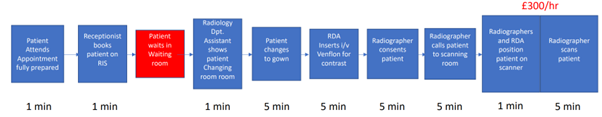
Example CT Pathway
- Patient attends appointment fully prepared (1 minute).
- Receptionist books patient on radiology information system (RIS) (1 minute).
- Patient waits in waiting room.
- Radiology department assistant (RDA) shows patient changing room (1 minute).
- Patient changes to gown (5 minutes).
- RDA inserts I/V Venflon for contrast (5 minutes).
- Radiographer consents patient (5 minutes).
- Radiographer calls patient to scanning room (5 minutes).
- Radiographers and RDA position patient on scanner (1 minute).
- Radiographer scans patient (5 minutes).
3. Measure the flow metrics
- request analytical support to capture weekly RIS validated data. This will enable a dynamic flow dashboard to be established (see figure 1 above)
- the project team can use the data to establish a baseline and to monitor the service data weekly. This will enable the team to understand if changes are leading to improvement
- measure the CT utilisation:
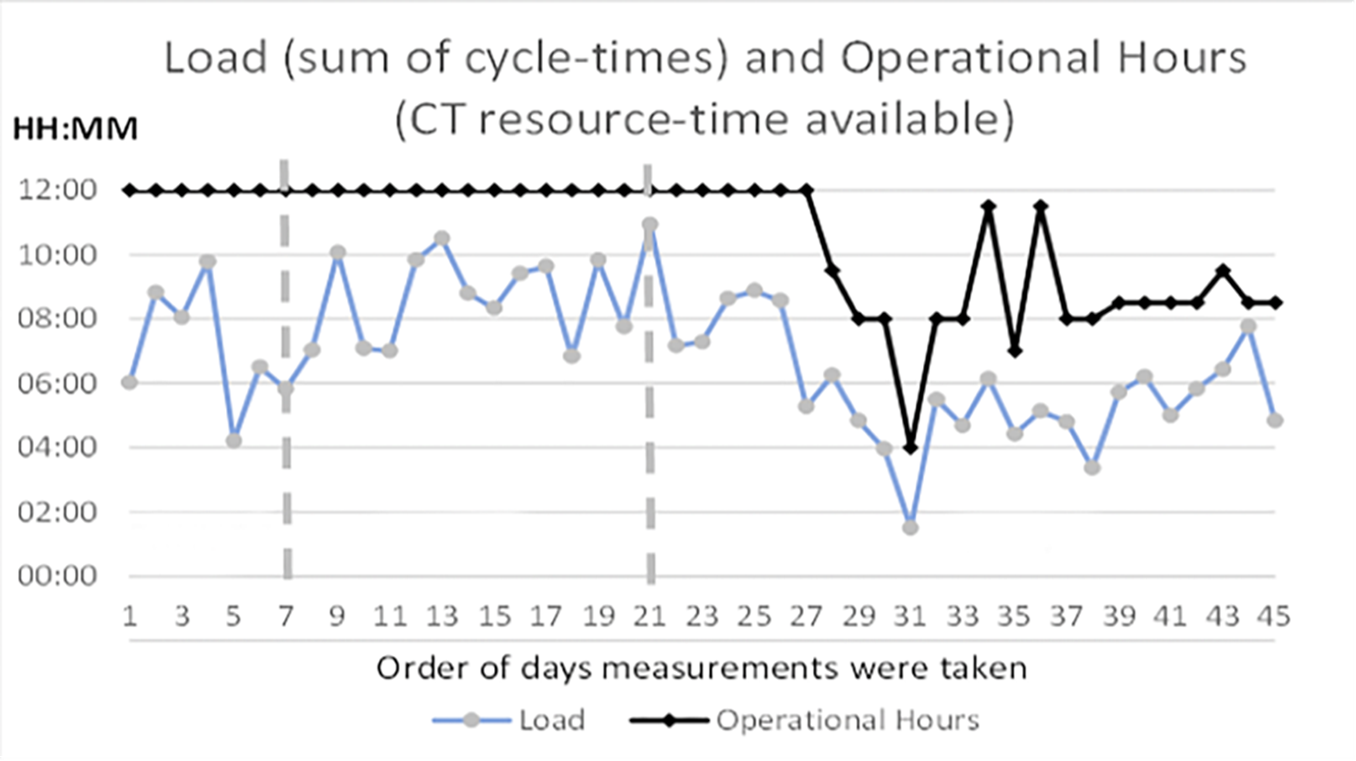
- measure the CT cycle time for every patient for a full week, from opening to closing. The sum of all the CT cycle times for each day is called the CT load
- CT utilisation is calculated by dividing the total CT load by the CT operating hours per day (see figure 3 below). This is presented as a percentage
- note: CT activity is not a measure of CT utilisation
Dashboard should include
- Weekly referrals, activity, and cancellations.
- Weekly work in progress (backlog) – examinations waiting to be performed.
- Lead times (request to scan) by date of scan.
Figure 3: utilisation chart comparing daily load (sum of cycle-times) to the operational hours (CT resource-time available)
4. Measure the cycle time
- CT activity is governed by the CT cycle time which is defined as “the time from when the patient enters the scanner, to when the staff and resources are ready to scan the next patient (including preparation and cleaning)”
5. Measure patient flow and wasted time
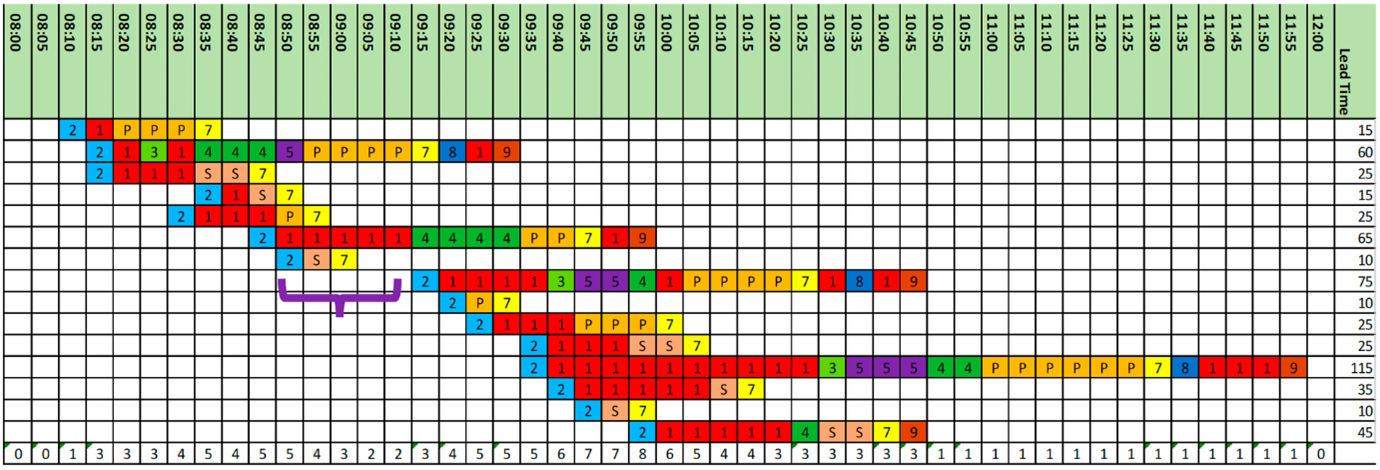
- use a Gantt chart to make the patient flow and wasted time visible
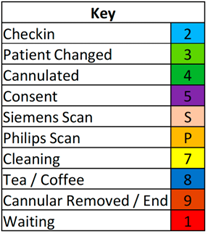
- The Gantt chart (see figure 4 below) measures every step in the process for all 15 patients scanned over a 4-hour period
- each process step is a different colour, with red squares showing the wasted time where patients are waiting
Figure 4: Gantt chart, and key, showing the breakdown of 15 patient’s cycle times, from arrival at reception to the actual scanning
6. Diagnose the flow constraint
- using the system flow map, process map, data dashboard, CT utilisation analysis and Gantt charts, identify the constraints to flow. The issues identified will be different for different sites and scanners. These could be:
- policy constraints – where certain tacit and explicit ‘rules’ for managing the demand, activity and booking unintentionally cause longer delays for patients
- resource-time constraints – where there is insufficient resource/staff time to meet the demand, in particular non-clinical workforce including:
- booking clerks
- porters
- RDAs
- diagnose the problem before testing any changes and use the data to show the impact of any changes before reflecting on how to embed the changes
- invest in a solution to remove any flow constraint identified. For example, Kent and Medway Imaging Network invested in more booking clerks, porters and RDAs
Overcoming challenges at Kent and Medway
Challenge: postal booking system
A postal based booking process cannot reliably deliver an agreed appointment with a patient. It results in 20 to 40% of appointments being cancelled and rebooked, hence wasted staff time and wasted CT scanner time.
Solution: recruit booking staff
Recruit sufficient band 3 booking staff to enable appointments to be booked and agreed over the phone, 7 days per week, 08:00 to 20:00.
Wage costs for busy band 3 staff are significantly less than the cost of an empty CT scanner (£300 per hour).
Challenge: lack of porters
A lack of porters causes delays in transporting patients to and from the CT scanner.
This leads to a backlog of inpatients who may block beds, and emergency department (ED) patients who block ED cubicles. Unwell inpatients wait in CT areas and require monitoring by radiology teams.
Solution: assign CT specific porters to CT flow
Recruit or assign CT specific porters to serve the emergency and inpatient CT flow.
Wage costs for porters are significantly less than the cost of an empty CT scanner and the cost of backlogged beds and ED cubicles.Challenge: lack of sufficient radiography department assistants
Lack of sufficient RDA leads to poor flow in CT.The rate limiting step in CT is getting the patients on and off the scanner.
Solution: employ 2 radiography department assistants
Employing 2 RDAs in CT can increase throughput significantly, allowing qualified radiology staff to focus on scanning patients.
Challenge: data errors
Constraints and errors in data extraction and validation can result in lack of visibility of planned follow-ups and incomplete demand and activity.
Solution: work with Radiology Information System and business intelligence colleagues
This is to ensure data is correctly captured, stored, extracted, and reported visually.
Figure 5: access to CT driver diagram
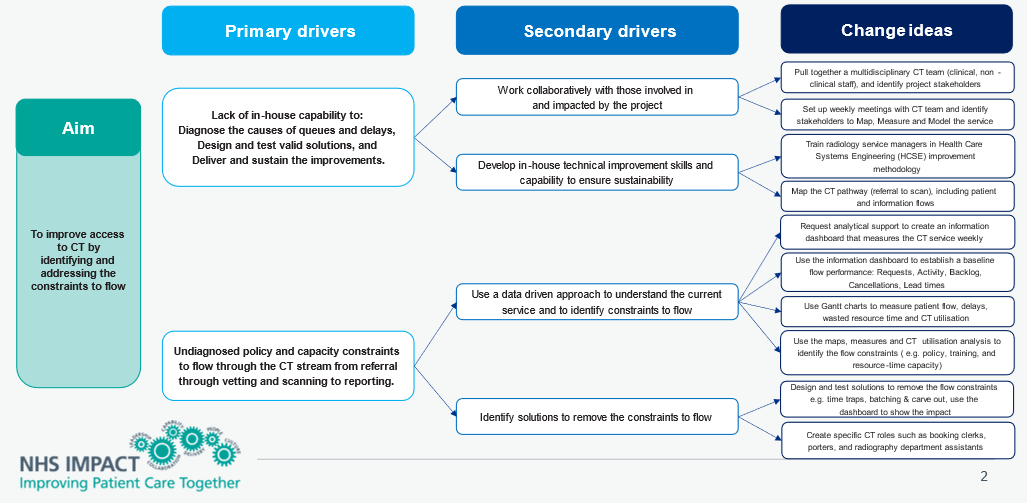
Figure 5: access to CT driver diagram – click to view accessible text version of this diagram.
Reading from left to right
Aim:
To improve access to CT by identifying and addressing the constraints to flow.
Primary drivers:
- lack of in-house capability to diagnose the causes of queues and delays, design and test valid solutions, and deliver and sustain the improvements
- undiagnosed policy and capacity constraints to flow through the CT stream from referral through vetting and scanning to reporting
Secondary drivers:
- work collaboratively with those involved in and impacted by the project
- develop in-house technical improvement skills and capability to ensure sustainability
- use a data driven approach to understand the current service and to identify constraints to flow
- identify solutions to remove the constraints to flow
Change ideas:
- pull together a multidisciplinary CT team (clinical, non-clinical staff), and identify project stakeholders
- set up weekly meetings with CT team and identify stakeholders to map, measure and model the service
- train radiology service managers in health care systems engineering improvement methodology
- map the CT pathway (referral to scan), including patient and information flows
- request analytical support to create an information dashboard that measures the CT service weekly
- use the information dashboard to establish a baseline flow performance: requests, activity, backlog, cancellations, lead times
- use Gantt charts to measure patient flow, delays, wasted resource time and CT utilisation
- use the maps, measures and CT utilisation analysis to identify the flow constraints (eg policy, training, and resource-time capacity)
- design and test solutions to remove the flow constraints, eg time traps, batching and carve out, use the dashboard to show the impact
- create specific CT roles such as booking clerks, porters, and radiography department assistants
Links and resources
- Full Kent and Medway CT case study: www.journalofimprovementscience.net
- Radiology GIRFT: www.gettingitrightfirsttime.co.uk
- Foundations of Health Care Operations Management: www.fhcom.uk
- How to create a Gantt Chart: www.ganttchart.uk
- To speak to someone about this project, project please contact richard.flood@nhs.net at Maidstone and Tunbridge Wells.
- Further resources on diagnostics can be found on the National Diagnostics Transformation FutureNHS page. An NHS email address will be required to access the page.