We want to hear from you. Help us understand your digital experience by taking part in our user research. Find out more now.

Executive summary
This paper provides further detail of performance and work that underpins the Chief Operating Officer (COO) delivery report for 24/25 across the programme areas.
Urgent and emergency care
Planning guidance 24/25 commitment: “improve ambulance response and A&E waiting times by supporting admissions avoidance and hospital discharge, and maintaining the increased acute bed and ambulance service capacity that systems and individual providers committed to put in place for the final quarter of 2023/24”
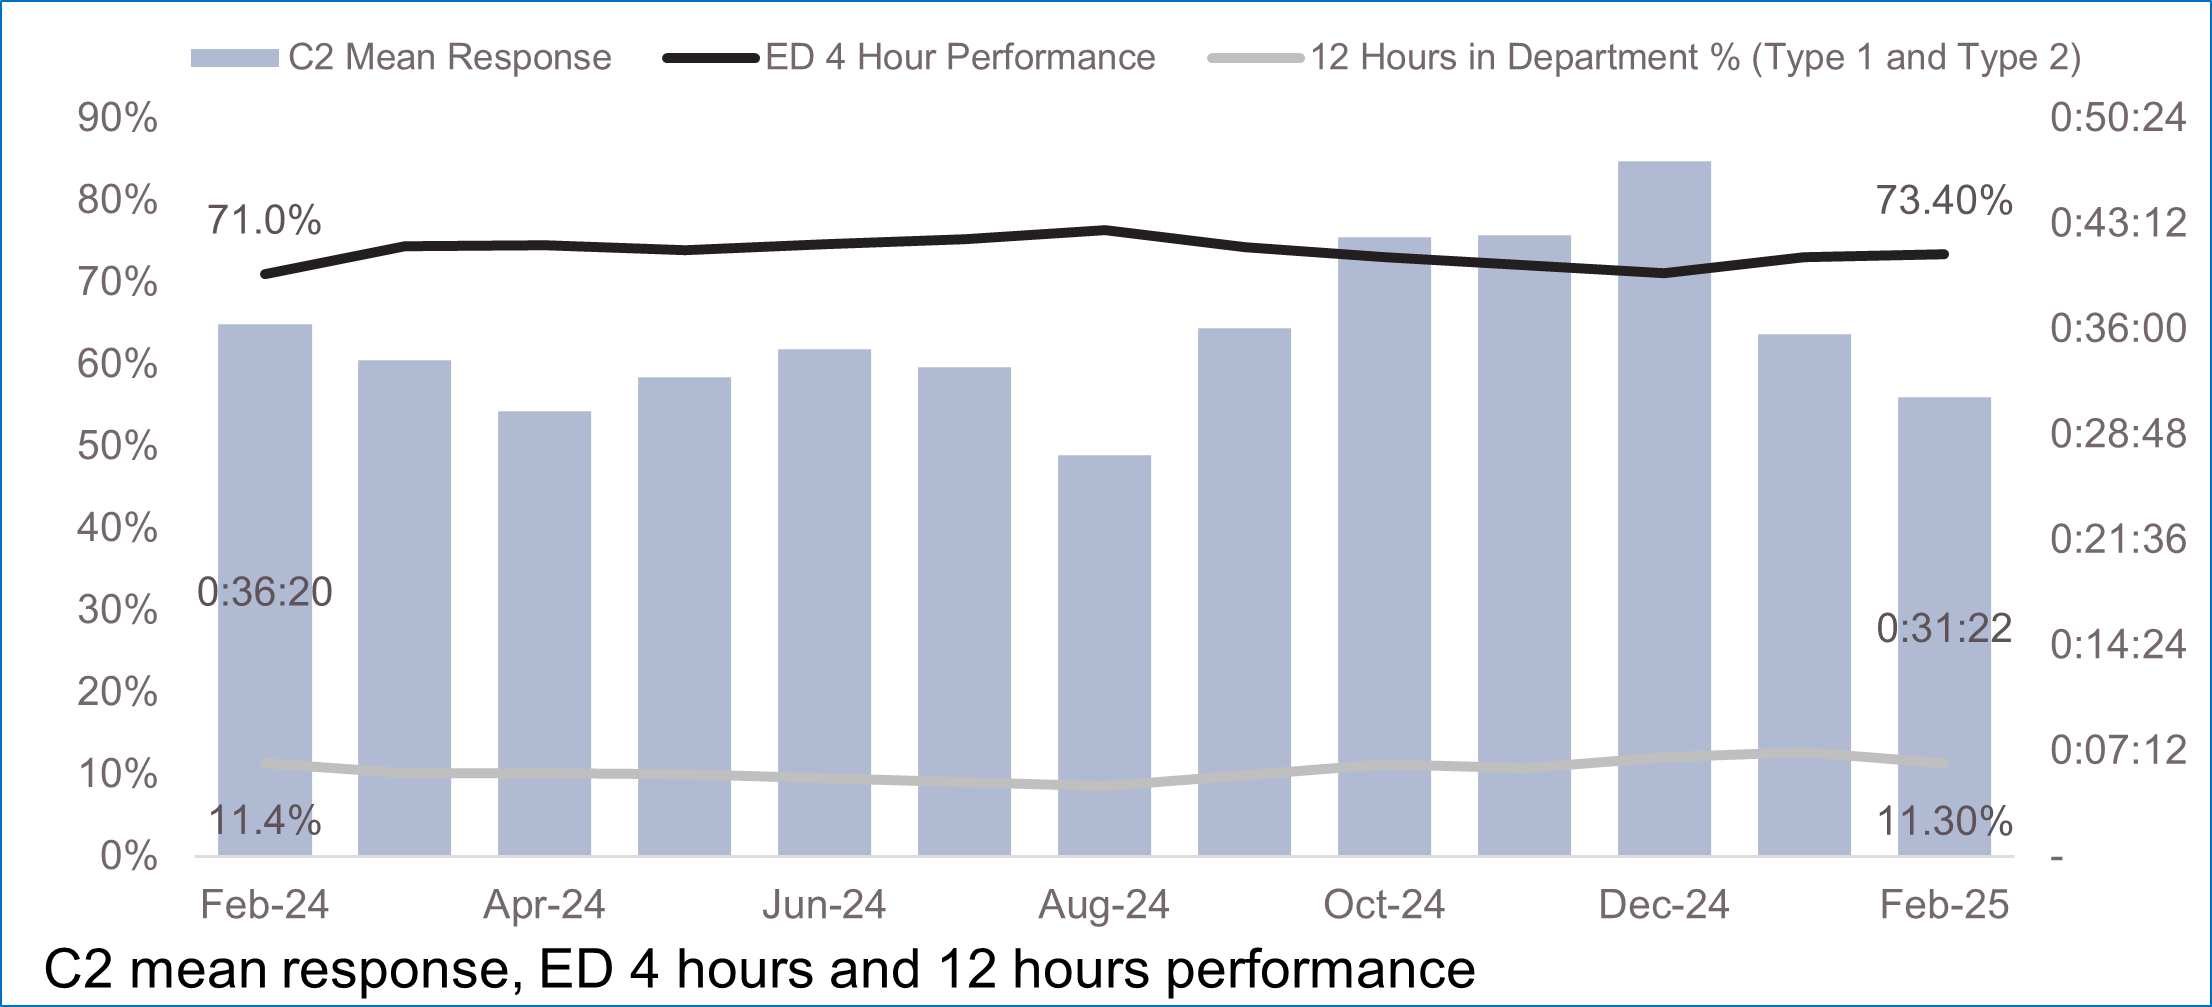
1. The current 4 hour performance in emergency department (ED) is 73.4% for February 2025, compared with 72.0% in January 2025 and 74.3% in March 2024. In February 2025 the 12 hour performance in ED was 11.3% compared with 12.7% in January 2025 and 10.1% in March 2024. Category 2 performance for February 2025 was 31:22, compared to the previous month that was 35:40 and March 2024 was 33:51. The planning guidance targets were for 78% 4 hour performance and 30 mins YTD category 2 performance. The current data shows that YTD category 2 performance is 35:36 and MI data shows that 4 hour performance is 73.6% (19 March 2025), both of which indicate that the 2024/25 planning guidance targets will not be met, however we predict that performance will be improved when comparing 2024/25 against 2023/24.
Figure 1: Category 2 mean response, emergency department 4 hours and 12 hours performance
Electives, cancer, and diagnostics
Planning guidance 24/25 commitment: “reduce elective long waits”
2. The total waiting list was 7.43 in January 2025, compared with 7.46 million in December 2024 and 7.5 in March 2024.
|
Metric |
January 2025 position |
Previous month’s position |
Previous year’s position (January 2024) |
|
RTT: total waiting list |
7,428,309 |
7,463,403 |
7,575,914 |
|
RTT: patients seen within 18 weeks |
4,372,493 |
4,399,220 |
4,321,271 |
|
RTT: patients waiting longer than 52 weeks |
198,868 |
200,375 |
321,394 |
Figure 2: Timeseries of total RTT waiting list and number of pathways in which the patient was waiting up to 18 weeks to start treatment to January 2025
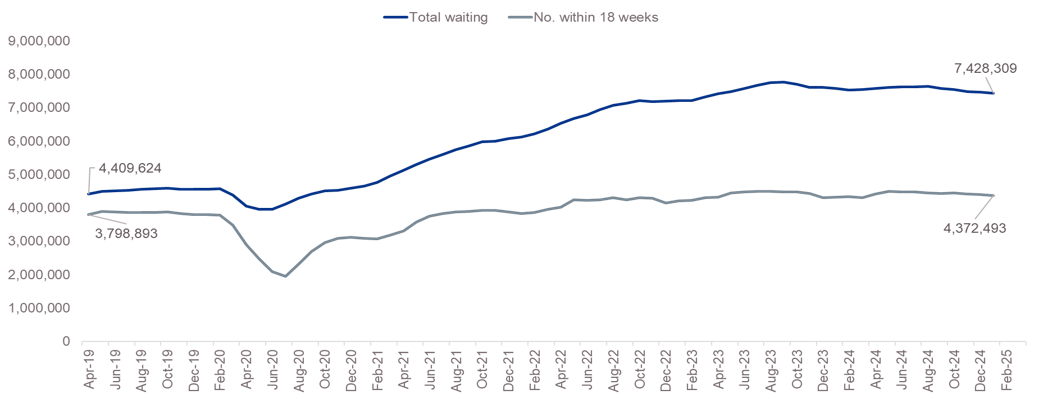
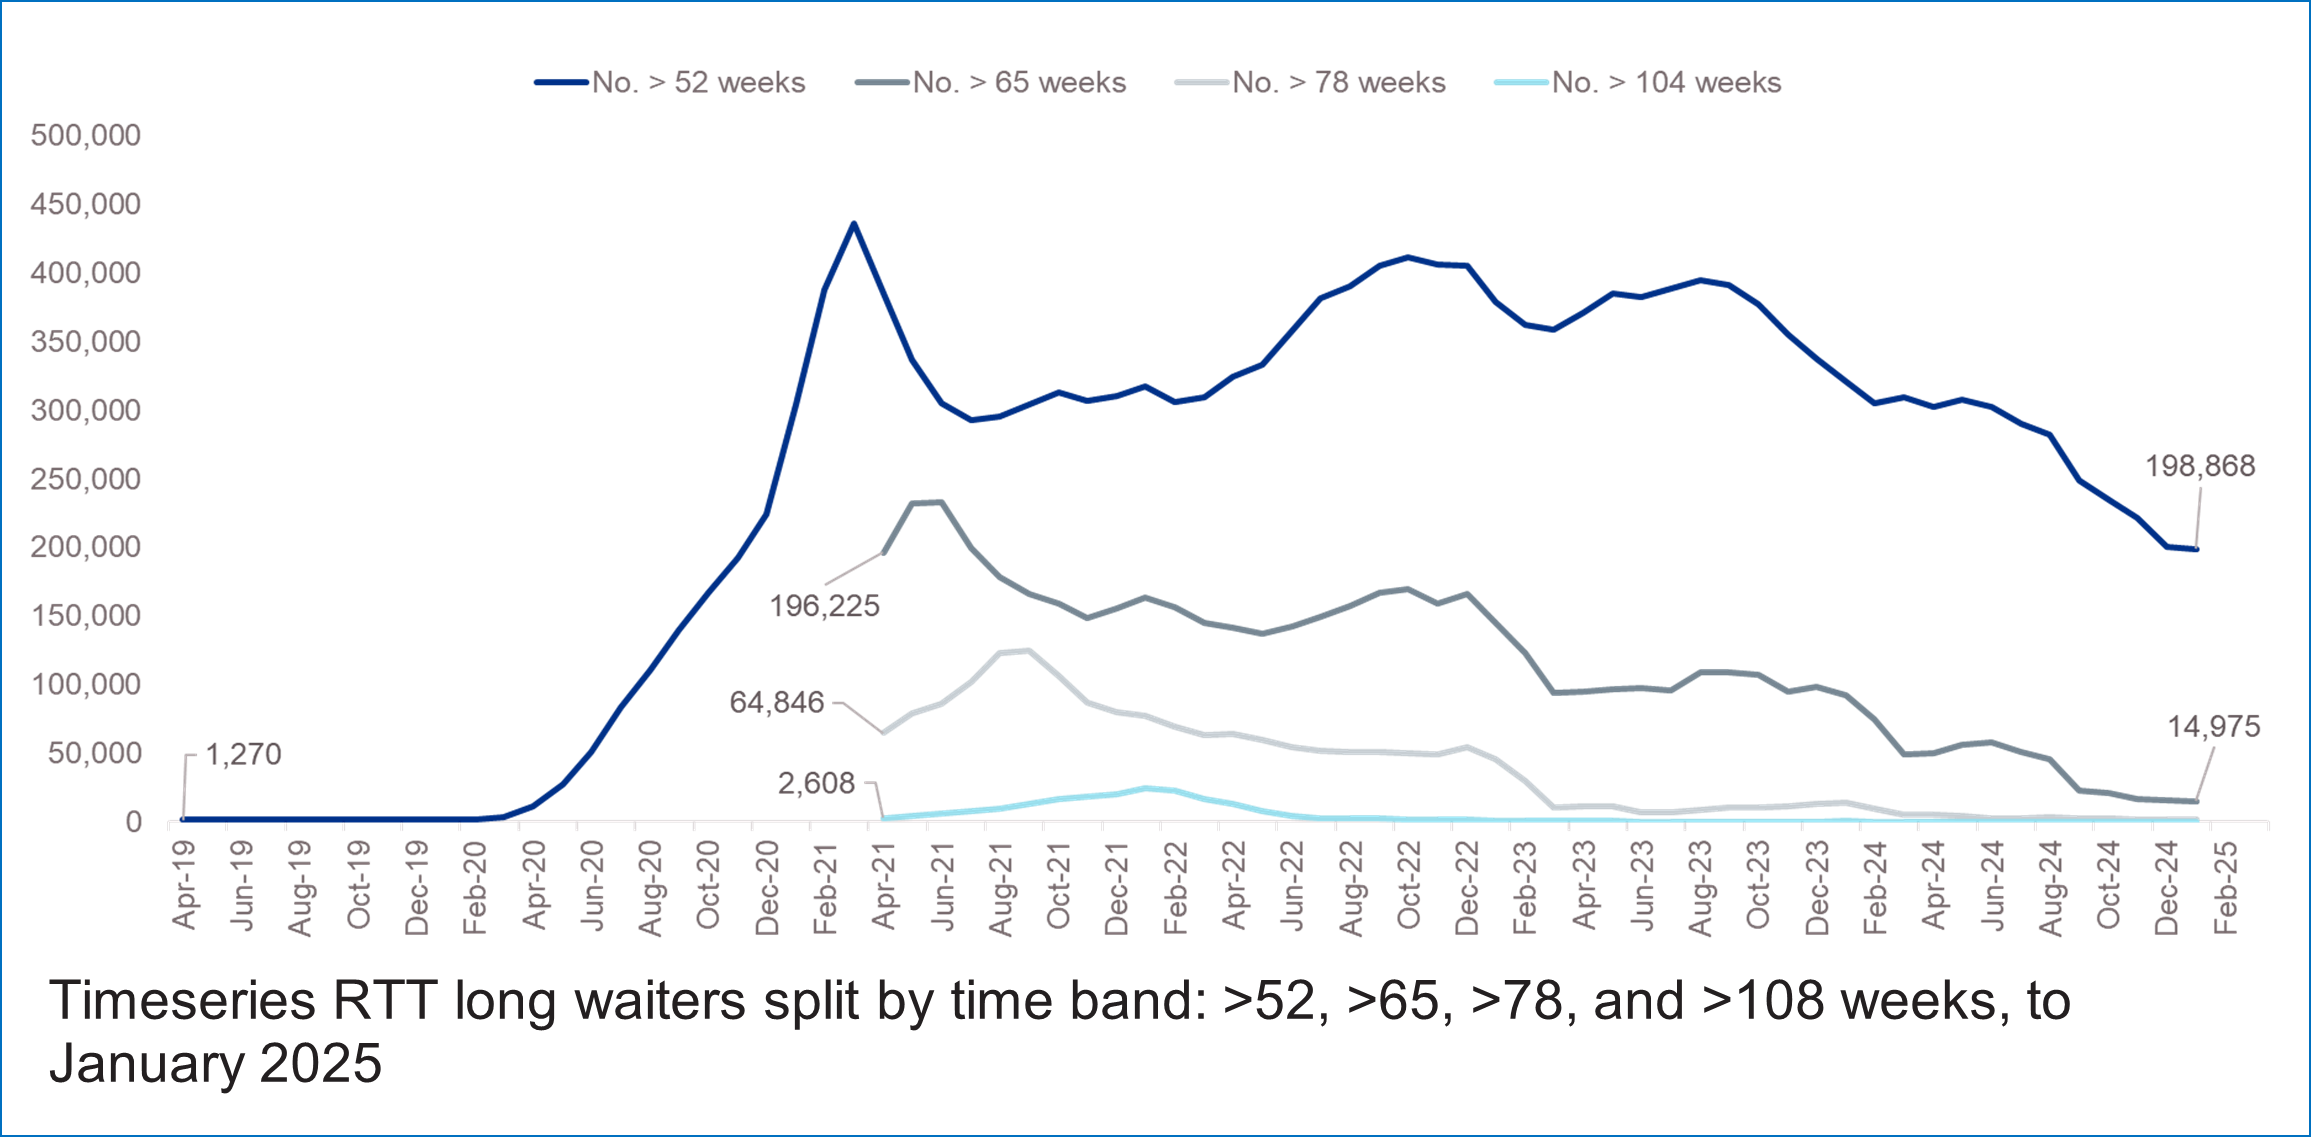
Figure 3 – Timeseries RTT long waiters split by time band: >52, >65, >78, and >108 weeks, to January 2025
 52, >65, >78, and >108 weeks, to January 2025″ width=”800″ height=”394″>
Cancer
Planning guidance 24/25 commitment: “improve performance against the 62-day standard to 70% and 28-day and improve the Faster Diagnosis Standard to 77% by March 2025”
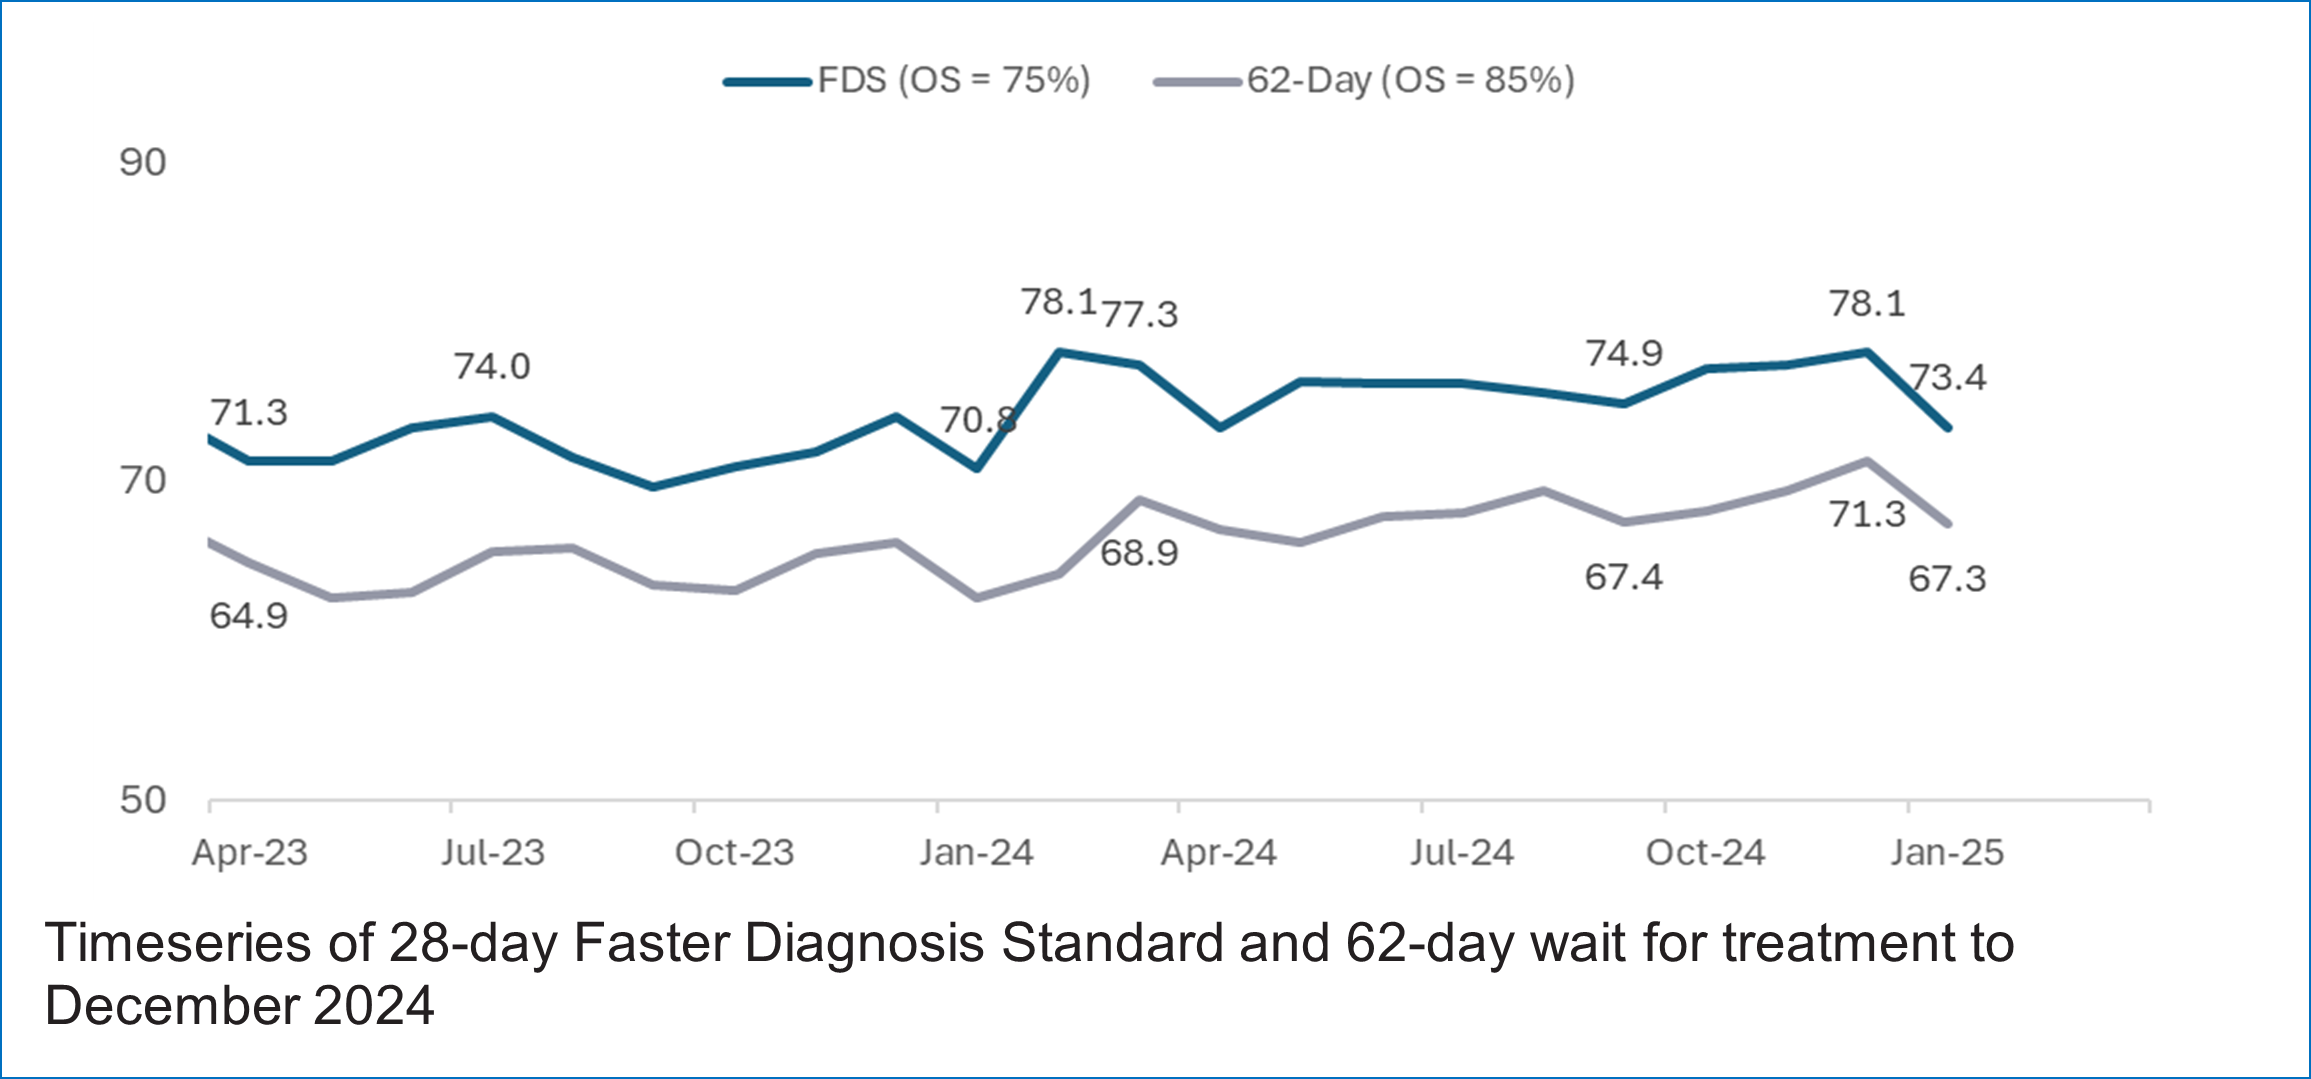
3. The Faster Diagnosis Standard (FDS) was 73.4% in January 2025, compared with 78.1% the previous month and 77.3% in March 2024. The 6-day wait for treatment was 67.3% in January, compared with 71.3% the previous month and 68.9% in March 2024. Both standard show an improvement compared to the previous year, and we are confident of meeting the planning guidance commitments this year.
Figure 4: Timeseries of 28-day Faster Diagnosis Standard and 62-day wait for treatment to December 2024
Diagnostics
Planning guidance 24/25 commitment: “increase the percentage of patients that receive a diagnostic test within 6 weeks in line with the March 2025 ambition of 95%”
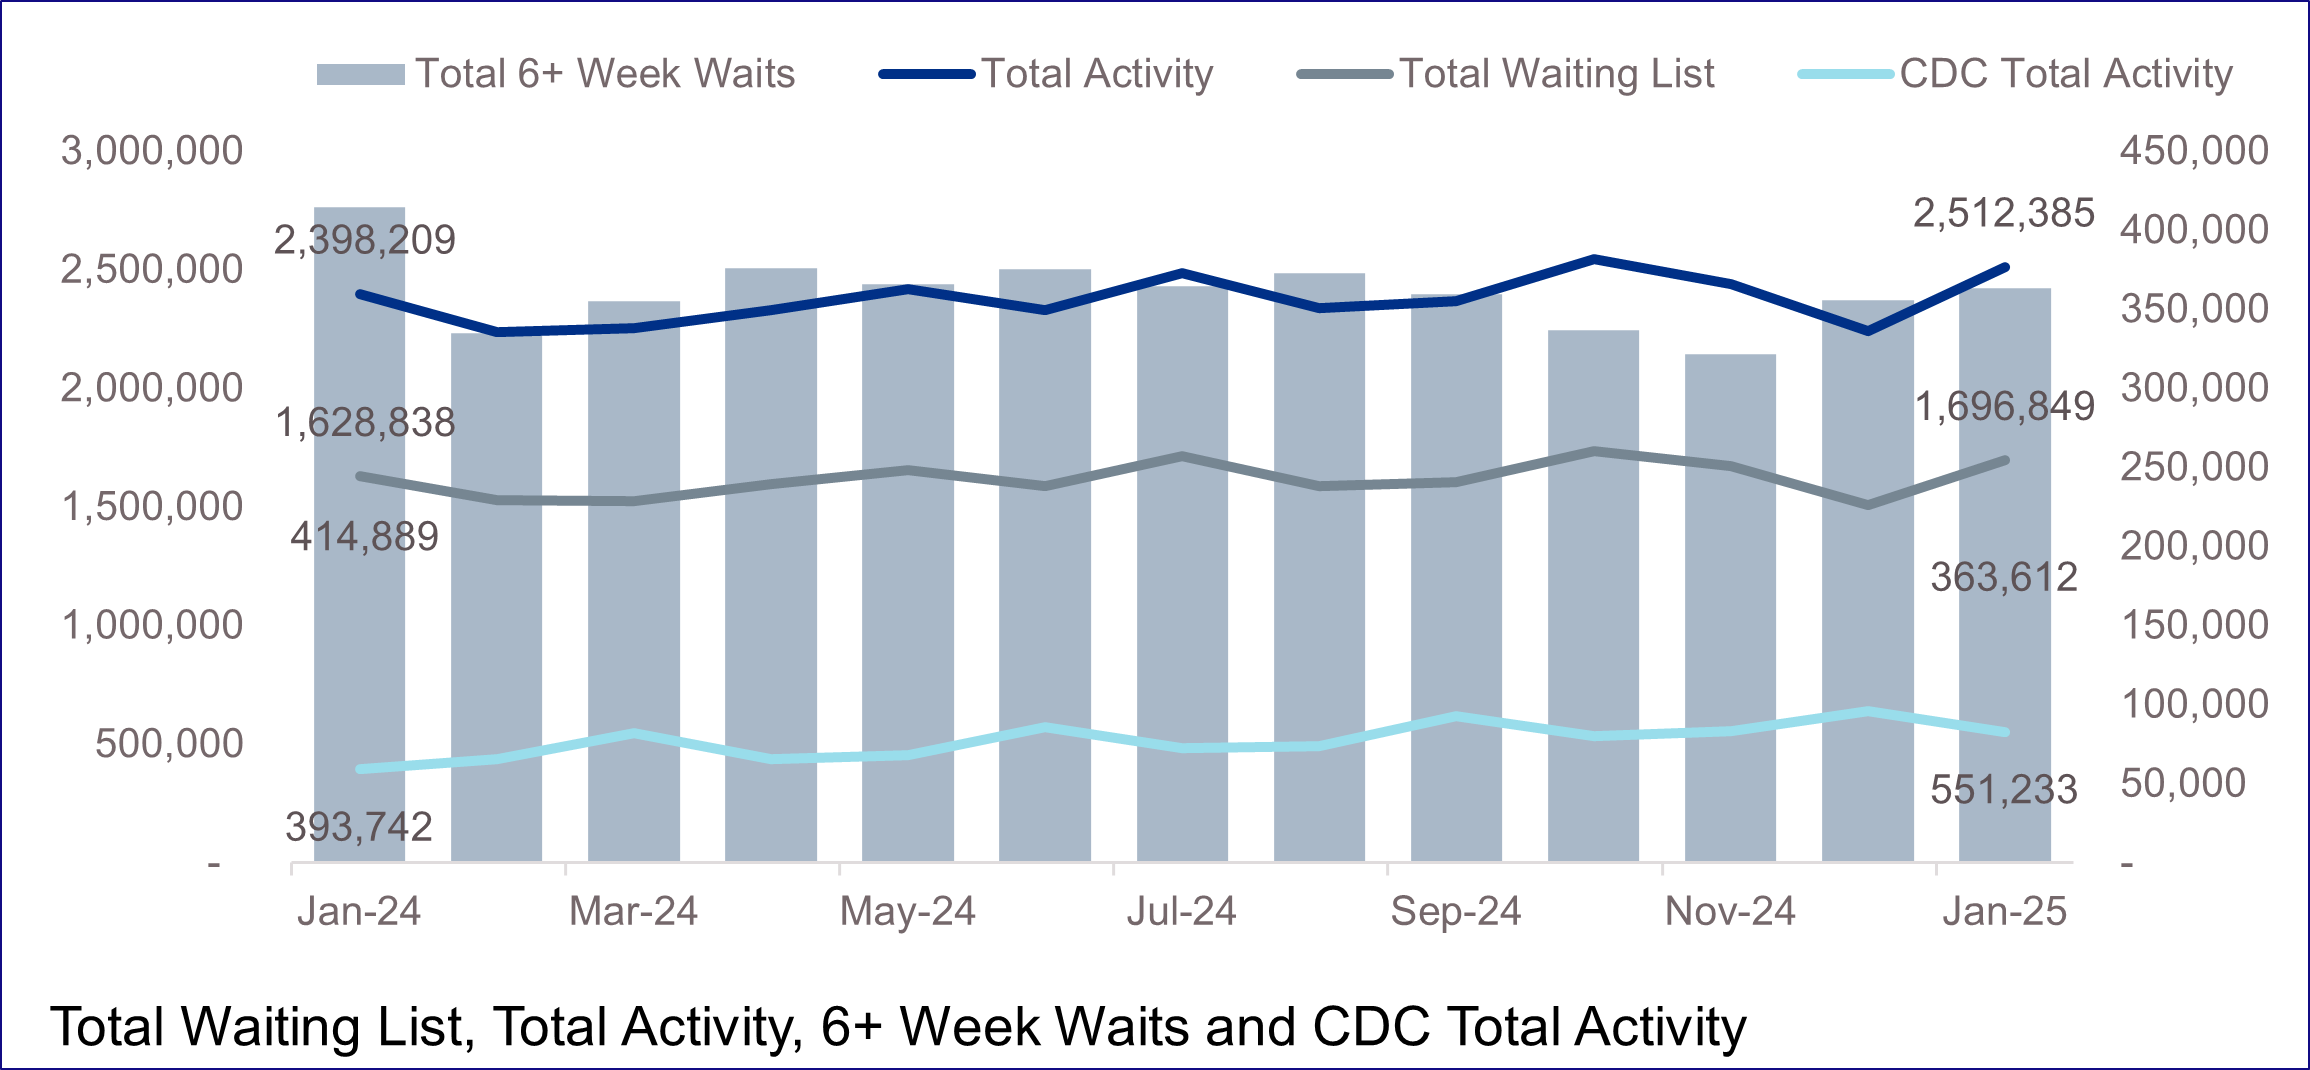
4. The total diagnostic activity was 2.51 million in January 2025, compared with 2.24 million the previous month and 2.25 million in March 2024. The total waiting list size was 1.70 million in January 2024 compared with 1.51 million the previous month and 1.62 million in March 2024. We are expecting to fall short of the 95% ambition by delivering 80% for 24/25, however this is an improvement on 74.7% for 23/24.
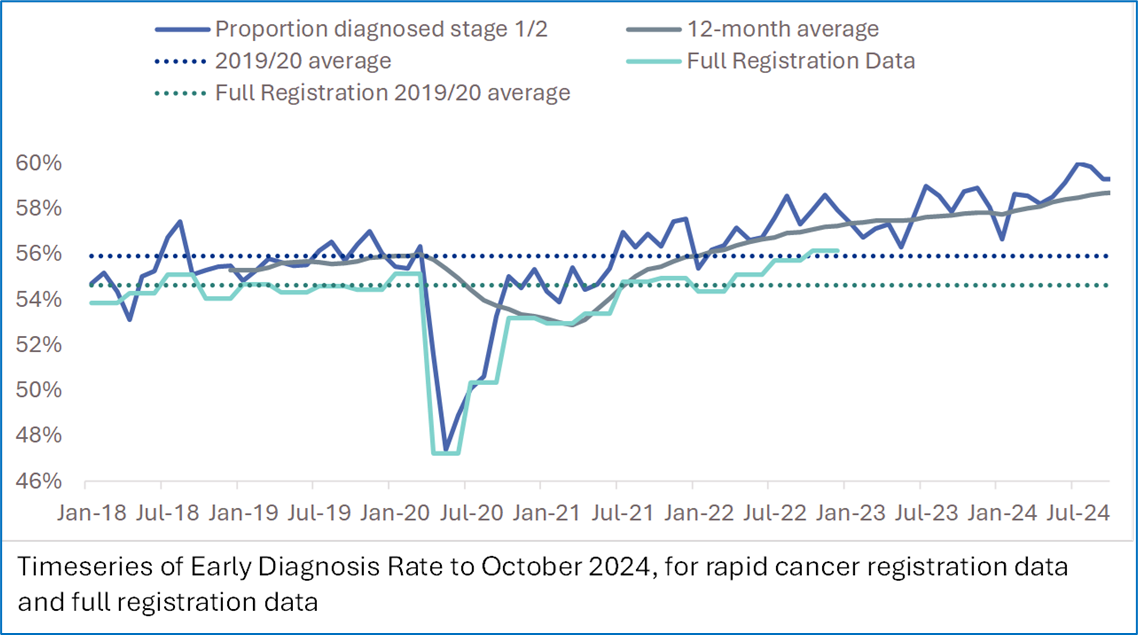
Figure 5: Timeseries of early diagnosis rate to October 2024, for rapid cancer registration data and full registration data
|
Metric |
January 2025 position |
Previous month’s position |
Previous year’s position (January 2024) |
|
Total activity |
2,512,385 |
2,240,935 |
2,398,209 |
|
Total waiting list |
1,696,849 |
1,507,120 |
1,628,838 |
|
6+ week waits |
363,612 |
355,898 |
414,889 |
|
Total CDC activity |
551,233 |
637,960 |
393,742 |
Figure 6: Total waiting list, total activity, 6+ week waits and CDC total activity
Mental health
Planning guidance 24/25 commitment: “improve access to mental health services so that more people of all ages receive the treatment they need”
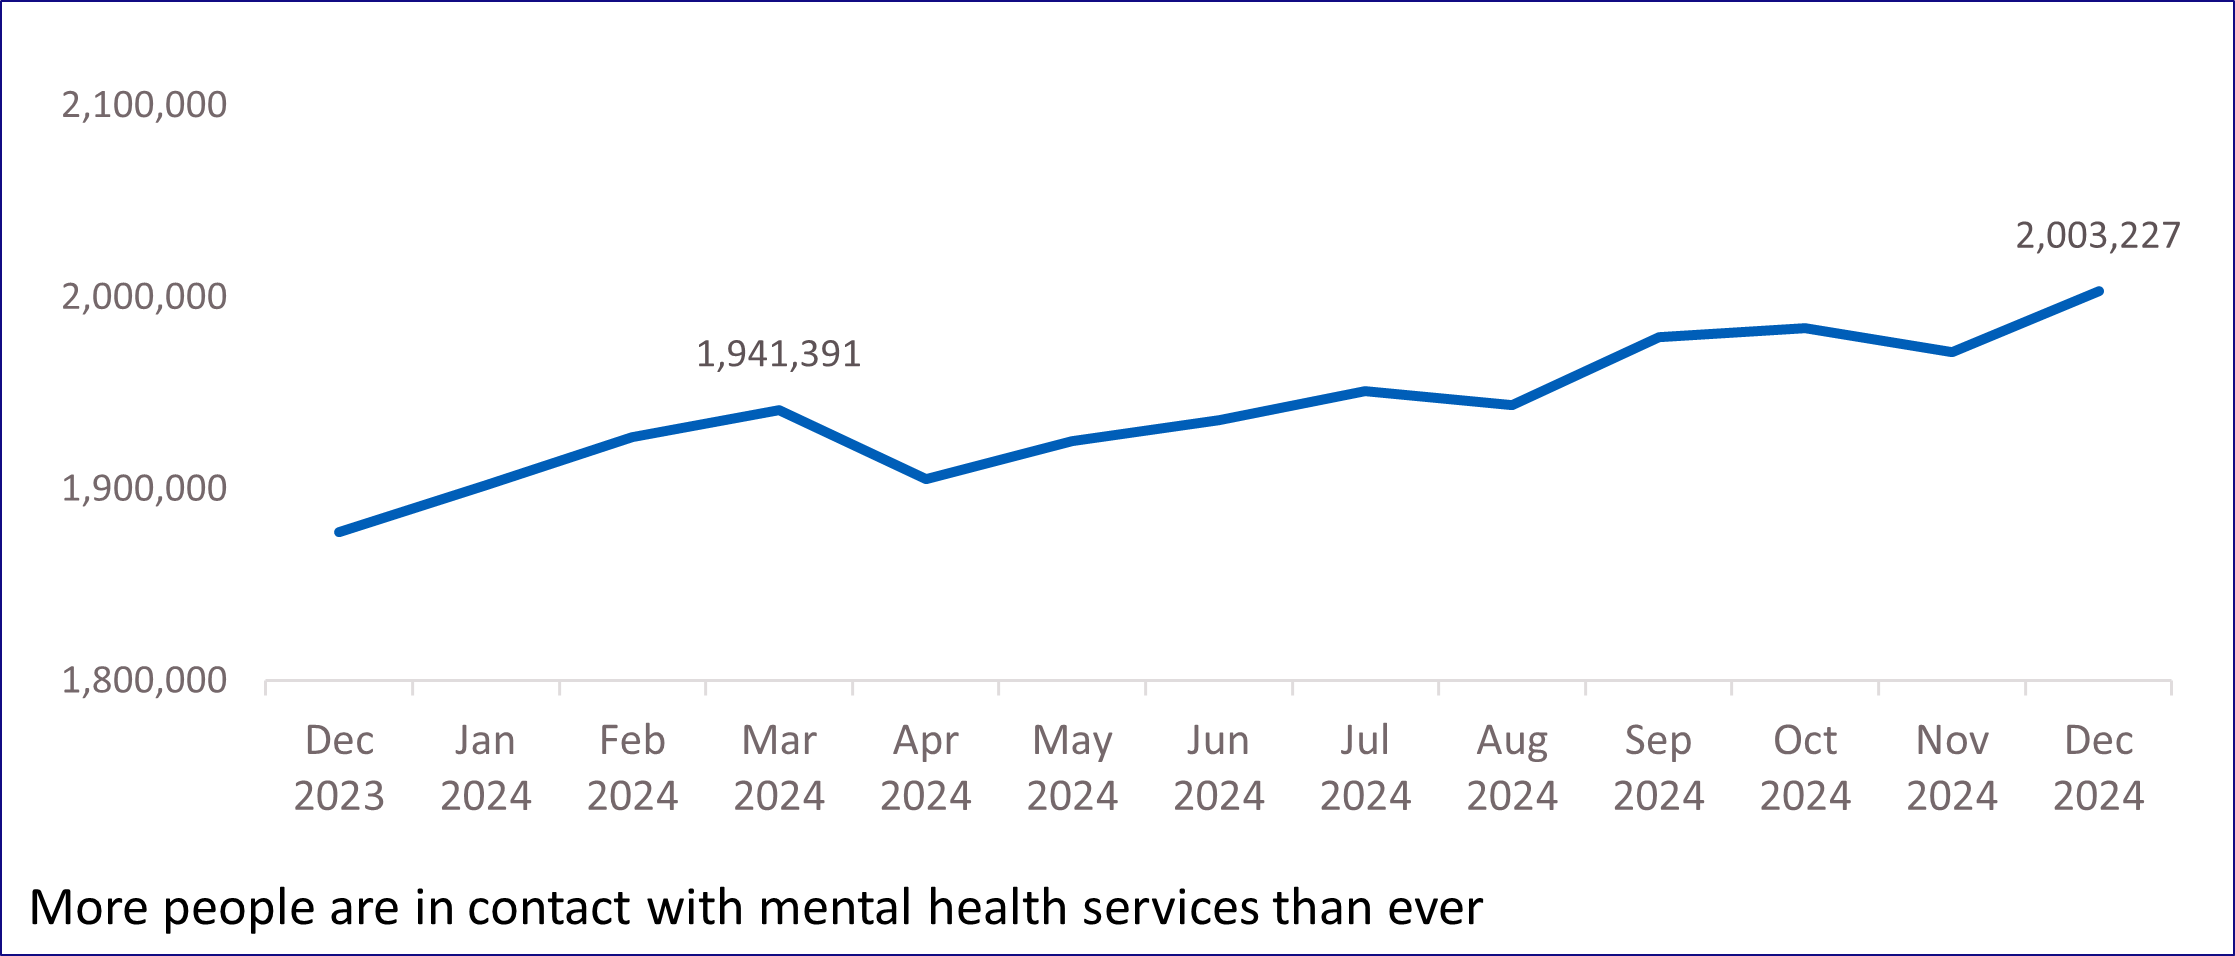
5. Over 2 million people were in contact with mental health services in December 2024, up from 1.94 million in March 2024 and 1.88 million in December 2023.
6. In 2023/24, the NHS achieved the Long Term Plan ambition that at least 75% of people aged 14 and over on a GP learning disability register will receive an annual health check. 77.6% of people on the register received an annual health check and 75.0% of them also received an accompanying health action plan. In 24/25 to date, 51.1% patients received a health check between April 2024 and December 2024, higher than the same period last year.
7. In 2024/25, there has been a concerted effort to reduce out of area lacements (OAPs), although this remains an issue. There were 404 OAPs in January 2025, compared with 407 in March 2024, and 392 in January 2024.
Figure 7: More people are in contact with mental health services than ever
Learning disabilities and autism
Planning guidance 24/25 commitment: “reduce admissions of autistic people into mental health inpatient care and increase discharges into community settings so that the overall number of autistic people in hospital is lower”
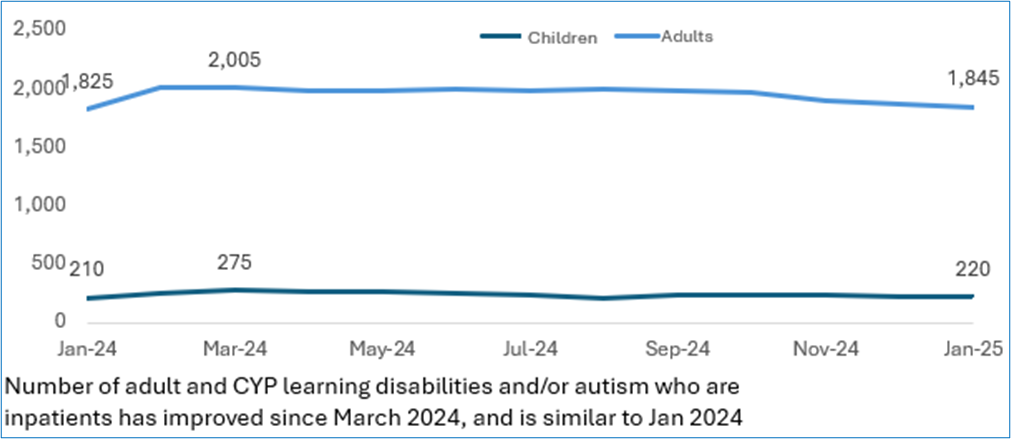
8. The NHS has made progress in reducing the number of people with a learning disability and autistic people in inpatient mental health settings. There are currently 2,065 people (January 2025) with a learning disability and autistic people in a mental health inpatient setting, compared to 2,910 in March 2015 and 2,176 in 23/24. This represents a decrease of 29% which is not at the Long Term Plan 2019 commitment to reduce by 50%.
9. New autism referrals have risen since April 2019, even without additional funding, the NHS has responded to that additional demand, though the gap between demand and supply is yet to be closed. The NHS closed an estimated 6,800 referrals in December 2024, compared to around 1,200 in March 2019, it closed an estimated 100,000 in the last 12 months compared to around 20,000 in 2019/20.
Figure 8: Number of adults and children and young people with a learning disability and/or autism who are inpatients has improved since March 2024, and is similar to January 2024
Primary care
Planning guidance 24/25 commitment: “make it easier for people to access community and primary care services, particularly general practice and dentistry”.
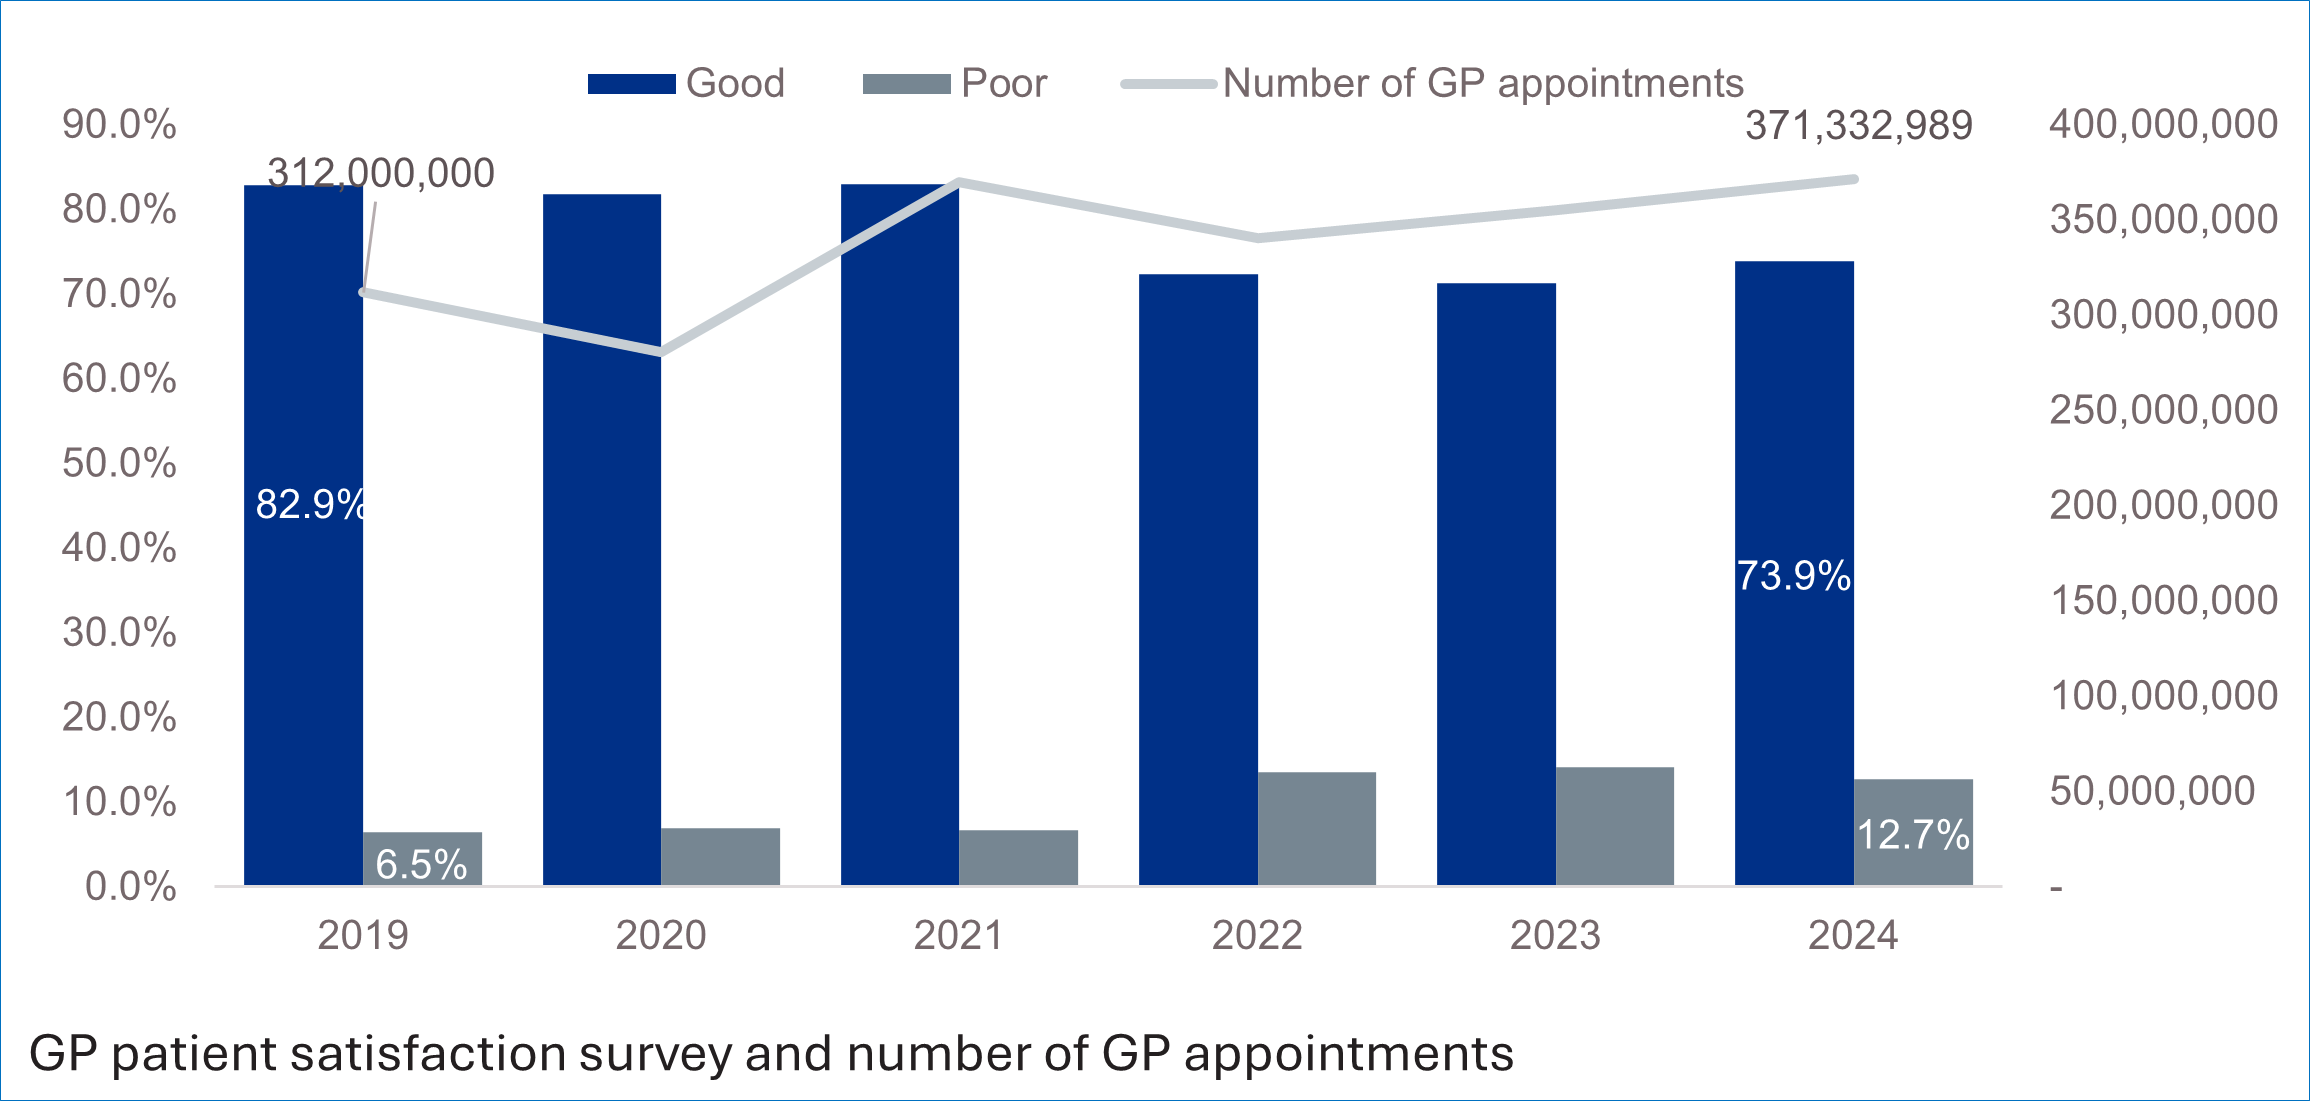
10. In January 2025 there were over 33 million GP appointments, compared with 28.4 million in December 2024 and 32.5 million in January 2024. There has been an increase in patient satisfaction in GPs 73.9% in 2024, compared to 71.3% in 2023.
Figure 9: GP patient satisfaction survey and number of GP appointments
Pharmacy
Planning guidance 24/25 commitment: “people can now directly access advice and treatment from their local pharmacy for seven common conditions”
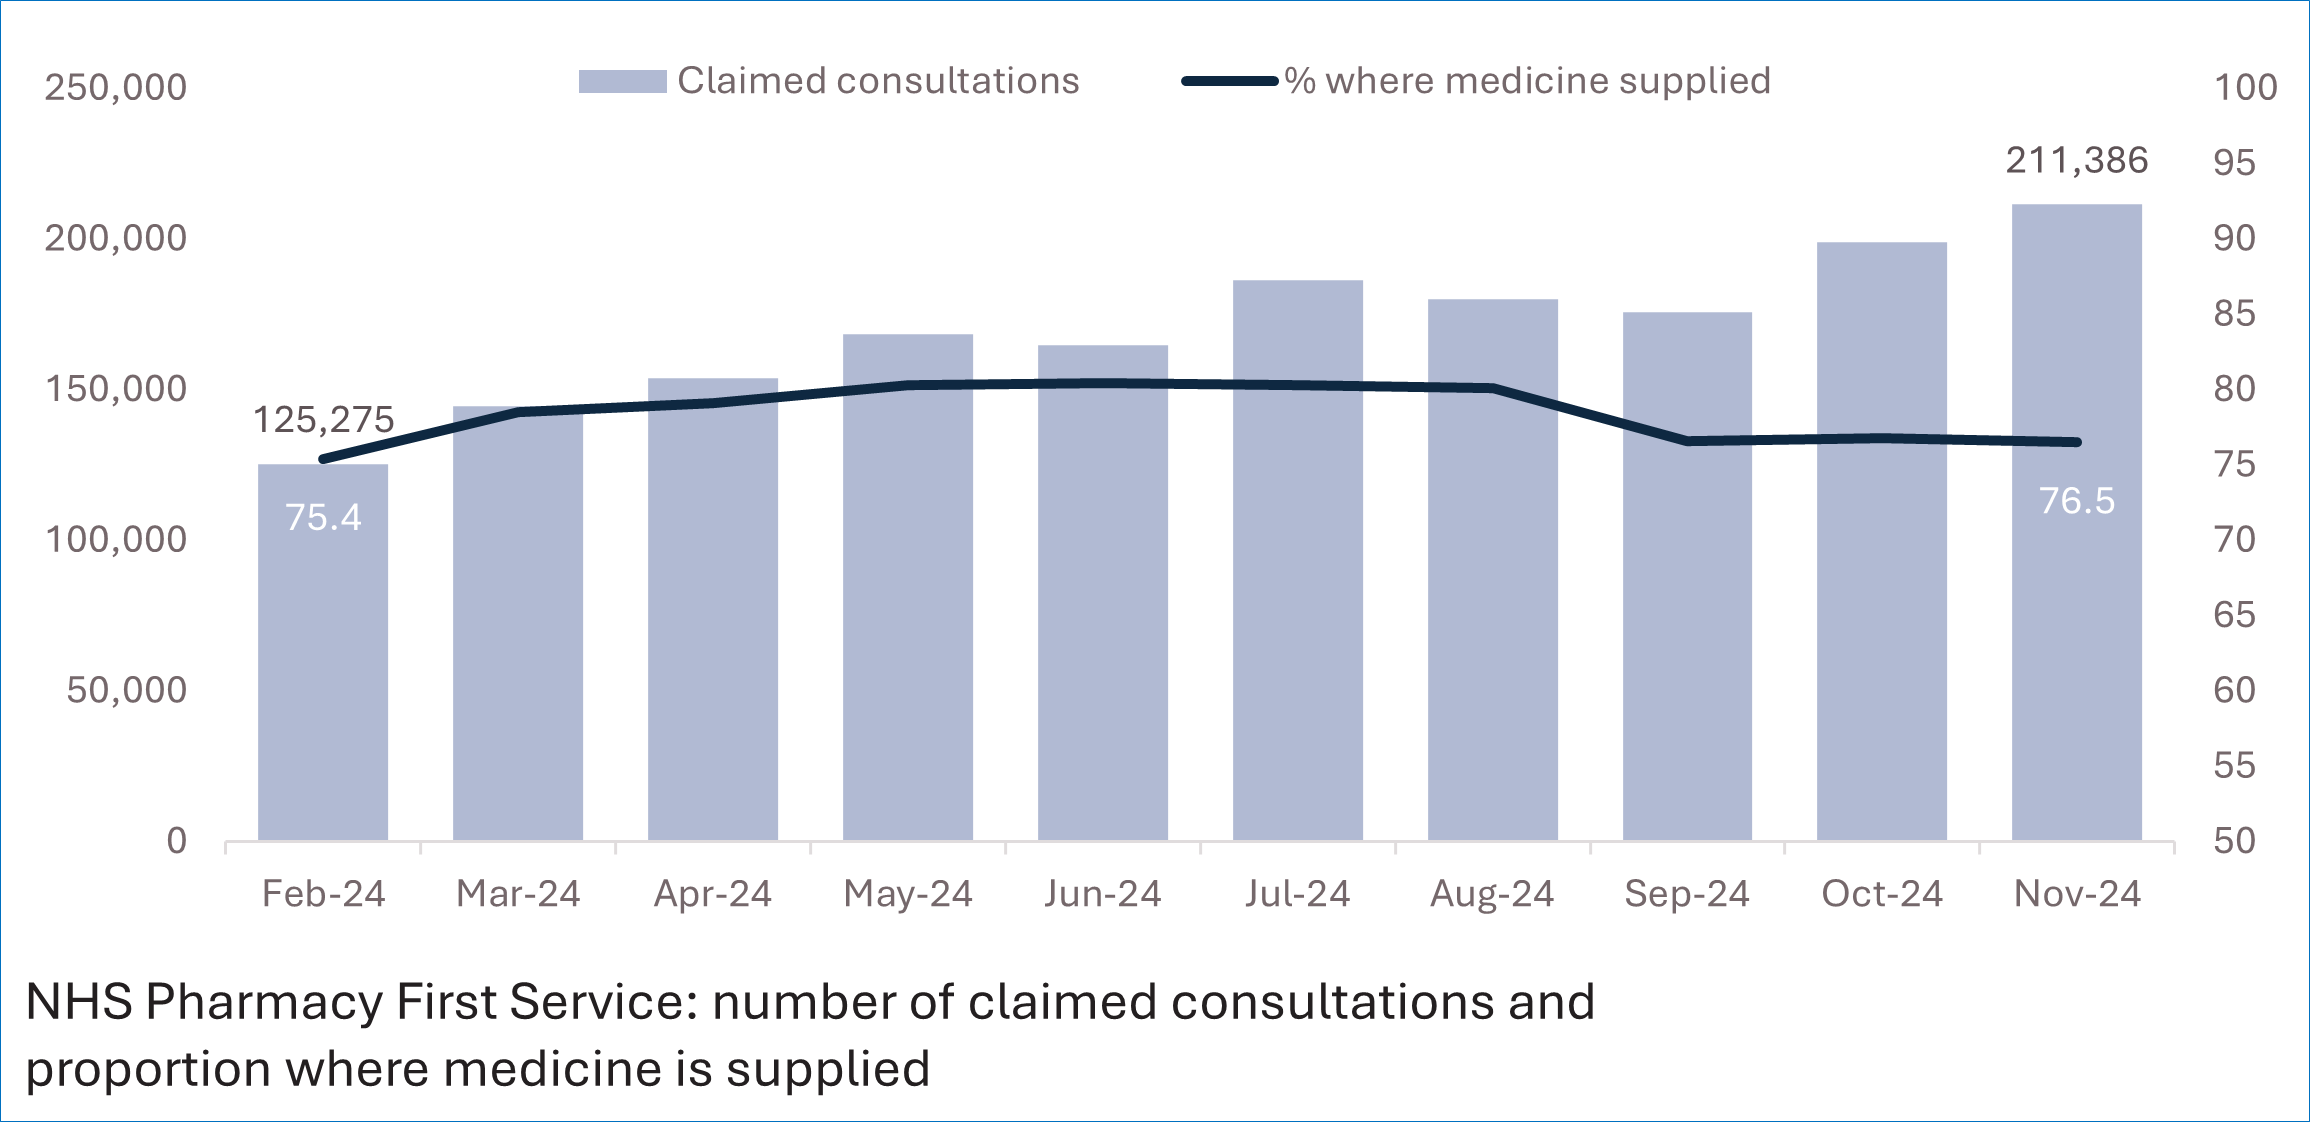
11. In November 2024, there were 211,386 consultations, compared with 198,794 in October 2024 and 144,389 in March 2024. The proportion of medicine supplied via pharmacies remained broadly the same across 2024/25, with 78.5% in March 2024 and 76.5% in November 2024.
Figure 10: NHS Pharmacy First Service: number of claimed consultations and proportion where medicine is supplied
Community care
Planning guidance 24/25 commitment: “make it easier for people to access community and primary care services, particularly general practice and dentistry”
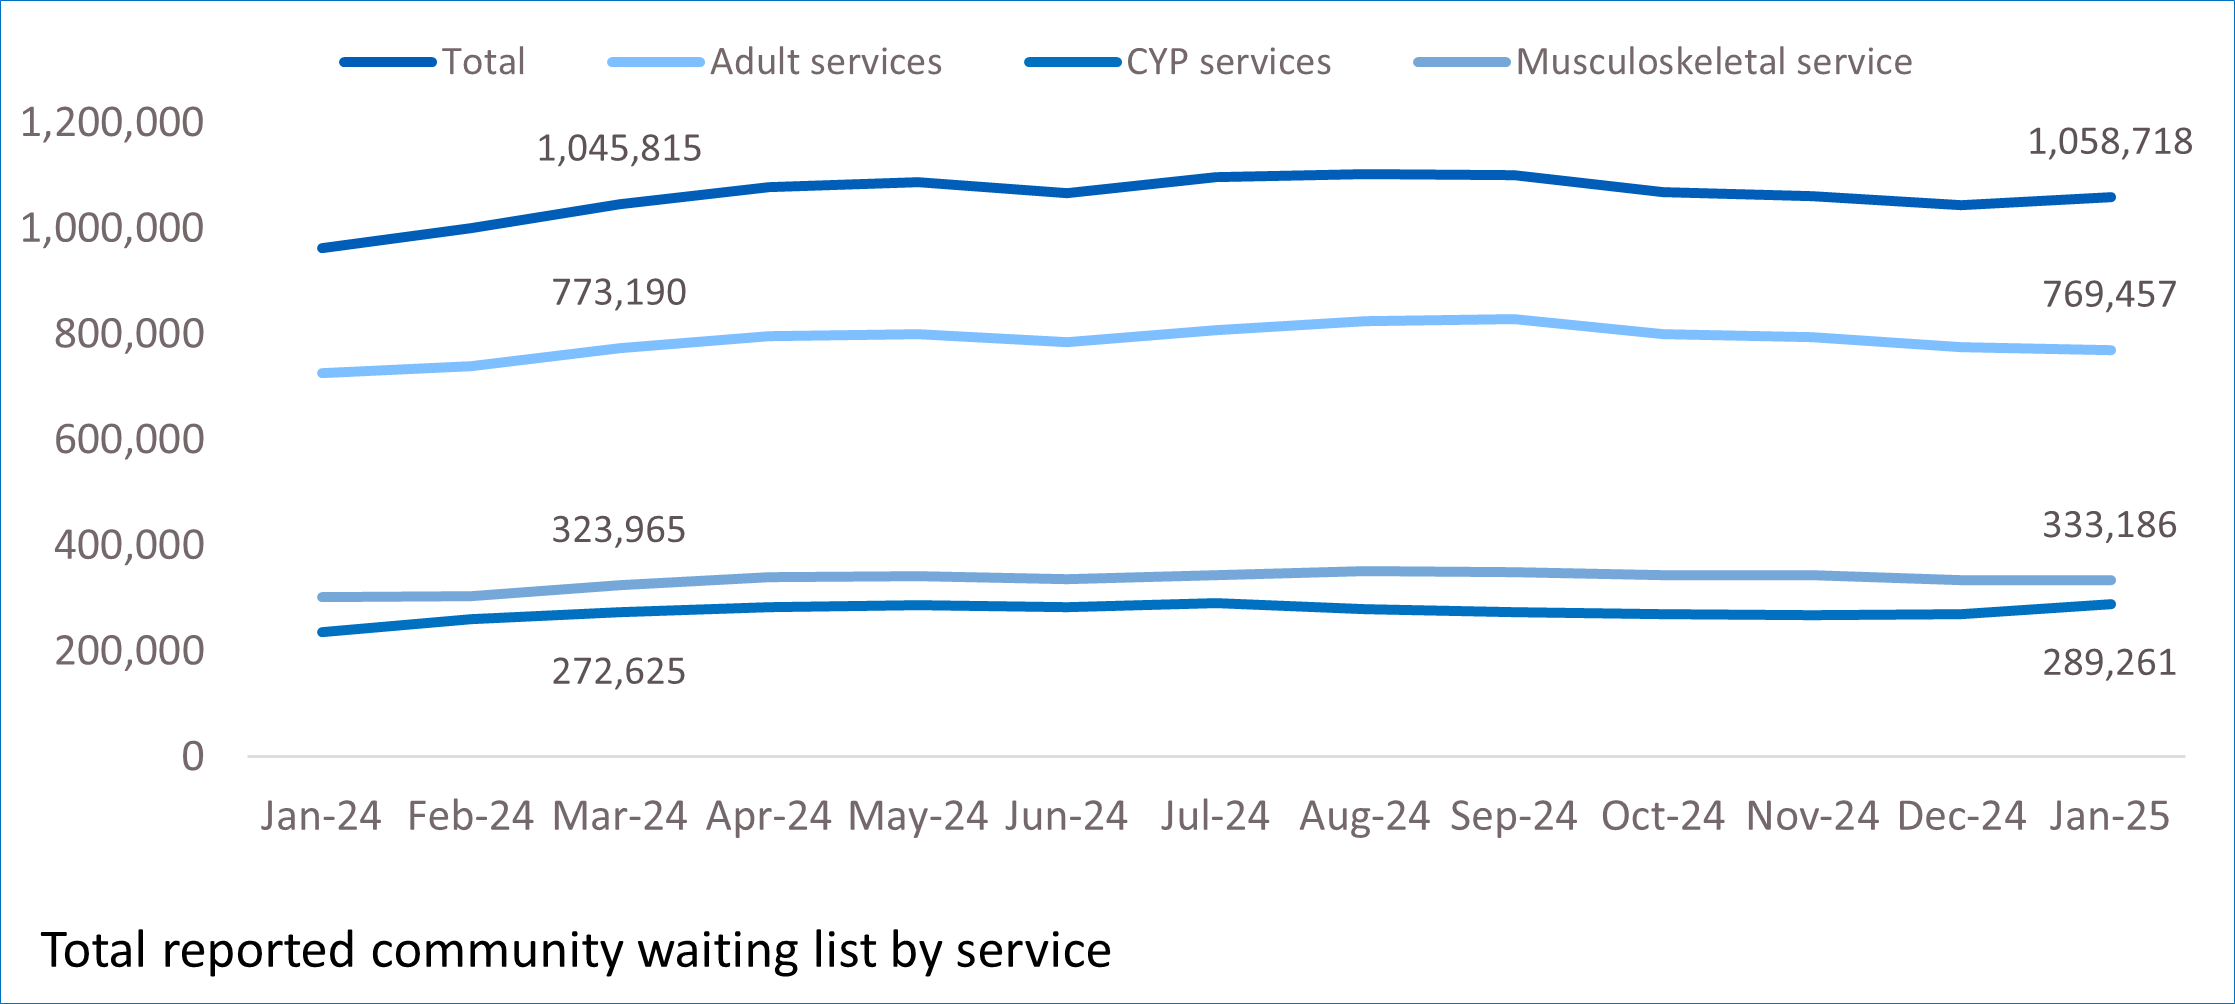
12. The total community wait list was 1.06 million in January 2025, compared with 1.05 million in March 2024. The number of people waiting more than 52 weeks for community services has increase over 2024/25 and was 55,558 in November 2024, compared with 54,944 in October 2024 and 37,630 in March 2024.
Figure 11: Total reported community waiting list by service
Publication reference: Public Board paper (BM/25/09(Pu)