
Evidence for Public Accounts Committee
Background
The Dental Recovery Plan was published in February 2024 with the aim of supporting the then Government’s commitment to improve access to NHS dental care for people who need it. The main aims of the plan were to accelerate recovery from the Covid pandemic and to address some of the inequalities in access between new and returning patients.
NHS dental services were significantly reduced during the pandemic and were slow to recover following the lifting of infection prevention and control guidelines. This meant that in 2023 delivery of dental care was lower than pre-pandemic with corresponding reductions in access. Additionally, the GP patient survey reported that patients new to a dental practice were not as successful in making an appointment as those who had already visited a practice.
NHS England was responsible for delivering the following policies in the plan:
- introduction of a new patient premium for dentists treating new patients
- deployment of mobile dental vans to areas with limited NHS provision, although it was decided not to proceed with this following the July 2024 election
- introduction of a ‘golden hello’ payment to dentists who move to work in areas that struggle to recruit
- raising the minimum indicative Unit of Dental Activity (UDA) value to £28
- supporting dental care professionals to work to their full scope of practice
The aims of these policies were to influence dentists to take on new patients via the new patient premium, increase participation of dental therapists (a policy started in the 2022 reforms) and increase dental care via dental vans in areas of particularly poor access.
NHS England has analysed the impact of these policies on overall dental delivery and access, number of new patients seen and changes in workforce. We have considered low UDA value contracts separately to look for the impact of the increase in minimum UDA value. We have not analysed the impact of golden hello payments as this requires data at the individual clinician level which is not currently available, and these dentists have not been in post long enough to understand the impact they have on delivery of NHS care.
Dentistry was not in a steady state during the period the plan was implemented which has made it more difficult to understand its impact. This is driven partly by the relatively recent implementation of the 2022 reforms (beginning in late 2022 and continuing into 2023), which may have had a broader positive impact on recovery, and the long duration of recovery back towards pre-Covid levels of delivery and it is difficult to be clear when this would have ended. Due to these and other factors, we do not have a clear counterfactual picture of what would have happened had the plan not been implemented. This is a limitation of any retrospective study of a plan where a control is not established and this should be considered when reading the findings.
Main findings
The overall finding of the data analysis is that the Dental Recovery Plan largely did not meet its stated aims.
Dental vans were not deployed following the change in government in summer 2024. We have not been able to assess the impact of golden hello payments for the reasons described above.
Findings on the other interventions are as follows:
- the Dental Recovery Plan did not increase delivery of UDAs (excluding those earned through the new patient premium tariff) in 2024/25
- total new patients per working day declined over 2024/25 by 5%. Adult new patients declined by 8% whereas new child patients increased by 1%. Adult access overall remained stable over 2024/25 and has increased since. Child access increased in 2024/25
- increasing the minimum UDA value to £28 did not increase delivery in these contracts compared to other low value contracts
- increase in dental therapists’ participation in NHS dentistry is part of a longer term trend which started with the 2022 reforms
Changes in overall delivery
Finding: The Dental Recovery Plan did not increase delivery of UDAs (excluding those earned through the new patient premium tariff) in 2024/25.
To assess the impact of the Dental Recovery Plan we have considered change in delivery of UDAs both annually and per working day. These UDAs only include those awarded for courses of treatment delivered – not those awarded via the new patient premium. This allows a like-for-like comparison between years.
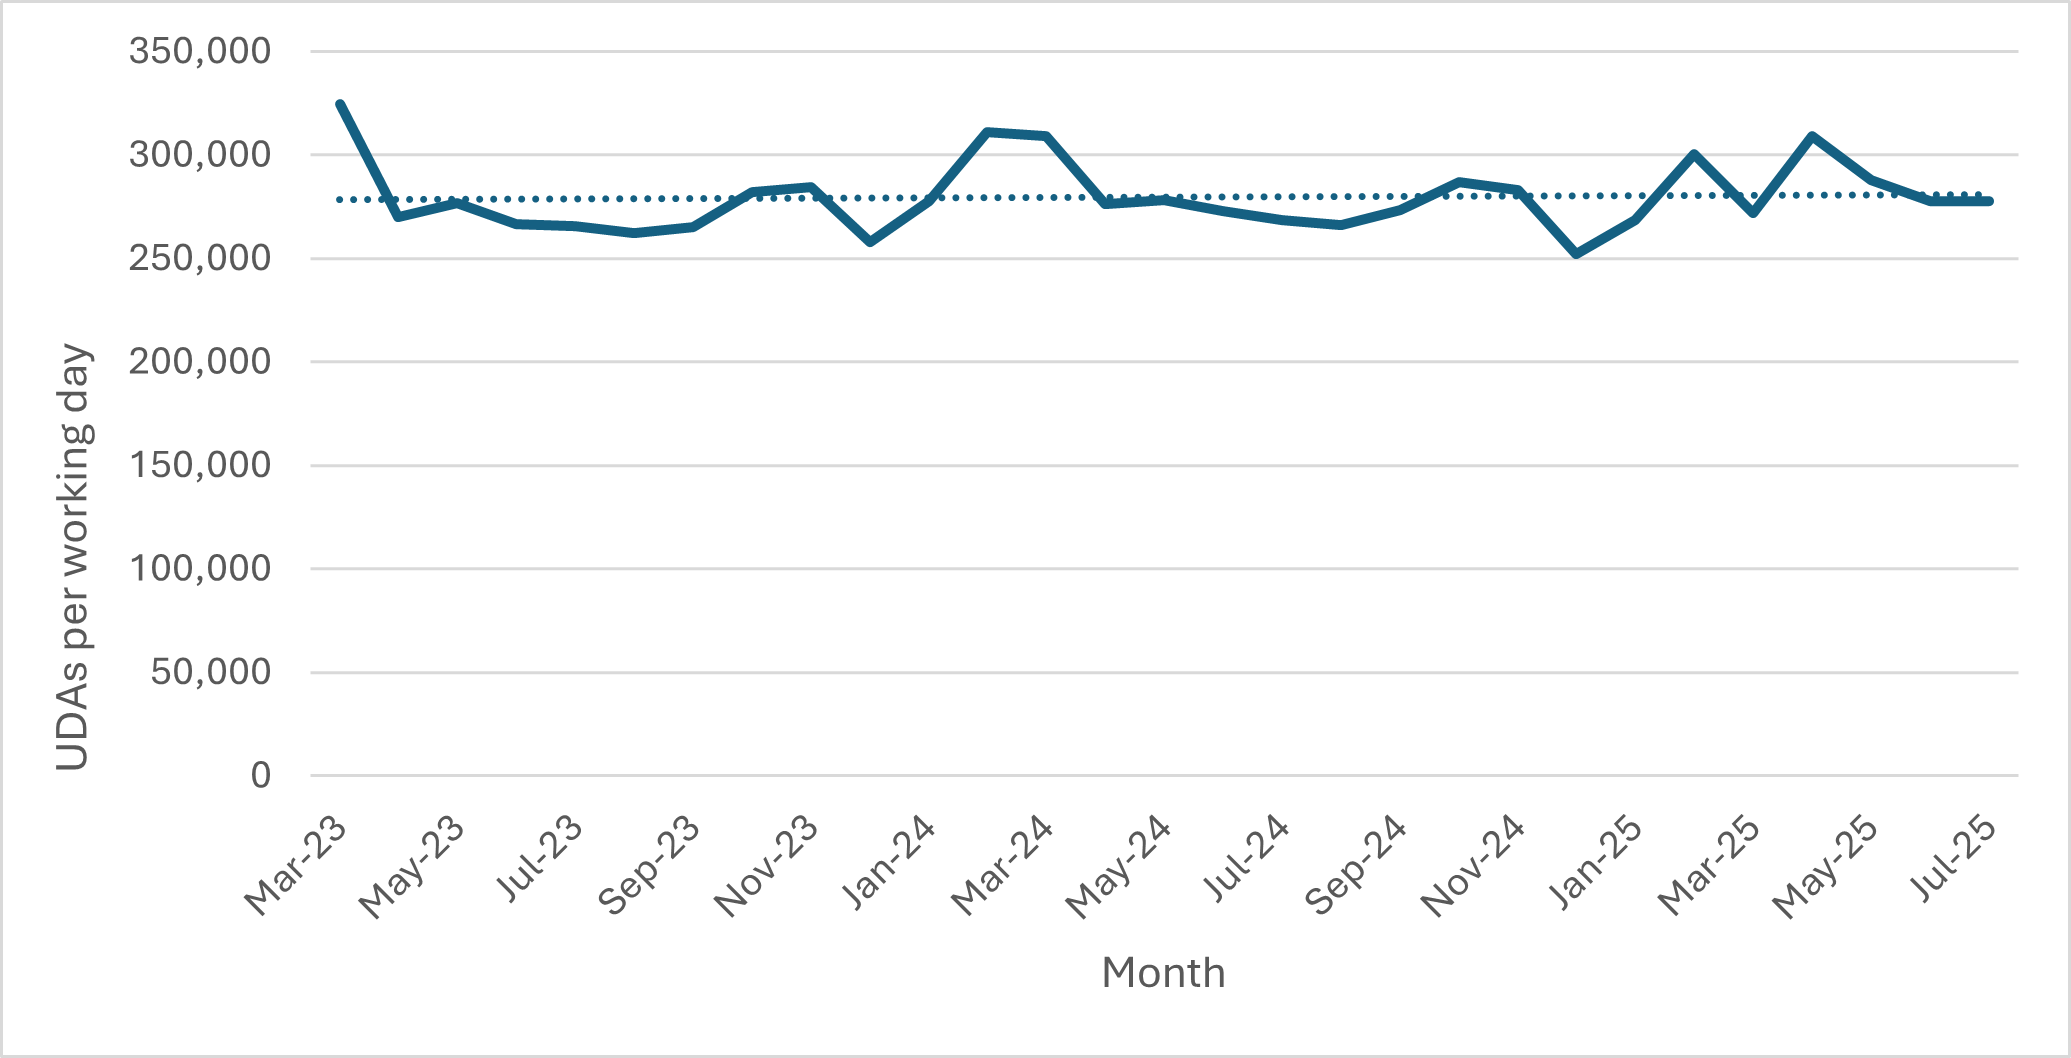
Table 1 shows annual delivery of UDAs increased by 1% in 2024/25 compared to 2023/24. UDA delivery per working day was 1% lower in 2024/25 than 2023/24 but, due to 4 more working days in 2024/25, this resulted in a higher total of UDAs delivered. This contrasts with 2022/23, when compared to 2023/24, and 2024/25 compared to 2025/26 where UDA delivery per working day increased in the second year.
These changes are small and, as shown in Figure 1, delivery of UDAs per working day is stable with a slow increasing trend over the period March 2023 to July 2025. However, 2024/25 did not see a step change increase in delivery of UDAs.
Table 1: Summary of UDA delivery
| 2022/23 | 2023/24 | 2024/25 | 2025/26 (to end July) | |
|---|---|---|---|---|
| UDAs delivered excluding new patient premium | 67,284,246 | 69,377,539 | 69,815,943 | 24,168,693 |
| Working days | 251 | 250 | 254 | 84 |
| Delivery per working day | 268,065 | 277,510 | 274,866 | 287,723 |
| Annual change in UDAs delivered | 3% | 1% | ||
| Annual change in delivery per working day | 3.5% | -1.0% | 4.7% |
Figure 1: UDA delivery per working day
Changes in overall access and new patients seen
Finding: Total new patients per working day declined over 2024/25 by 5%. Adult new patients declined by 8% whereas new child patients increased by 1%. Adult access remained stable over 2024/25 but has increased since. Child access increased in 2024/25.
The new patient premium paid an additional £15 for patients receiving a Band 1 and £50 for patients receiving a Band 2 or 3 course of treatment. Eligible patients were those who had not been seen by the same dentist or contract in the previous 24 months for bands 1, 2 or 3 care. For simplicity we refer to eligible patients as NPP (new patient premium) patients in this report. Dentists were only paid the additional premium for patients whose courses of treatment started on or after 1 March 2024. In some instances, courses of treatment are spread over more than 1 appointment and so there are patients whose treatment started before 1 March 2024 and ended after. These patients are not included in the published activity data, however we have included them here as excluding them would artificially decrease NPP patients seen from March 2024 onwards.
An increase in new patients seen would be expected to lead to an increase in overall access and therefore we have analysed these 2 aspects of dentistry together. We first compare NPP patients in the period the policy was in place compared to the previous year and then consider the impact this had on overall access and recovery of access to pre-pandemic levels. The intention behind the NPP policy was that overall access to an NHS dentist would increase and it would narrow the gap between new and returning patients successfully making an NHS dental appointment, which is measured by the GP patient survey. The final piece of analysis was to consider whether there was a relationship between overall contract performance and change in NPP patients seen.
NPP patients seen
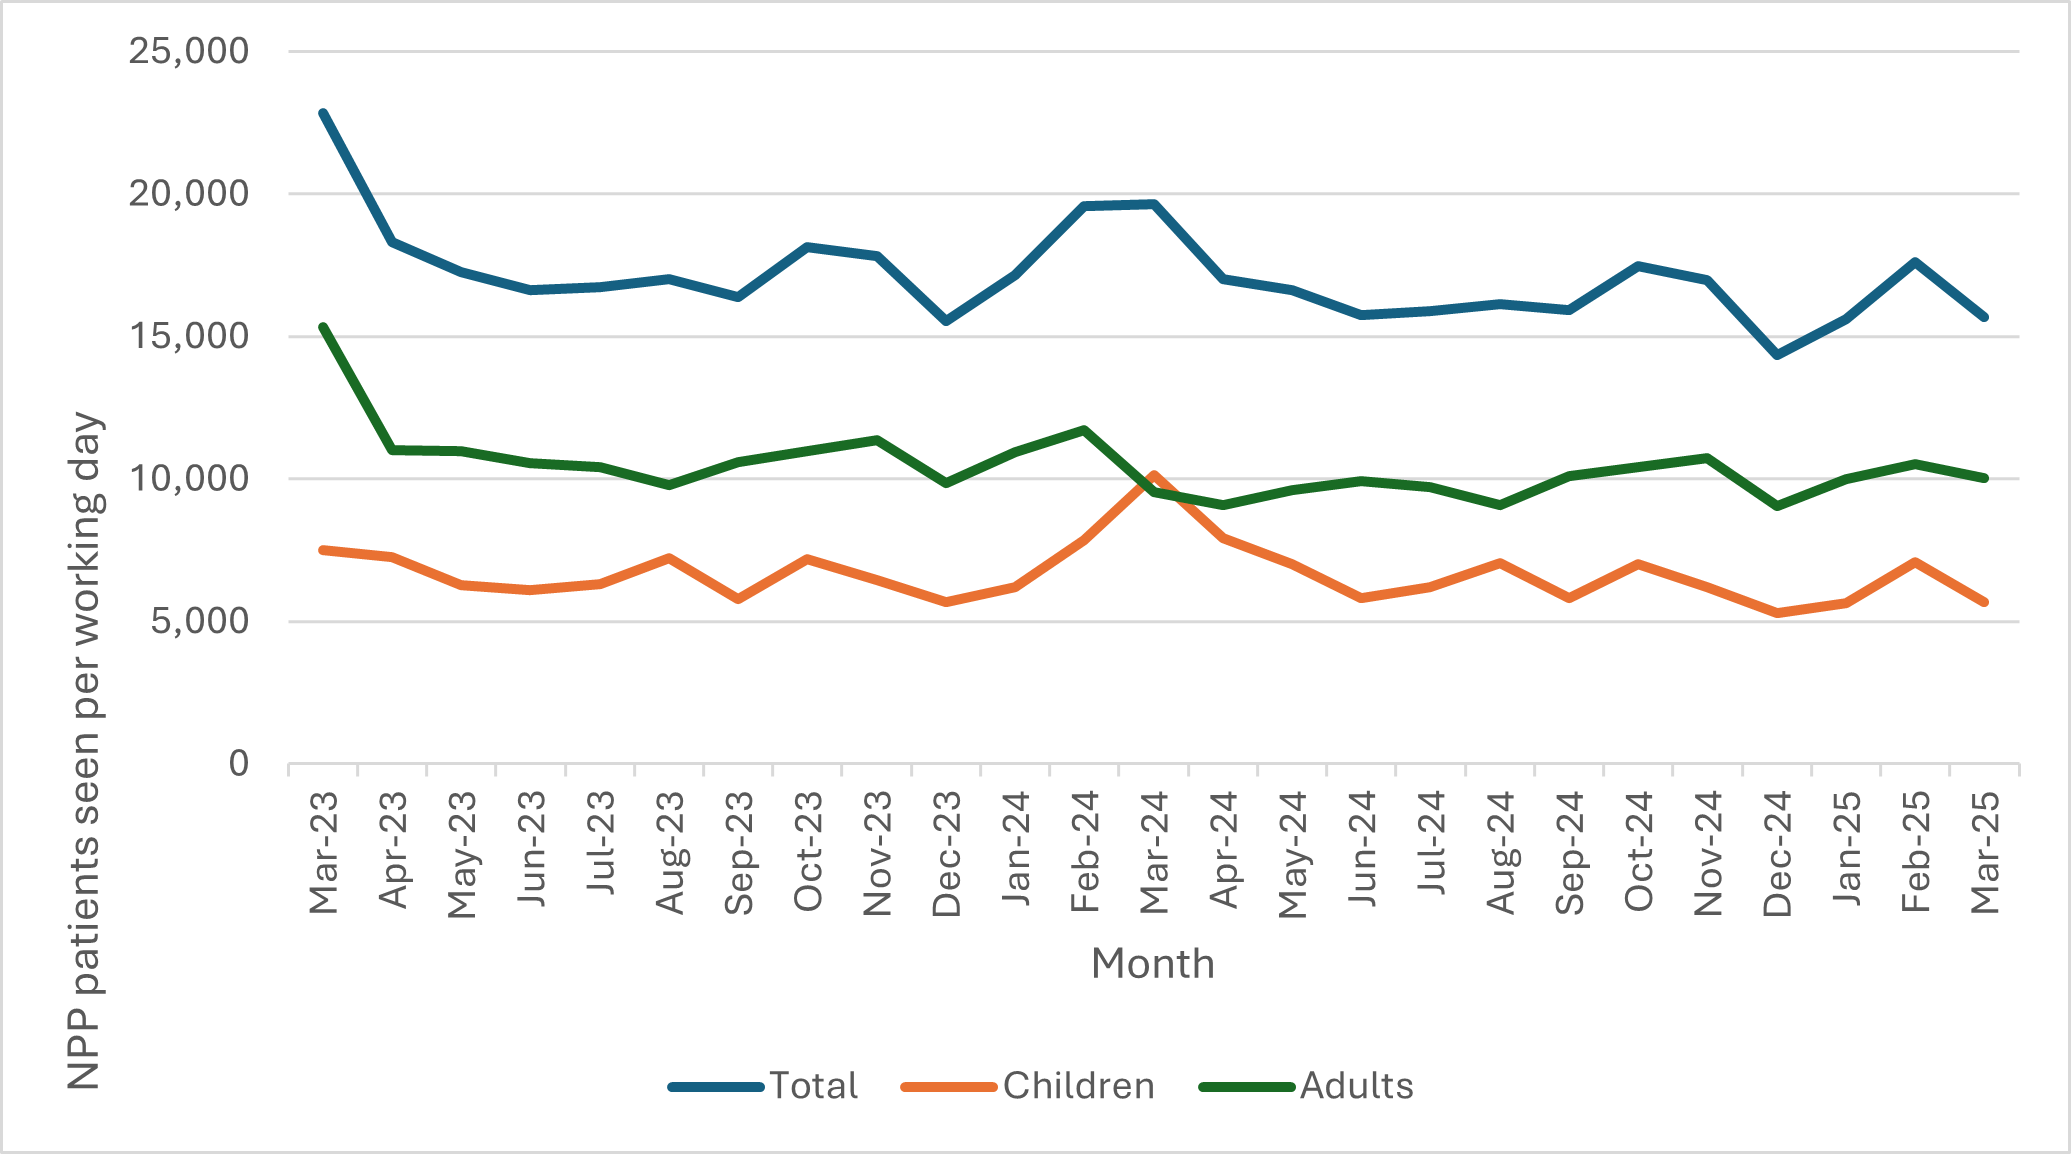
The fact that fewer patients matching the new patient premium definition were seen in the first half of 2024/25 compared to the same months in 2023/24 was reported in the NAO report, and this finding did not change by the end of the year. The full year comparison is shown in Table 2. Compared to a baseline period of April 2023 to February 2025, child NPP patients increased in 2024/25 whereas adult NPP patients decreased and, overall, there was a decrease in NPP patients seen. Figure 2 shows the relative stability in NPP claims per working day from March 2023 to March 2025. There was an increase in the number of NPP patients seen in March 2023. This is likely to be due to increased contract delivery in that month due to contractors being allowed to deliver up to 110% of their contract and receive payment for this additional activity. This led to more NPP patients being seen.
Table 2: New patient premium summary
| All patients | Children | Adults | |
|---|---|---|---|
| Baseline period April 2023 to February 2024 | 17,328 | 6,579 | 10,749 |
| NPP period March 2024 to March 2025 | 16,503 | 6,667 | 9,836 |
| Change | -4.8% | 1.3% | -8.5% |
Figure 2: New patient premium claims per working day
Overall access
Table 3 shows changes in the overall access to NHS dentistry since the pandemic compared to pre-pandemic levels. Child access improved noticeably in 2024/25 whereas adult access did not. Since the end of the NPP, adult access has improved, suggesting factors other than the NPP have influenced this. Urgent care delivery is included in the access data but not in the NPP patients seen. It is possible that the additional adult patients seen since the end of the NPP are those accessing urgent care. As expected from the reduction in adult NPP patients seen, the results of the GP patient survey in 2025 showed no significant difference in success rate of patients not known to a practice making an appointment compared to the previous year.
[NOTE: these adult/child access figures will not match official statistics. These data exclude orthodontic only contracts and are extracted by NHS Business Services Authority using a slightly different specification to the official statistics. However, they are self-consistent.]
Table 3: Change in overall access for adults and children
| Time period ending in | April 2019 | March 2022 | March 2023 | March 2024 | March 2025 | July 2025 |
|---|---|---|---|---|---|---|
| Unique patients seen in the previous 12 months | 24,100,825 | 17,945,935 | 20,379,434 | 20,843,827 | 21,325,602 | 21,436,668 |
| Unique adult patients seen in the previous 24 months | 21,730,701 | 15,050,172 | 17,838,812 | 18,111,864 | 18,117,891 | 18,175,998 |
| Unique child patients seen in the previous 12 months | 7,184,519 | 5,567,545 | 6,452,590 | 6,817,463 | 7,118,704 | 7,202,843 |
| Change in all patients from previous time point (change from April 2019) | (-25.5%) | 13.6% (-15.4%) | 2.3% (-13.5%) | 2.3% (-11.5%) | 0.5% (-11.1%) | |
| Change in adults seen from previous time point (change from April 2019) | (-30.7%) | 18.5% (-19.7%) | 1.5% (-16.7%) | 0.0% (-16.6%) | 0.3% (-16.4%) | |
| Change in children seen from previous time point (change from April 2019) | (-22.5%) | 15.9% (-10.2%) | 5.7% (-5.1%) | 4.4% (-0.9%) | 1.2% (0.3%) |
Relationship between ICB performance and NPP
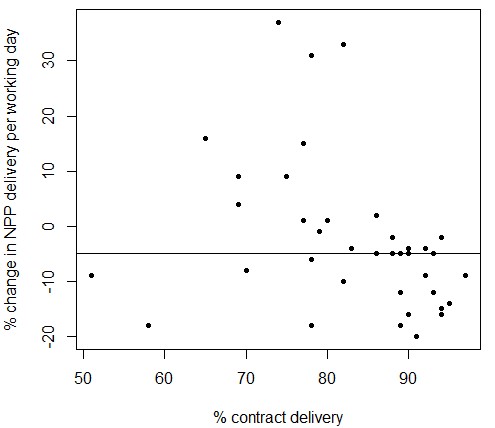
Stakeholders have suggested that a potential reason for the lack of increase in NPP patients was contracts close to delivering 100% of their contracted UDAs were more reluctant to see new patients because the additional premium would put them into ‘over delivery’ and so they would not receive the additional payment. The data we hold on contracted UDAs is not accurate enough to measure this at a contract level. However, when aggregated to ICB level we can look for a relationship between change in NPP patients and percentage contract delivery. Figure 3 shows ICBs with contract delivery between 70 to 80% were more likely to see an increase in new patients compared to the lowest and highest performing ICBs in terms of contract delivery. To a limited extent this supports the stakeholder view but shows that it is not a straightforward relationship.
Figure 3: Scatterplot of relationship between ICB contract delivery and change in NPP patients. The horizontal line indicates median change in NPP delivery
Minimum UDA value
Finding: Increasing the minimum UDA value to £28 did not increase delivery in these contracts compared to other low value contracts. It suggests supply of NHS dentistry is inelastic to price for low UDA value contracts.
The Dental Recovery Plan set a new minimum UDA value for NHS dentistry of £28. The reason for implementing this was to increase delivery of care by recognising there are likely to be minimum costs to the provision of care.
To understand whether increasing the minimum UDA value to £28 changed the delivery of contracted UDAs in this cohort of 870 contracts, we have compared their contract delivery to a comparator group of contracts with UDA values between £28 and £30 in March 2024 with more than 100 commissioned UDAs. This comparator group was 1087 contracts in March 2024. Across both cohorts there were 5 contracts with zero delivery in 2023/24: 2 in the comparator group and 3 in the minimum UDA group. The reason for this is unclear as all these contracts had UDA targets and financial values. We have therefore excluded these from further analysis.
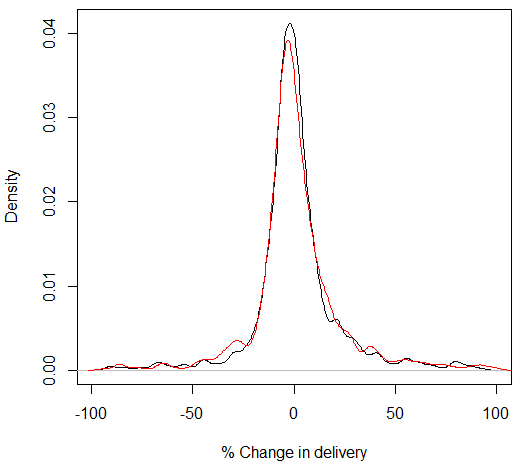
The distribution of change in delivery from 2023/24 to 2024/25 is not normally distributed. The median change in delivery in each contract for the minimum UDA group was -0.011% and -0.006% in the comparator group. The mean change in the minimum UDA group was 22 UDAs and 0.1 UDA in the comparator group, highlighting the skewed distribution of difference in UDA delivery. The non-normality of the data did not change when outliers were removed. We therefore used the Wilcoxon signed-rank test to investigate whether there was a significant difference in stochastic distribution of change in UDAs delivered between the 2 groups. The resulting test demonstrated a 98% chance of no difference in performance between the 2 groups. Figure 4 illustrates the probability distribution of change in performance is almost identical for each group.
Figure 4: Kernel density estimate of percentage change in delivery for minimum UDA value group (red) and comparator group (black) (outliers above 100% change excluded)
Skill mix of dental care professionals delivering NHS dentistry
Finding: Increase in dental therapists’ participation in NHS dentistry is part of a longer term trend starting with the 2022 reforms.
The Dental Recovery Plan aimed to increase dental therapists and hygienists’ participation in NHS dentistry and legislation was introduced to enable them to supply and administer agreed medicines without a prescription. This was part of a longer-term policy to allow these dental care professionals to work to their full scope of practice. To understand whether change occurred we looked at workforce data and delivery for different dental care professionals. The changes to skill mix guidance were announced in July 2022 and published in January 2023. Changes to the FP17 form to allow dental care professionals to report they had led a course of treatment were implemented in April 2024.
We have used NHS England’s workforce data collection from March and December 2024 to assess changes in the time spent on NHS work. March 2024 was the first collection of this data set and as such is likely to be of relatively poor quality. Therefore, we cannot be certain if relatively small changes in reported data between March and December 2024 are real or due to data quality. However, larger changes are likely to be a change in workforce rather than data quality. For this reason, we have not attempted to measure statistical significance and suggest the actual reported change is taken as an indicative rather than a definitive answer.
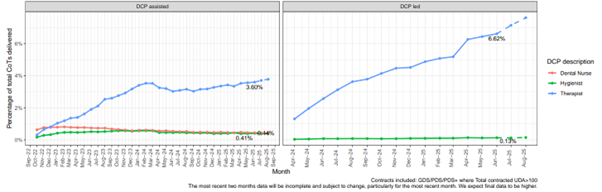
As shown in Table 4, between March and December 2024 there is very little difference in the number of dentists or the proportion of NHS work dentists are doing. However, there is a difference for dental therapists: 28% more NHS full-time equivalent therapists and a 5% increase in the percentage of time therapists spend delivering NHS work in December compared to March. The corresponding change in dental hygienists spending 4% less of their time delivering NHS work suggests they may be delivering the private work therapists were delivering. The increase in delivery of NHS care by dental therapists can be seen in Figure 5. Before the change was made to the FP17 form allowing reporting of dental care professional-led courses of treatment, the proportion of courses of treatment assisted by therapists had been rising steadily. This increase stopped once the change was made, but stayed at an increased level, whereas the proportion of courses of treatment led by a therapist has continued to rise.
The timing of the increase in participation of dental therapists in NHS care means this change is almost certainly driven by the 2022 reforms rather than the Dental Recovery Plan.
Table 4: Workforce changes between March and December 2024
| December 2024 data | Percentage change from March 2024 | |||||||
|---|---|---|---|---|---|---|---|---|
| Role count | FTE | NHS FTE | % of FTE that is NHS | Role count | FTE | NHS FTE | % of FTE that is NHS | |
| Dental hygienist | 5,722 | 2,168 | 323 | 15% | -1% | 4% | 1% | -4% |
| Dental nurse | 25,752 | 19,731 | 13,716 | 70% | 2% | 2% | 2% | 0% |
| Dental therapist | 3,419 | 1,710 | 1,310 | 77% | 17% | 22% | 28% | 5% |
| Foundation dentist | 1,110 | 808 | 761 | 94% | 13% | 2% | 0% | -1% |
| General dentist | 25,911 | 15,293 | 10,727 | 70% | 1% | 2% | 2% | 0% |
| Orthodontic therapist | 1,056 | 598 | 496 | 83% | -2% | 2% | 2% | 0% |
| Orthodontist | 1,207 | 469 | 366 | 78% | -3% | -10% | -12% | -2% |
| Other staff | 7,858 | 5,397 | 3,684 | 68% | -8% | 7% | 3% | -4% |
| Receptionist | 13,331 | 10,107 | 7,409 | 73% | 0% | -3% | -4% | 0% |
| Trainee dental nurse | 11,082 | 9,840 | 7,289 | 74% | -4% | -2% | 1% | 3% |
Figure 5: Percentage of courses of treatment delivered by dental care professionals
Publication reference: PRN02297_ii