
Executive summary
In 2016, Lord Carter’s report Operational productivity and performance in English NHS acute hospitals highlighted the potential to save £1.275 billion by enhancing estate efficiency across the NHS in England.
This report looks at estate costs and performance in 2022/23 compared to those observed by Lord Carter in 2014/15. It is based on NHS trusts’ annual Estates Returns Information Collection (ERIC) submissions.
- Over the past 9 years, the cost of occupancy – the total expenses associated with occupying and operating buildings – across NHS secondary care has fallen by £0.24 billion, from £12.2 billion in 2014/15 to £11.9 billion in 2022/23 (in 2022/23 values).
- The number of patients using these facilities each year has increased by 13.8 million, from 123.9 million in 2014/15 to 137.7 million in 2022/23.
- The non-clinical occupied floor area has dropped from 44% to 33% of the total estate, below Lord Carter’s 35% target. With the integration of new technologies and modern working methods, trusts are aiming to further reduce non-clinical space to below 30%.
- The amount of floor area used for each patient attendance has decreased by 7% in the same period, contributing to the lower overall occupancy costs.
- Under-utilised occupied floor area has dropped to 1.9% from 4.4% in 2014/15.
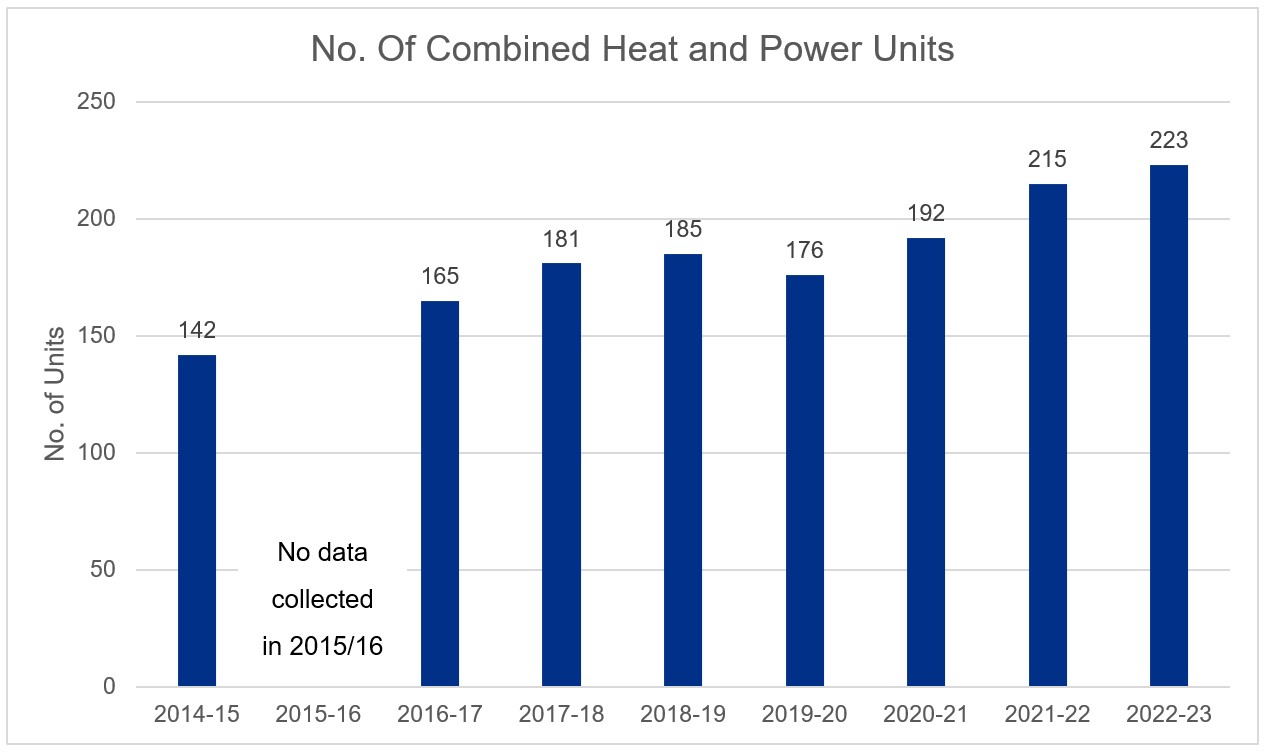
- More than 1,850 energy efficiency schemes have been implemented since 2018/19. 81 new combined heat and power (CHP) units have been installed and 47% of the estate is now using LED lighting.
- Estates and facilities management teams have reduced the ongoing cost of their services by 17% (£2.24 billion or £16 per attendance).
The national estates team is shifting its focus to how the estates and facilities management community can boost productivity by investing in failing infrastructure and supporting more effective operating models. This report acknowledges the remarkable achievements of estates and facilities management teams over the past 9 years and sets a benchmark for future progress.
Introduction
The Estates Returns Information Collection (ERIC) provides information about the costs of providing, maintaining, and servicing the estates of NHS trusts in England. In recent years, ERIC has become more detailed, allowing for in-depth analysis of core estate, and has expanded its scope, with data on fire safety and carbon reduction now included.
In February 2016, as part of a review of productivity and efficiency in English NHS acute hospitals, Lord Carter evaluated the performance of the NHS estate. The report concluded there was significant unwarranted variation across trusts which could be worth £1.275 billion in efficiency savings if trusts rationalised their estates and reduced the costs of occupancy.
Lord Carter recommended:
- reducing non-clinical floor space from 44% to a maximum of 35% of the occupied floor area
- reducing unoccupied or underused space from 2.8% to a maximum of 2.5% of the occupied floor area
- reducing energy consumption, with investment in energy-saving schemes including LED lighting and combined heat and power units
- meeting the 2014/15 median benchmarks for soft facilities management costs, including cleaning costs per square meter (occupied floor area) and inpatient food costs per meal, which were £38 per square meter for cleaning and £2.7 per meal respectively for the acute sector
- improving the governance and assurance of the data returns
This report reviews how utilisation of the NHS estate and costs of occupancy have changed since the publication of the Carter report and evaluates progress.
A note about this analysis
The source data used in this report is publicly available information. The detailed methodology and specific figures used in the analysis are not publicly available, but have been independently verified.
The analysis incorporates all outsourced estates and facilities services conducted offsite or by external contractors.
It recognises that some non-clinical, non-EFM services have shifted from in-house/on-site to other non-NHS secondary organisations, potentially contributing to a reduction in non-clinical space, but not necessary to costs to deliver that service.
The analysis does not account for changes in patient flows or shifts in the complexity of attendance.
In summary, the methodology remains consistent with the approach used at the outset of the Carter review.
Space
Summary
- The secondary care NHS estate has increased by 3% (779,000 square meters) since the publication of the Carter report in 2014/15, while patient attendances have increased by 11%.
- Non-clinical space has reduced to 8.0 million square meters (32.6%) from 10.6 million square meters (44.1%), while clinical space has increased by 3.4 million square meters from 13.2 million square meters in 2014/15 to 16.6 million square meters in 2022/23.
- This increase in clinical space is the equivalent to 34 general acute hospitals.
- Unutilised space has reduced to 470,000 square meters (1.87%) from 695,000 square meters (2.80%)
Occupied floor area
1. The current occupied floor area of the NHS estate, as reported in 2022/23, is 25 million square meters. The gross internal area is reported as 27.2 million square meters, and includes space used for services such as carparks. In these analyses, occupied floor area is used to normalise costs, instead of gross internal area, as sites with large multi-storey car parks, for example, would skew results.
2. The occupied floor area of the NHS estate has increased by 3% since the publication of the Carter report, with estate associated with acute trusts increasing year on year since 2016/17 (Figure 1). Comparatively, patient activity (including patient admissions, outpatients and accident and emergency) has increased by 11% over this time. This has resulted in a reduction in occupied floor area per attendance. Actual data will be monitored against this projection for accuracy, and modelling assumptions will be updated accordingly.
3. The reduction in occupied floor area per attendance indicates a more efficient use of estate, while still meeting patient needs. This has likely been achieved through rationalisation of the estate, combined with increased clinical utilisation of the estate, through longer operational hours and programmes such as Getting It Right First Time (GIRFT).
4. In addition, some of this reduction of non-clinical space will be a result of the transformation of non-clinical spaces to accommodate increasing demand across secondary care.
Figure 1: Occupied floor area and occupied floor area per attendance since 2014/15
Figure 1a: Occupied floor area by all NHS trusts
The occupied floor area (OFA) in millions of square meters by different types of trusts between 2014/15 and 2022/23.
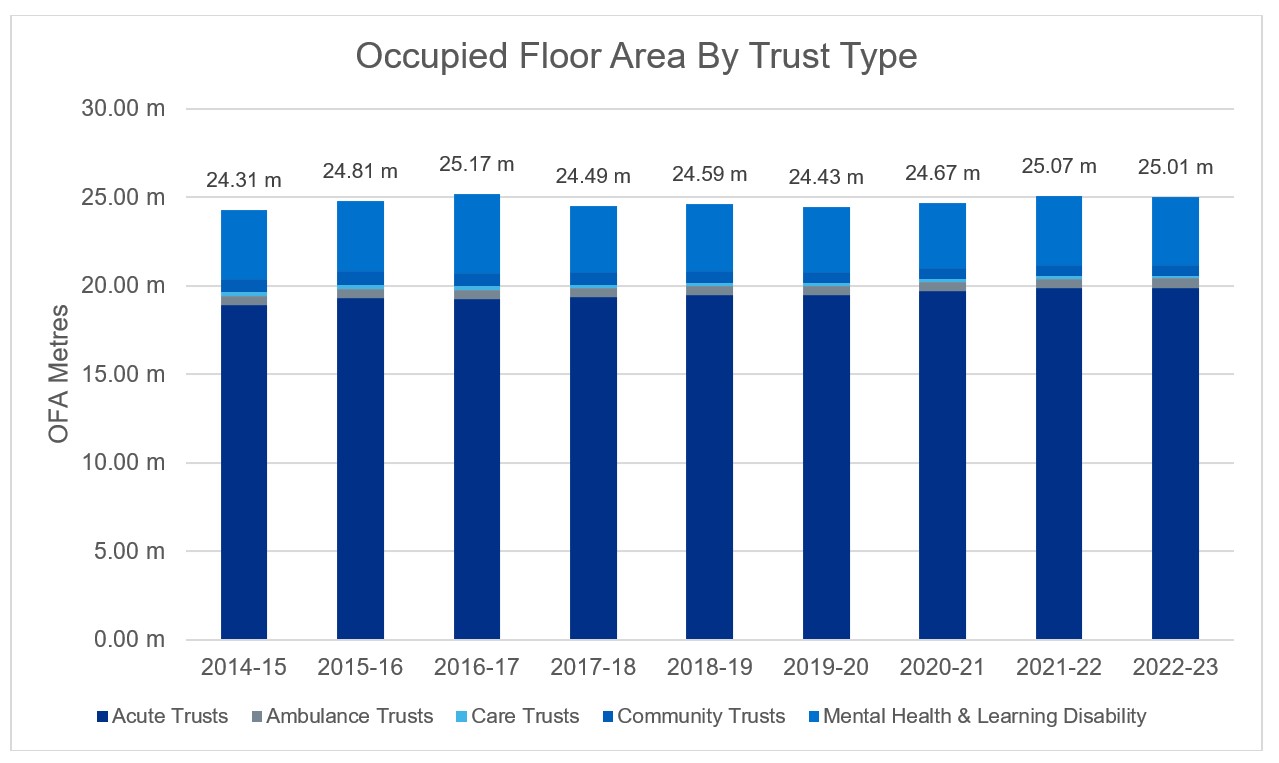
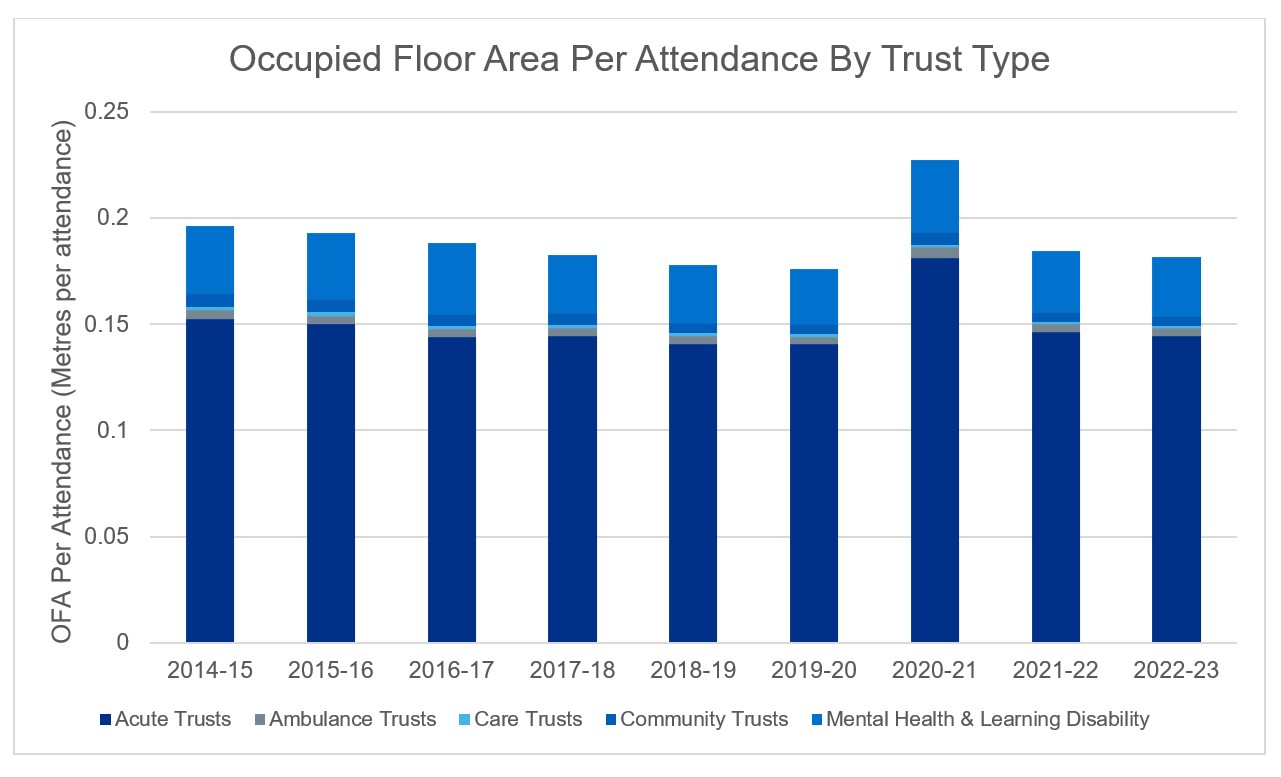
Figure 1b: Occupied floor area per attendance across all NHS trusts
The occupied floor area (OFA) per patient attendance, including inpatient, outpatient and emergency attendances, increased during 2020/21 because of a drop in attendances associated with COVID-19.
Cost of occupancy
Summary
- The Carter report highlighted a potential for savings of £1.275 billion across the NHS estate (£1.87 billion in real terms).
- Cumulatively, real cost savings of £1.25 billion have been made since 2014/15 (relative to 2014/15 reported cost of occupancy).
- In 2022/23 alone, the NHS estate exceeded this, with efficiency savings of £2 billion relative to 2014/15 (based on a cost per attendance comparison).
The nominal costs of occupancy
The cost of occupancy incorporates finance costs, hard facilities management costs, soft facilities management costs and management costs. Over the years, the level of detail collected in the annual ERIC returns has increased, with greater definition in each field. A breakdown of the fields collected each year is shown in Appendix A.
1. The reported nominal cost of occupancy reported in 2014/15 was £8.3 billion, increasing to £12.4 billion in 2022/23 (Figure 2). This is the nominal cost paid each year by the trusts and does not incorporate inflation.
2. The number of attendances that have been seen in this time period has increased by 13.8 million attendances, from 123.9 million in 2014/15 to 137.7 million in 2022/23.
3. The real cost of occupancy, detailed in the next section incorporates the impact of inflation and allows for like-for-like cost comparisons across each year.
Table 1: reported nominal costs of occupancy
The costs below include electro-biomedical engineering (EBME) when it was reported. Costs are in millions of pounds.
| Cost (£m) | 2014/15 | 2015/16 | 2016/17 | 2017/18 | 2018/19 | 2019/20 | 2020/21 | 2021/22 | 2022/23 |
|---|---|---|---|---|---|---|---|---|---|
| Finance costs | 3,228 | 3,452 | 3,575 | 3,804 | 3,962 | 4,120 | 4,365 | 4,677 | 5,070 |
| Hard facilities management | 2,264 | 1,998 | 2,069 | 2,118 | 2,381 | 2,368 | 2,501 | 2,802 | 3,328 |
| Management costs | – | – | – | – | – | 178 | 190 | 215 | 225 |
| Soft facilities management | 2,807 | 2,876 | 2,973 | 2,898 | 3,156 | 3,077 | 3,153 | 3,989 | 3,800 |
| Total | 8,300 | 8,371 | 8,616 | 8,820 | 9,499 | 9,740 | 10,210 | 11,093 | 12,423 |
The real costs of occupancy
1. To compare the real cost of occupancy over the last decade, the costs associated with each of the metrics were adjusted for inflation (see Appendix D). The real costs are shown in Table 2.
Table 2: real costs of occupancy
The costs below include electro-biomedical engineering (EBME) when it was reported. Costs are in millions of pounds.
| Cost (£ m) | 2014/15 | 2015/16 | 2016/17 | 2017/18 | 2018/19 | 2019/20 | 2020/21 | 2021/22 | 2022/23 |
|---|---|---|---|---|---|---|---|---|---|
| Finance costs | 4,582 | 4,833 | 4,860 | 4,991 | 5,073 | 5,141 | 5,371 | 5,312 | 5,070 |
| Hard facilities management | 3,740 | 3,330 | 3,338 | 3,283 | 3,617 | 3,460 | 3,641 | 3,647 | 3,328 |
| Electro-biomedical engineering (EBME) maintenance | – | – | 382 | 471 | 477 | 478 | 507 | 503 | 500 |
| Other | 3,740 | 3,300 | 2,956 | 2,813 | 3,140 | 2,982 | 3,134 | 3,143 | 2,829 |
| Management costs | – | – | – | – | – | 198 | 207 | 226 | 225 |
| Soft facilities management | 3,841 | 3,867 | 3,901 | 3,686 | 3,886 | 3,683 | 3,691 | 3,738 | 3,800 |
| Total | 12,163 | 12,000 | 12,099 | 11,960 | 12,576 | 12,483 | 12,910 | 12,922 | 12,423 |
| Total (Excluding EMBE) | 12,163 | 12,000 | 12,099 | 11,490 | 12,099 | 12,004 | 12,403 | 12,419 | 11,924 |
2. The following inflation indexes were collated: energy, facilities management, inflation (BCIS), Food and Catering RPI, RPI, Laundry Cost Index, NHS pay and Tender Price Index (BCIS). A weighted inflation index was used, to incorporate the impact of different energy use and the proportion of total occupancy cost attributed to pay. All real costs reference the baseline financial year of 2022/23.
3. Definitions of each metric have been refined over the last 9 years, to help increase the comparability and accuracy of the data collected. In the 2016/17 return the definitions explicitly stated that contributions to costs should be offset against costs, to show actual costs of their estates and facilities services. Following site-level analysis, it is assumed that income was likely offset against costs in years prior to this (potentially with some inconsistency across sites).
4. Contributions to cost were no longer offset, and collected separately, from 2018/19 onwards showing the true cost of the estate. Therefore, the nominal figures reported prior to (and including) 2017/18 will be lower than the equivalent reported in later years. This is seen as a key driver for the increase in occupancy costs from 2018/19 onwards, with the true cost of running the estate being reported by trusts.
5. Electro-biomedical engineering (EBME) costs were not specifically collected prior to 2016/17. In the latter years, it is also understood that the total EBME costs were also understated. As a result, to compare across years EBME costs were excluded from the real cost analysis.
Trends and potential savings
1. From 2014/15 to 2017/18 there was a downward trend in the real cost of occupancy (taking into account inflation and excluding Electro-biomedical engineering (EBME)) from £12.2 billion to £11.5 billion. In 2018/19 the increase in cost of occupancy is likely due to the change in reporting methodology, with contributions to costs no longer offset (£0.7 billion in nominal terms). Furthermore, services in 2019/20 and 2020/21 were both impacted by COVID-19. Following COVID-19, the cost of occupancy has returned to pre-COVID levels. Based on the real cost of occupancy (Figure 4), actual savings of £0.24 billion were made across NHS estate spending in 2022/23 relative to 2014/15 (excluding EBME).
2. Savings are likely to be greater than this, as the total cost of occupancy may be understated before 2017/18 due to contributions to the cost being offset. In 2014/15 the reported nominal contributions to costs (from retail leases and services provided to other organisations) were £278 million (£0.4 billion in real terms).
3. The £0.24 billion saving in 2022/23 does not account for the fact that the current estate now serves 13.8 million more attendances than in 2014/15. These additional attendances all have an associated impact on the cost of occupancy, which has been absorbed by the trust estates teams in the running of their estate.
4. In terms of productivity saving, the per-attendance real cost has decreased by 12% (excluding EBME). The real cost of occupancy per attendance decreased from £98.14 in 2014/15 to £86.60 in 2022/23 (Figure 4), an increase in efficiency of 12%.
5. As mentioned, in 2014/15 contributions to costs were offset against the total reported figures and therefore the total cost of occupancy is likely to be understated, this is estimated to be equivalent to £3.18 per attendance in real terms for 2014/15. Adjusting for this, the real cost per attendance in 2014/15 would be £101.31 (£98.14 + £3.18). Relative to this, a decrease in the total real cost of occupancy per attendance of £14.72 was observed in 2022/23. Based on this estimate, a potential increase in efficiency of the estate as high as 15% is indicated.
6. The increase in patient attendance will be a key driver in the rising cost of occupancy. While variable costs, such as soft facilities management, have risen with increasing attendances, trusts have benefited from economies of scale and operational efficiencies when considering costs on a per-attendance basis. Fixed and semi-variable costs would have been less impacted by the increasing attendance. However, it is assumed that the rise in attendance has increased the wear and tear of the estate, leading to higher costs. Nonetheless, from a cost-per-attendance perspective, economies of scale and the operational adaptations made by trusts have led to an improved cost-per-attendance.
Figure 2: changes in the real cost of occupancy
The figures below show the types of costs contributing to the costs of occupancy, variation in the real cost of occupancy compared to the 2014/15 baseline and the real cost of occupancy over time. All of the figures exclude electro-biomedical engineering (EBME).
Figure 2a: cost of occupancy (in real terms) across all NHS trusts
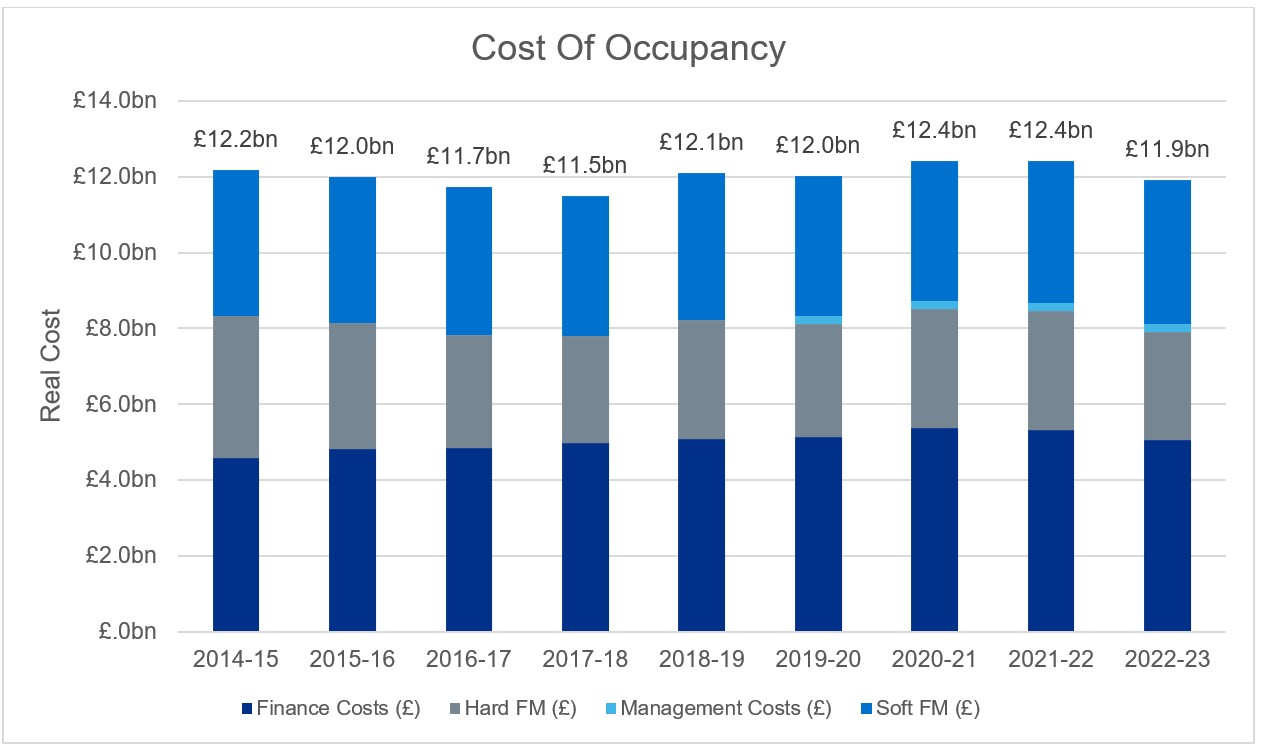
Figure 2b: cost of occupancy (in real terms) across all NHS trusts, relative to the cost of occupancy reported in 2014/15
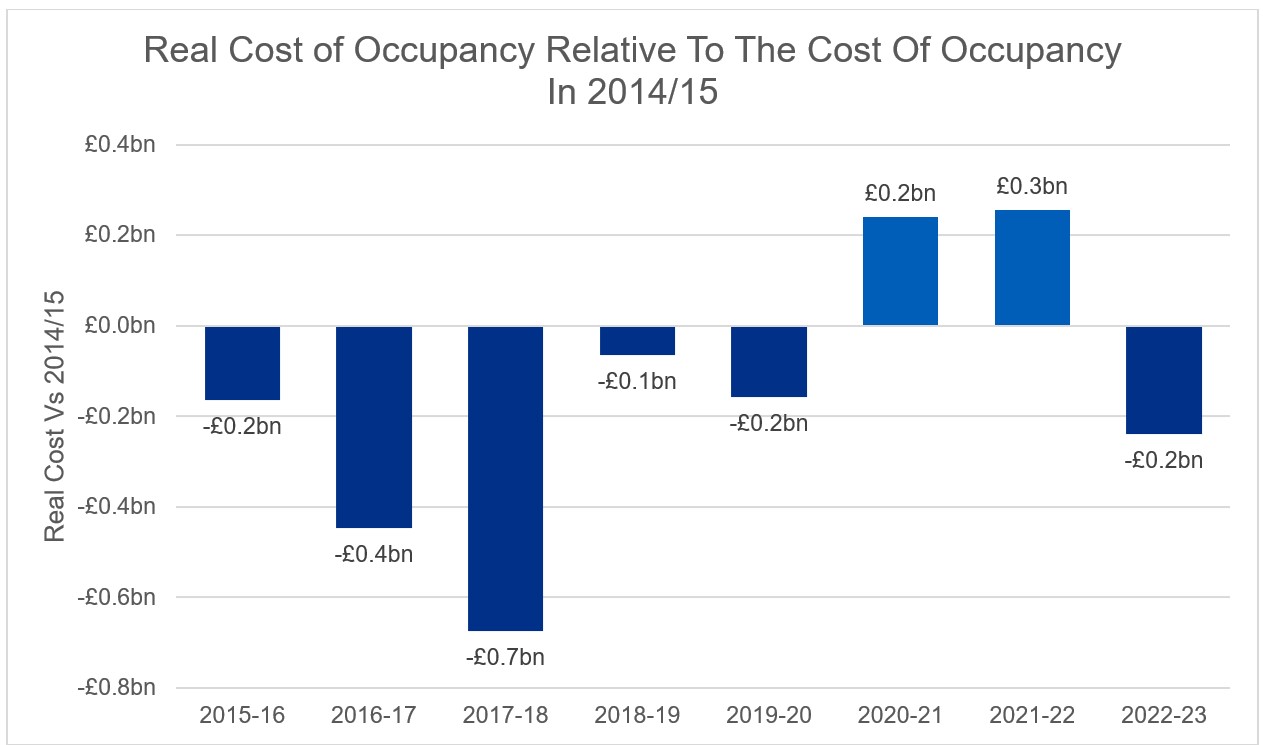
Figure 2c: cost of occupancy (in real terms) per attendance across all NHS trusts (without adjustments offsetting cost contributions)
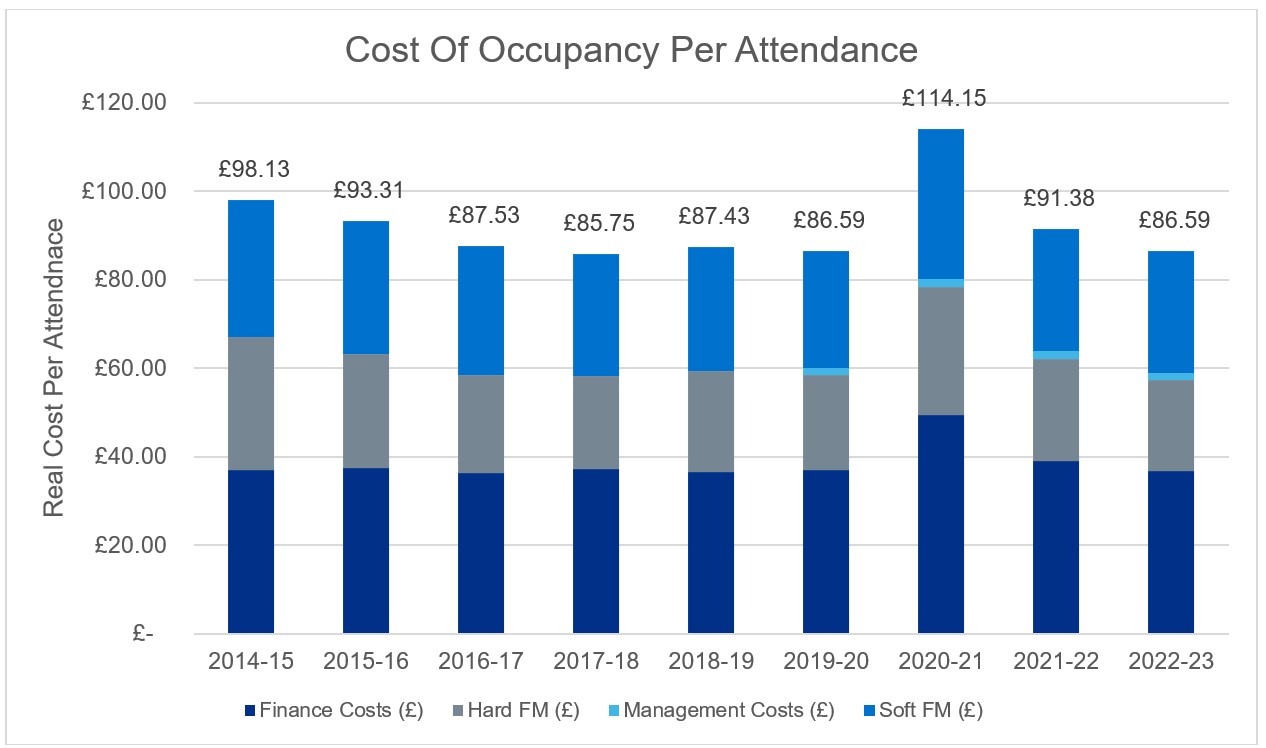
Note: 2014/15 and 2015/16 are assumed to have contributions to costs offset. The real cost may have been higher than indicated. In 2014/15, the reported contributions to cost, and assumed to be offset against the reported figure, equated to a real cost per attendance of £3.18.
Operational costs absorbed
1. Based on 137.7 million attendances in 2022/23 (and a saving of £14.72 per attendance) this equates to an efficiency saving of £2 billion in real terms for 2022/23. This exceeds the proposed £1.275 billion of efficiency savings (adjusted to £1.9 billion in real terms).
2. Thus, if trusts were operating as they were in 2014/15, the cost of occupancy in 2022/23 of £11.9 billion (excluding Electro-biomedical engineering (EBME)) based on 137.7 million attendances would be closer to £13.9 billion.
3. Various uncontrollable factors, such as finance costs, impact the cost of occupancy along with how trusts operationally utilise their estate year on year. This makes the efficiency savings in real terms a significant achievement that all NHS teams should be proud of, particularly when put in contrast to the number of patients seen in that period increasing by 11% since 2014/15.
4. The impact of estates and facilities management teams on the cost of occupancy of secondary care estates, when we conduct a like-for-like comparison of the 2014/15 vs. 2022/23 data, can be valued at £2.24 billion. This includes an actual cost saving of £0.24 billion and efficiency savings of £2 billion.
5. The cost of occupancy of the 2014/15 estate, based on current inflation and patient attendance, would be in the region of £14.4 billion compared to the £11.9 billion (excluding EBME) reported in 2022/23.
6. This would indicate the estates and facilities management community contribution equating to a 17% or £16 per attendance saving compared to reported values in 2022/23.
Soft facilities management
1. As mentioned, patient activity through the NHS estate was increasing prior to COVID-19 and following a sharp drop in attendance during 2020/21, activity has continued to rise back towards pre-COVID levels. Soft facilities management costs (in real terms – Figure 5) have remained relatively constant over the years under review (it is not possible to directly compare to 2014/15 as management costs were recorded differently and it is not possible to disaggregate them).
2. Food inflation has resulted in nominal costs increasing by 8% over the last year by £0.38 per inpatient meal. Taking inflation into account the real food costs per meal have steadily increased since 2014/15 from £4.72 to £5.41.
3. Since the outlier year of 2020/21, which included the impact of COVID-19, the cost per meal has declined over the last two years from £6.04 to £5.41. However, in real terms, there has been an increase in the cost per meal by 15% (£4.72 to £5.41). This increase can be partly attributed to several factors, including a clearer definition of what costs should be included and the introduction of new national standards for food and drink in November 2022. These standards state that healthcare organisations have a responsibility to provide the highest quality of care, which encompasses the quality, nutritional value, and sustainability of the food and drink they serve.
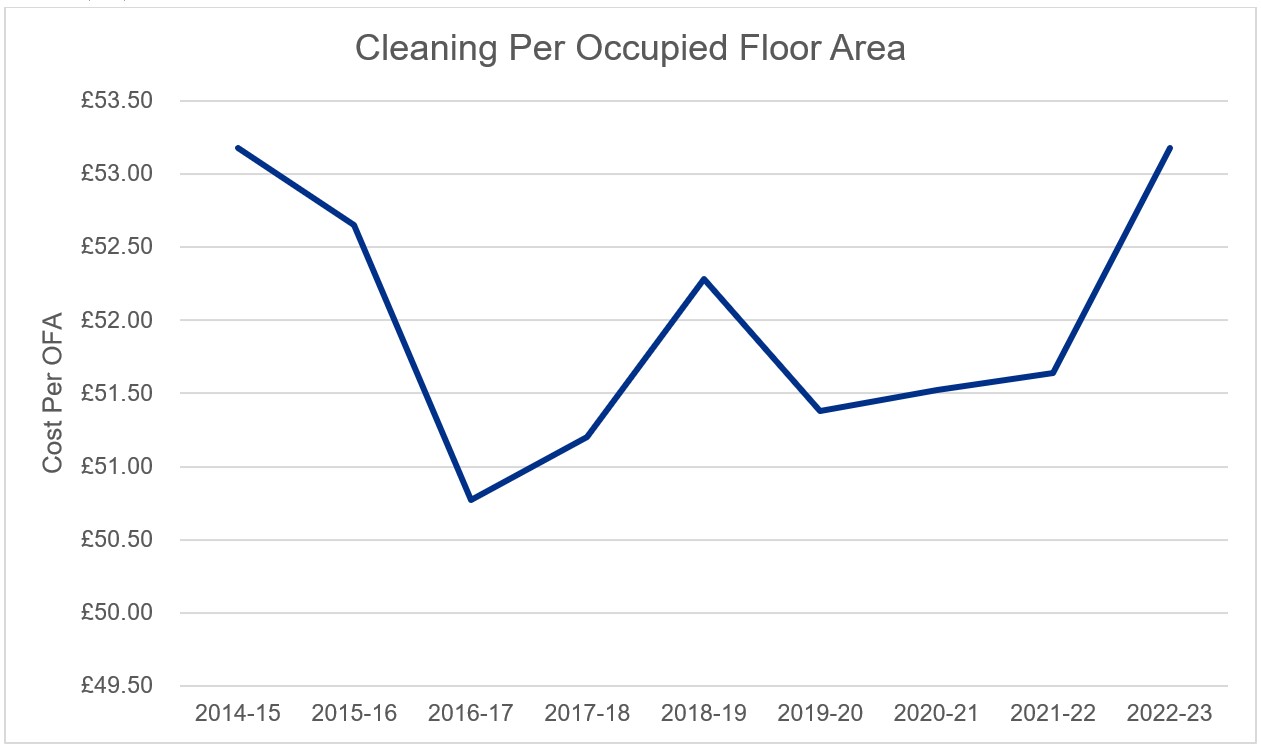
4. Cleaning costs per occupied floor area have fluctuated since 2014/15, remaining relatively constant between 2019/20 and 2021/22, with a median national value of £51.52 per OFA. However, in 2022/23, there was a 3% increase in cost per occupied floor area. This can be attributed in part to the increase in attendance. While a material increase in cost per square meter was not observed in 2021/22, which saw the largest increase in attendance, 2022/23 was the first full year with business as usual activity. This increase also coincides with the introduction of new cleaning standards, which all trusts (excluding ambulance trusts) were required to comply with from November 2022. Although the standards were deemed not to have a cost impact, the increase could be partly attributable to them. However, there is not enough evidence to definitively determine the cause.
Figure 3: real soft facilities management costs
Real soft facilities management costs in billions of pounds across NHS trusts, and associated cost of inpatient real food cost per meal, laundry and linen real cost per item, real portering cost per attendance and real cleaning cost per occupied floor area., and associated cost of inpatient real food cost per meal, laundry and linen real cost per item, real portering cost per attendance and real cleaning cost per occupied floor area.
Figure 3a: breakdown of soft facilities management services real costs
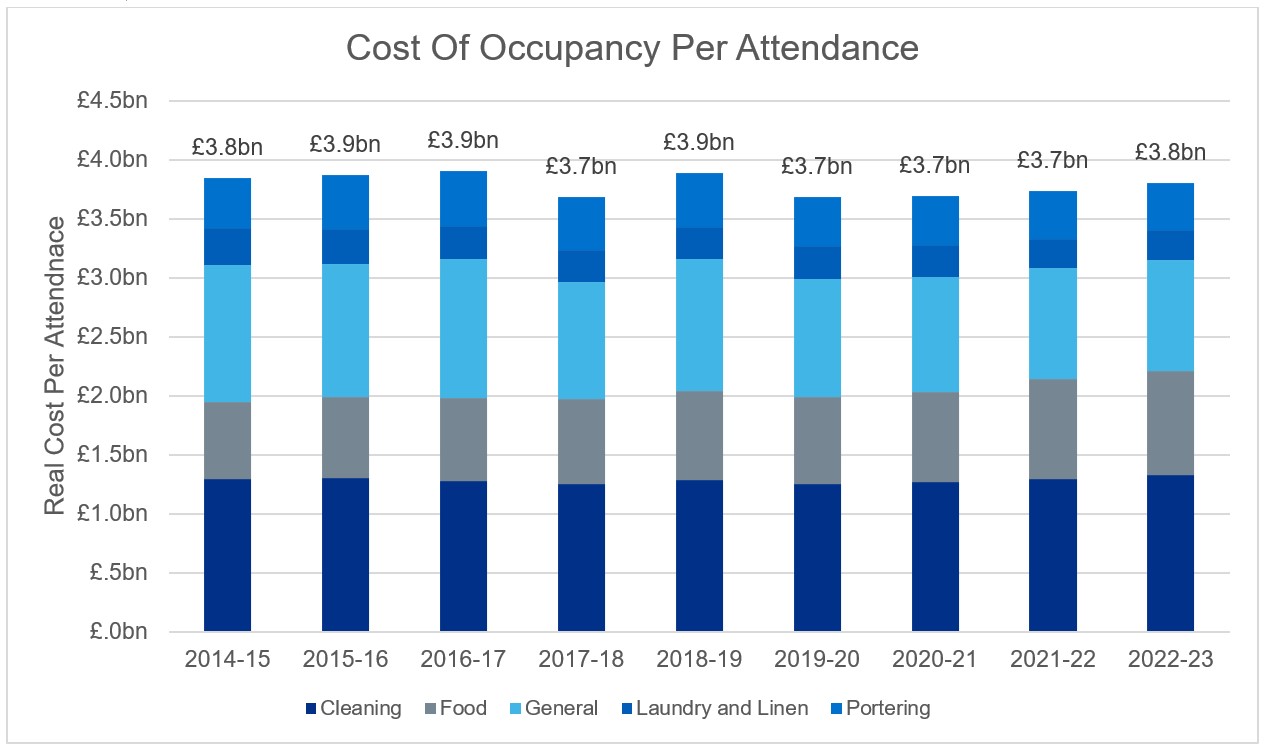
Figure 3b: real cost of food (per meal)
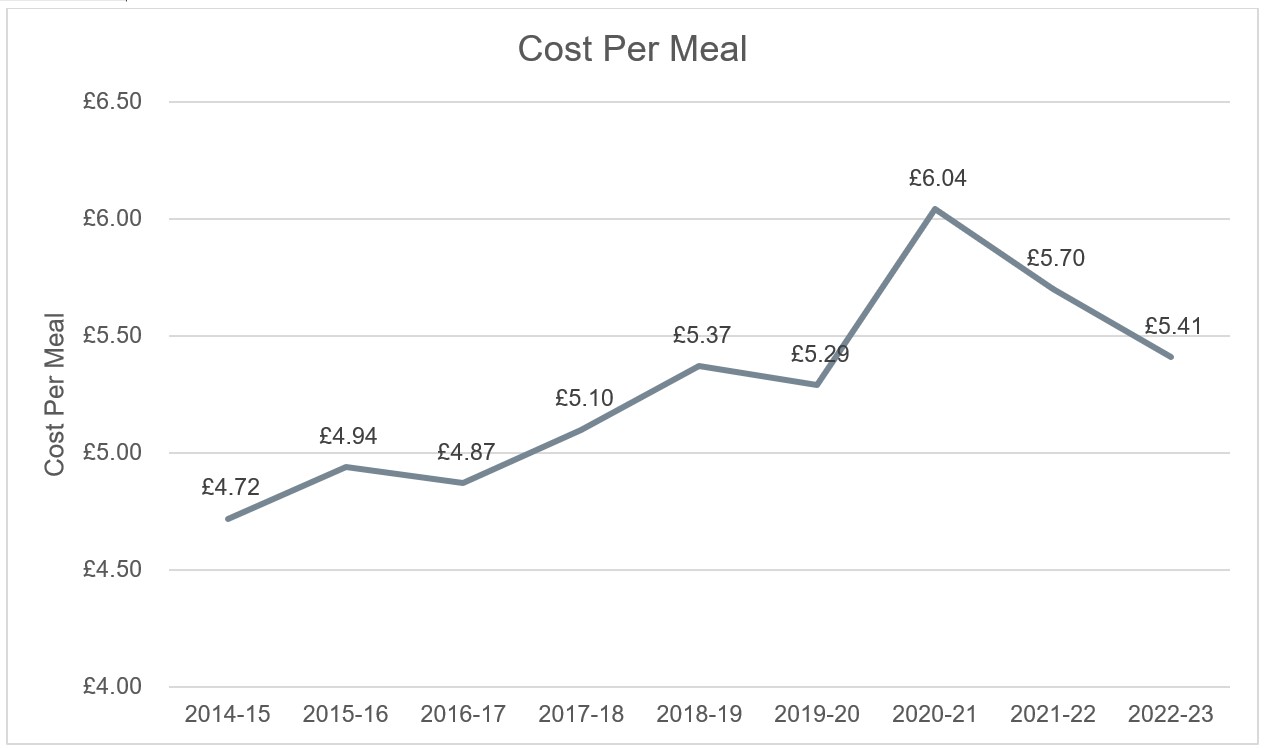
Figure 3c: real cost of laundry and linen (per piece)
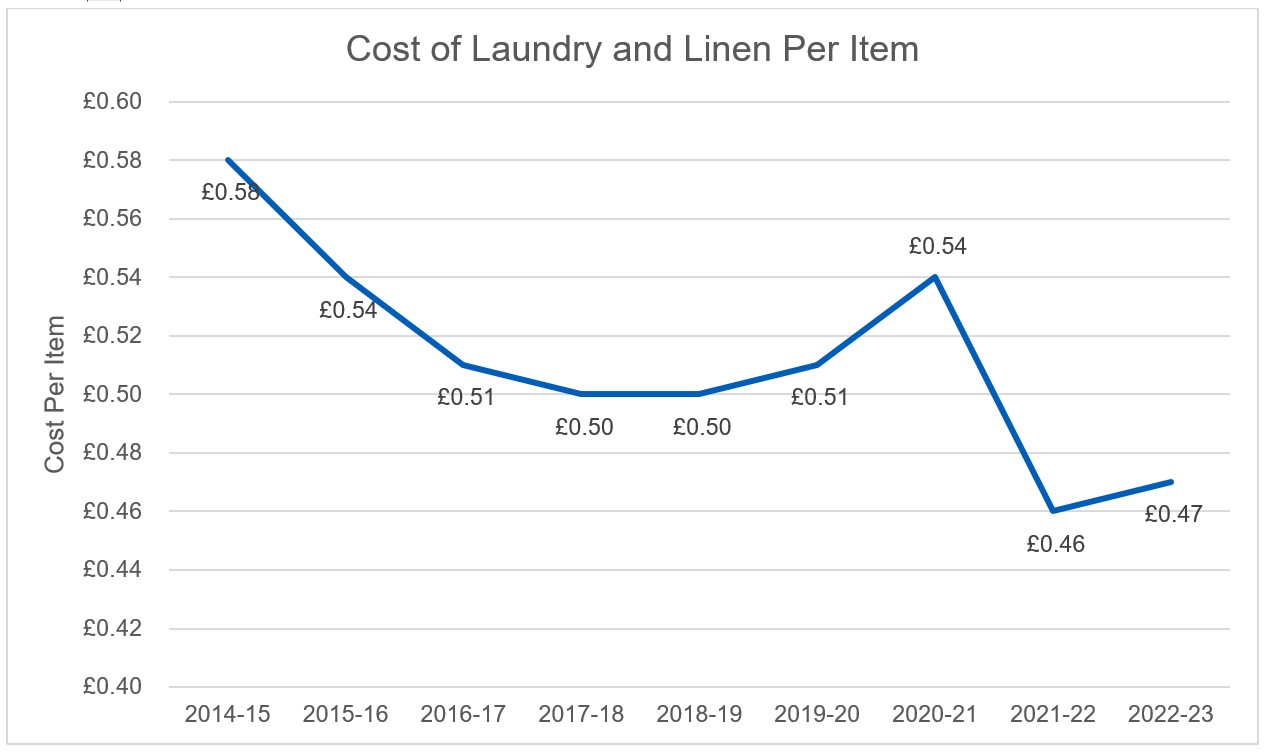
Figure 3d: real cost of portering (per attendance)
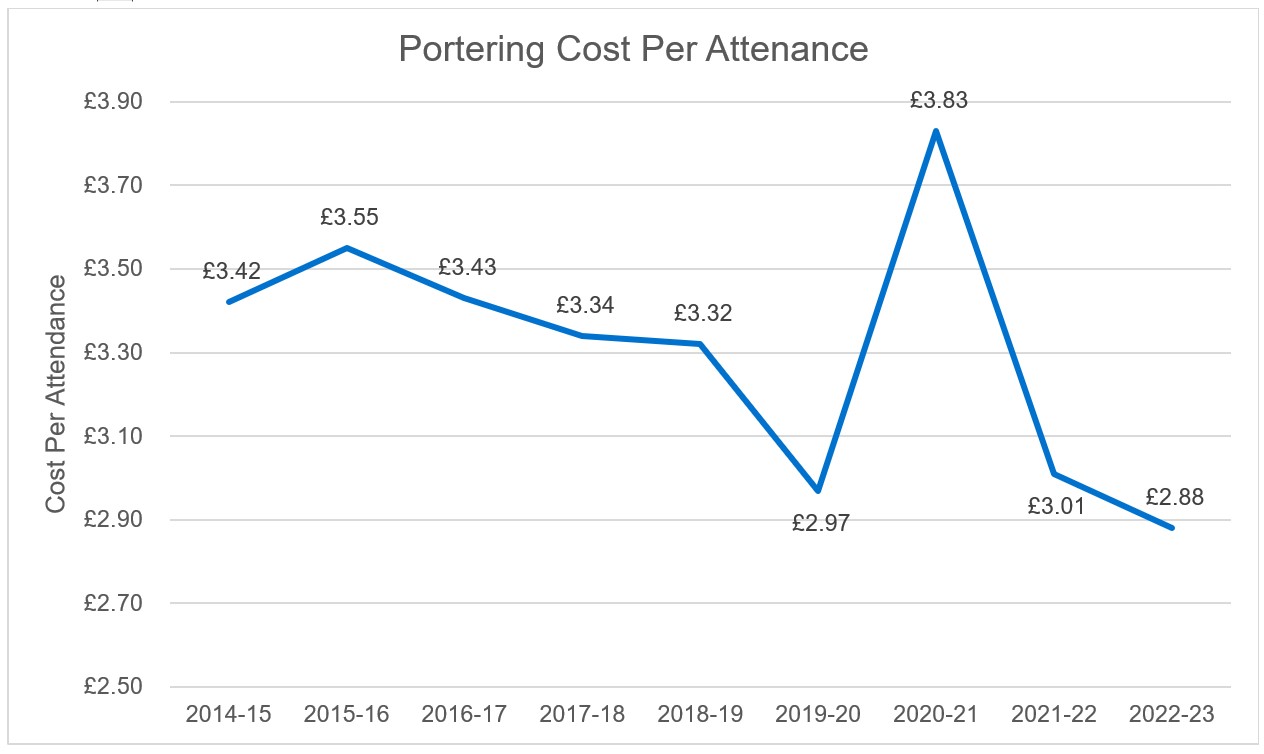
Figure 3e: real cost of cleaning (per occupied floor area)
Energy use
Summary
The Carter report emphasised the need to invest in energy saving schemes. Since 2018/19 over 1,850 energy efficient trust schemes have been delivered, and an additional 81 combined heat and power (CHP) units have been installed since 2014/15. As of 2022/23 the final coal heating system has been removed.
Energy use
1. The NHS has committed to becoming net zero in its estate by 2040, with an 80% reduction in emissions by 2032. Since 2019/20, over 1,850 energy efficient schemes have been implemented since; 420 of which were reported in 2022/23. The NHS has deployed in the region of £90M in additional funding for LED lighting, which has increased coverage from 42% to 47%, 60% of NHS organisations have an energy manager and 34% have a heat decarbonisation plan for all their sites. Total energy use has dropped significantly by 0.27 billion kilowatt hours (kWh) since 2014/15, and the usage in 2022/23 was the lowest reported since 2018/19 (Figure 6a). Electricity use has dropped by 0.58 billion kWh since 2014/15, which is enough to power 165,000 homes annually.
2. In line with net zero by 2040, trusts are looking to move away from the most pollutant energy sources shifting to renewable sources. In 2022/23 the final coal heating system was removed, and energy sourced from oil has been reduced by 58 billion kWh since 2014/15. Additionally, in 2022/23 over 62% of electricity consumed was reported to be from green sources, of which 0.7% was from solar.
3. Following the recommendation in the Carter report, the number of combined heat and power (CHP) units installed has risen by 81, an increase of 57% (Figure 4b). In 2022/23 a reported 3.3 billion kWh of thermal and electrical energy were consumed on sites, produced by CHP units. While CHP units significantly contribute to the net zero goal by efficiently generating both electricity and heat, thereby reducing overall carbon emissions. Current delivery plans advocate a transition away from fossil fuels and, while CHP have saved cost and carbon in the past, they lock the NHS into a high-carbon energy source that could impact the net zero target. Trusts are expected to transition away to other technologies such as heat pumps as CHPs reach their end of life.
4. While trusts have been driving down their energy usage, energy inflation has been making headlines, and similarly to households around the UK, NHS trusts have seen a stark increase in their bills. Over the last 2 years (2020/21 to 2022/23), nominal energy costs across the estate have increased by 85%, with the nominal cost of gas to the estate more than doubling. The nominal cost of electricity has also increased by 60% during this time. With electricity and gas making up 94% of the total energy bill in 2022/23, it will be imperative for estates to continue in their efforts to drive towards lower energy usage across the estate. The NHS has work in partnership with Crown Commercial Services (CCS) to develop an NHS-specific energy agreement under the CCS framework, ‘Supply of Energy 2.’ The energy basket will mirror the existing CCS ‘V30 basket’, which is an energy agreement that currently enables public sector customers to purchase energy utilising public sector trading best practice.
5. The importance of obtaining high-quality energy and waste data has led to an enhanced validation stage added to the validation process focussing on these metrics, highlighting and reporting back to trust inaccuracies in their data before publication.
Figure 4: NHS trusts’ sources of energy
Figures 4a and 4b show energy usage (kWh) by energy source, as reported in ERIC returns. Figure 4c shows the number of combined heat and power (CHP) units reported across all NHS trusts.
Figure 4a: Contribution of electricity and gas to NHS trusts energy use (in kWh)
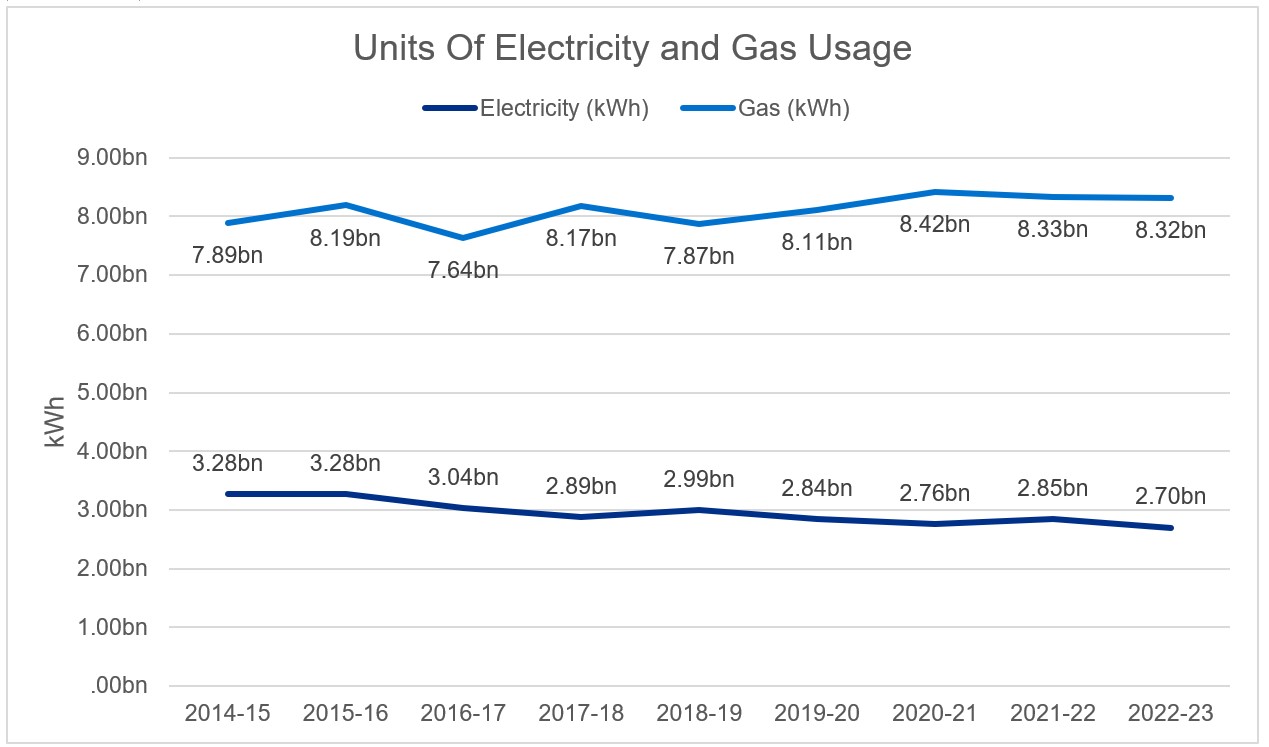
Figure 4b: Contribution of other energy sources to NHS trusts energy use (in kWh)
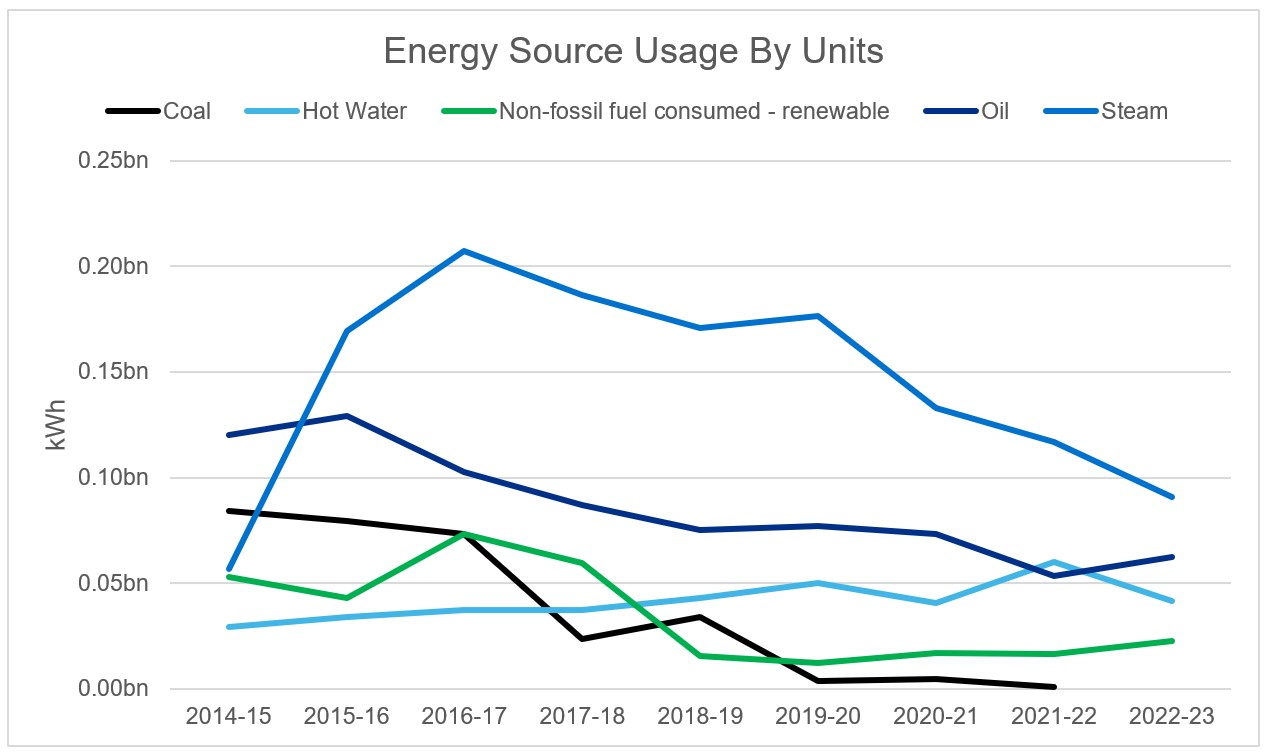
Figure 4c: Number of combined heat and power (CHP) units across all NHS trusts
Space utilisation
Summary
The Carter report outlined space utilisation targets for the NHS estate, including less than 2.5% of occupied floor area to be under-utilised space and less than 35% to be utilised for non-clinical purposes. In 2022/23 under-utilised space was reported at 1.9%, and non-clinical space was 33% of all NHS estate.
The reduction in underutilised space since 2015/16 has amounted to 225,000 square meters, the equivalent to two large general acute hospitals.
As costs are collected at an aggregate level for clinical and non-clinical areas, it is currently not possible to quantify the cost impact of clinical and non-clinical space. The complexity of the estate does not allow for accurate modelling based on current reported data.
Non-clinical and clinical space
1. NHS estate-occupied floor area is utilised by both clinical and non-clinical services. Occupied floor area associated with clinical services includes all clinical departments, pathology, clinical sterile services department, and private patients. Reported clinical space has increased by 26% from 2014/15 to 2022/23 (excluding ambulance trusts).
2. Comparatively, non-clinical space has reduced by 19% since publication of the Carter report (excluding ambulance trusts). Rationalising non-clinical space is core to ensuring an efficient estate. Since 2014/15 over 1.85 million square meters of non-clinical occupied floor area has been removed from the estate portfolio. A move to hybrid working following COVID-19, and the continued digitisation of medical records will help to continue this reduction (between 2017/18 and 2022/23 space used to store medical records was reduced by 18%).
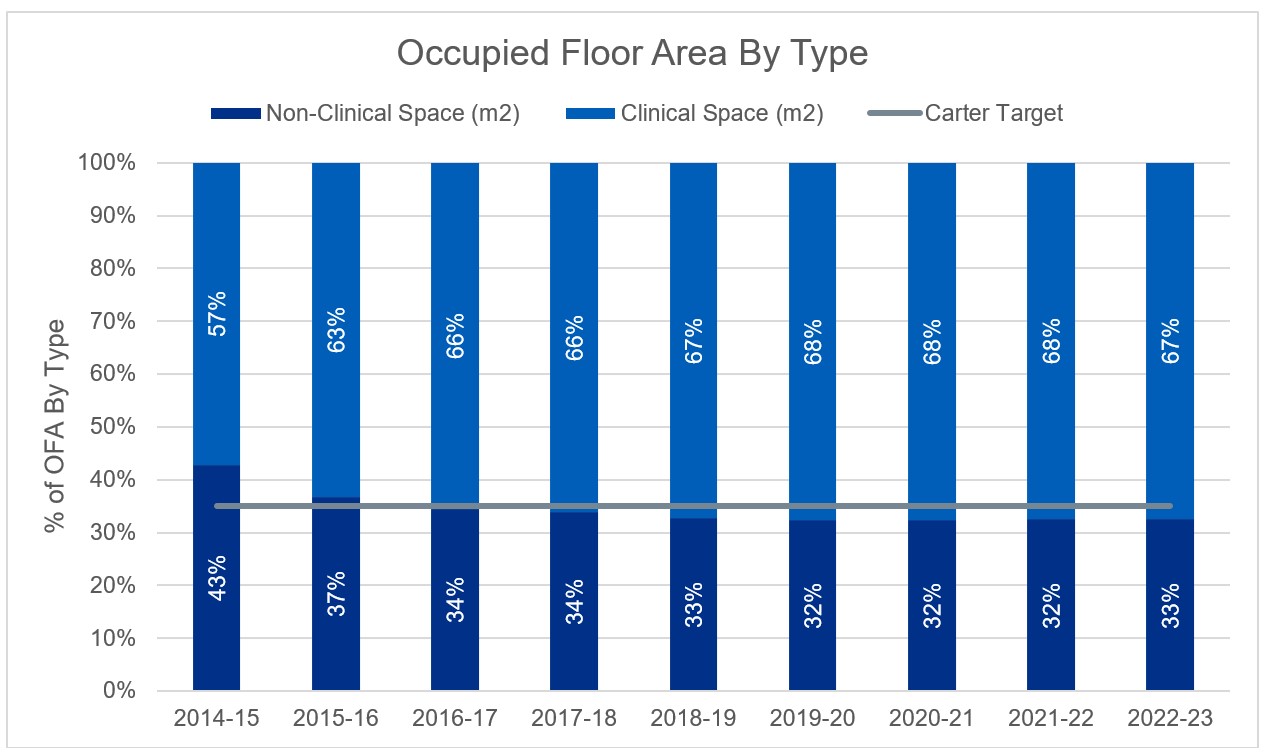
3. The proportion of non-clinical occupied floor area (including retail and excluding ambulance trusts* has decreased from an average of 43% in 2014/15 to 33% in 2022/23. This meets the recommended maximum threshold of 35% across all estates as laid out in the Carter report.
* Ambulance trusts excluded as all occupied floor area associated with ambulance trusts is considered non-clinical.
4. An additional 52 trusts (excl. ambulance trusts) have reduced their non-clinical space and rationalised their estate to report below 35% non-clinical occupied floor area in 2022/23, with 64% of trusts now meeting the threshold compared to 33% of trusts in 2014/15 (see Utilisation of estate section). This is measured at the trust aggregate level.
5. It is assumed some of this non-clinical space has been repurposed into clinical space, which has increased by 3.4 million square meters from 13.2 million square meters in 2014/15 to 16.6 million square meters in 2022/23. The increase in clinical space is the equivalent to 34 general acute hospitals, this has enabled trusts to absorb the 11% increase in patient attendance while only increasing their size by 3%.
Figure 5: Proportion of floor area used for clinical and non-clinical activity
Percentages of occupied floor area associated with clinical and non-clinical activity between 2014/15 and 2022/23. Ambulance trusts are excluded.
Under-utilised space
1. Under-utilised space is defined as areas where utilisation could be significantly increased, with more potential than is currently being realised. This is calculated in line with the Land and Property Appraisal guidance. In 2022/23, under-utilised space accounted for 1.9% of the total occupied floor area across the whole NHS estate. This is lower than the target threshold of 2.5% in the Carter report.
2. Although at a national level, the threshold is met, the number of trusts meeting this target has decreased by 2 trusts. This is, in part, due to changes in coding, so the definition of each trust has changed over the time period.
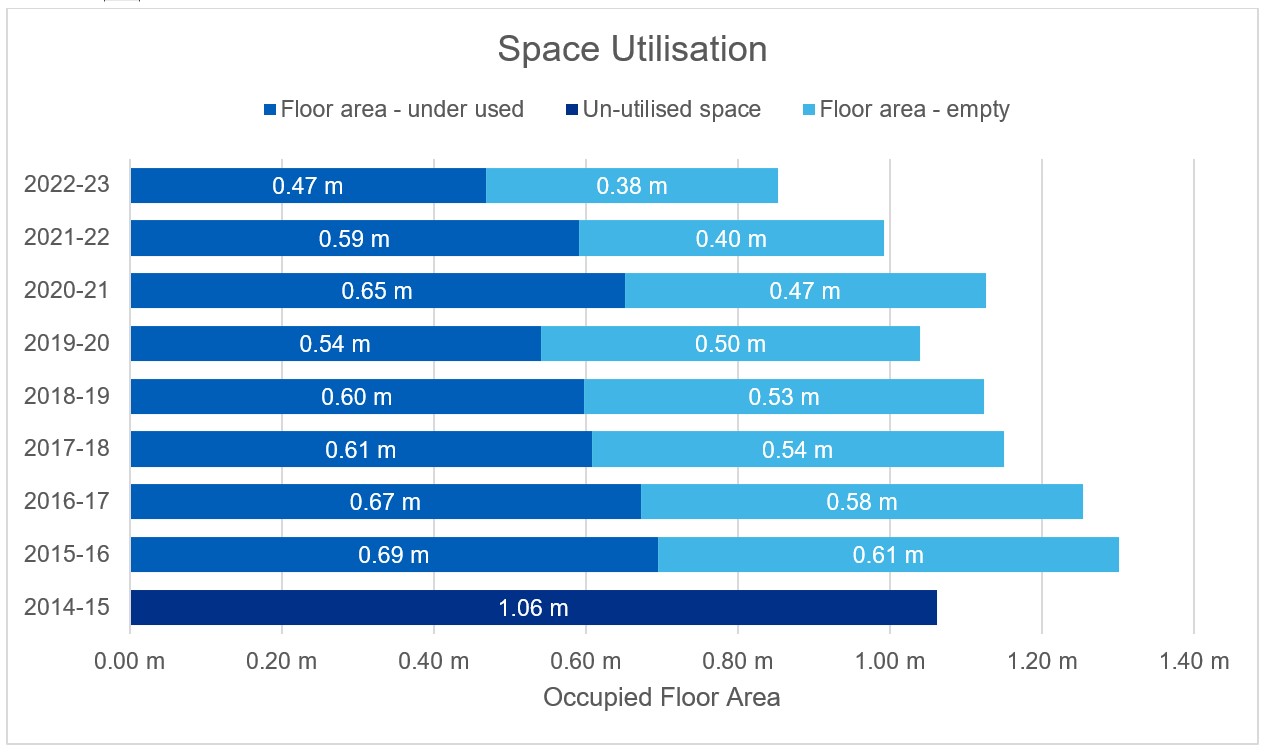
3. Under-utilised occupied floor area (incl. empty and under-utilised space) has decreased by 20% from 2014/15 to 2022/23 across all estates (1.06 million square meters to 0.85 million square meters). This shows the commitment of estate teams to rationalise their under-utilised estate, maximising efficiency to deliver patient services.
Figure 6: Amount of under-utilised and unutilised space
Figure 6a shows the proportion of occupied floor area that was under-utilised between 2014/15 and 2022/23. Figure 6b shows the amount of under-utilised or empty space in square meters.
Figure 6a: Under-utilised occupied floor area as a percentage of total floor area
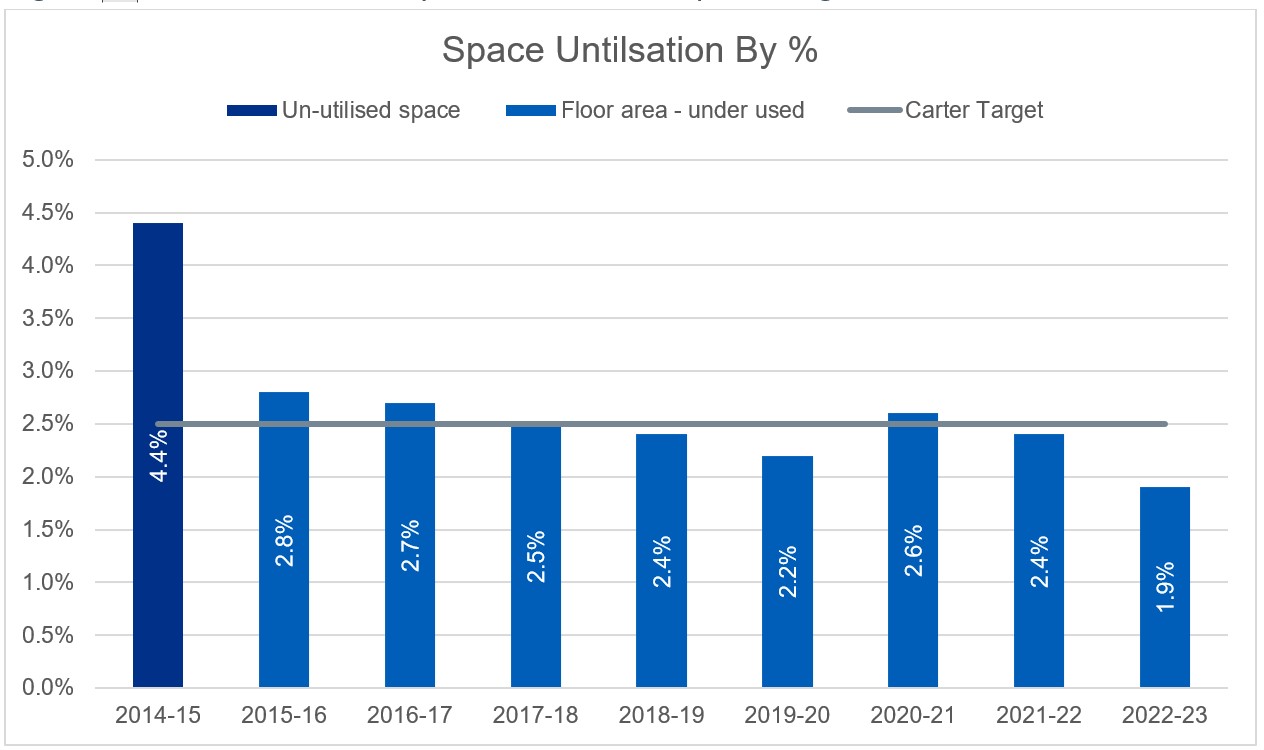
Figure 6b: Occupied floor area that was under-utilised or empty (in millions of square meters)
Data validation quality
Summary
The Carter report stressed the need to improve data accuracy in reporting. Since 2014/15, data fields have been given more explicit definitions and structured validation processes have been implemented.
Data validation and quality
1. The recommendations outlined in Lord Carter’s report emphasise the imperative for the Health and Social Care Information Centre (HSCIC), now integrated into NHS England, and trusts to increase data accuracy. This entails enhancing the governance structure surrounding ERIC
2. This has been implemented in a step-wise approach with in-system validations being increased and further out-of-system validation checks being implemented. The latter action has resulted in trusts receiving a bespoke report identifying metrics that have been raised as a result of the trust-submitted data failing analytical tests. Trusts have a 4-week period to review these reports and make the appropriate adjustments where they see fit.
3. The ERIC collection can only physically be submitted by the Director of estates (or equivalent person) on behalf of the trust’s Chief Executive Officer (implemented in 2022/23). Although the responsibility of data quality remains with the trust, the national NHS team will continue to help trusts with identifying potential errors and spread learning throughout the service as part of continuous improvement.
4. The details behind the validation process can be found in the Appendix C.
Appendix A: fields included in ERIC
Figure 7: What fields were included in the Estates Returns Information Collection (ERIC) between 2014/15 and 2022/23?
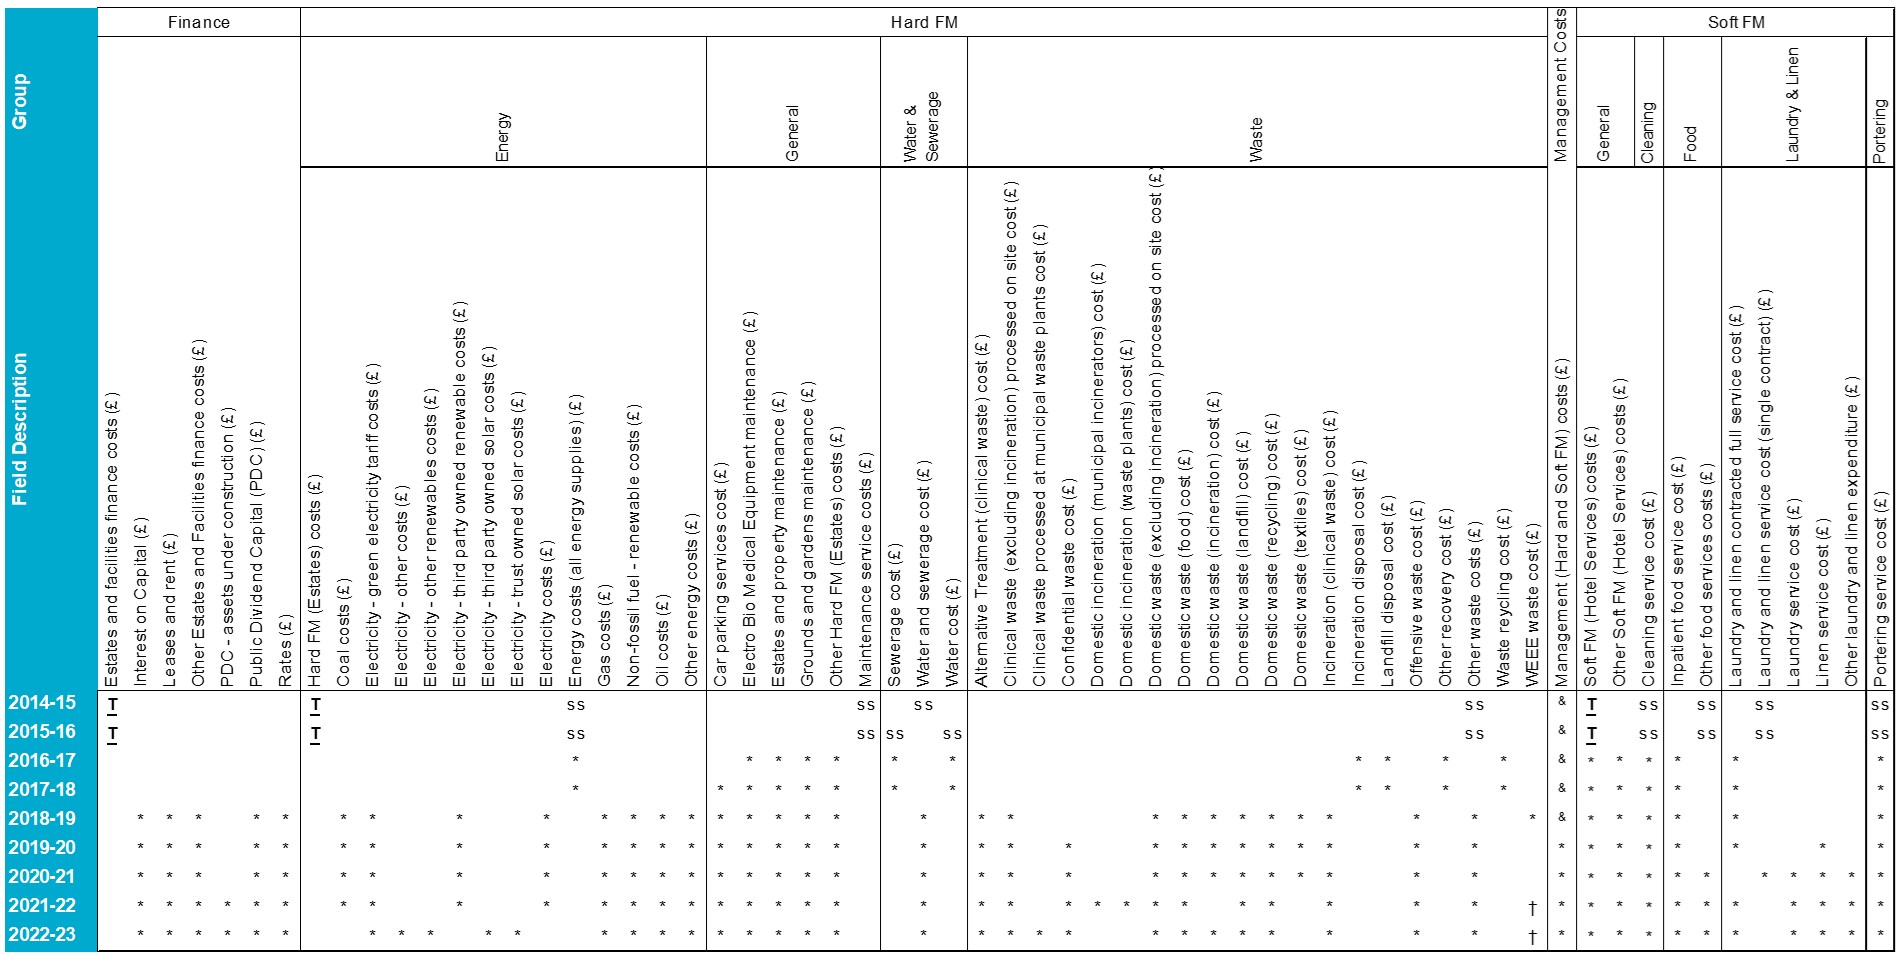
ss Additional information is provided, as a subset of the total figure for the site. Note that for 593 out of 1055 sites (across 159 trusts) in 2014/15 and for 473 out of 1028 sites (across 141 trusts) in 2015/16, the total sum of all subsets was greater than the total value provided.
† Value available at trust level only
& Previously included in hard facilities management and soft facilities management total costs reported
Appendix B: supplementary ERIC analyses
Figure 8: Variation in estate utilisation across all trusts
Figure 8a: Differences in the proportion of underutilised space between trusts
The variation in the percentages of underutilised occupied floor area between trusts from 2014/15 to 2022/23.
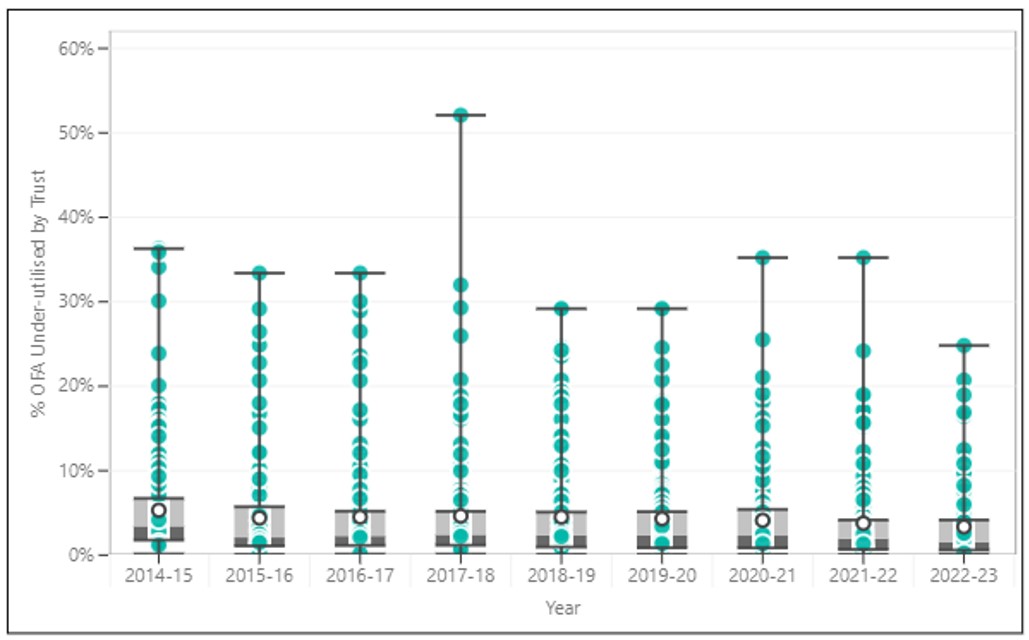
Figure 8b: Differences in the proportion of non-clinical space between trusts
The variation in the percentages of occupied floor area used for non-clinical services for each trust (excluding ambulance trusts)
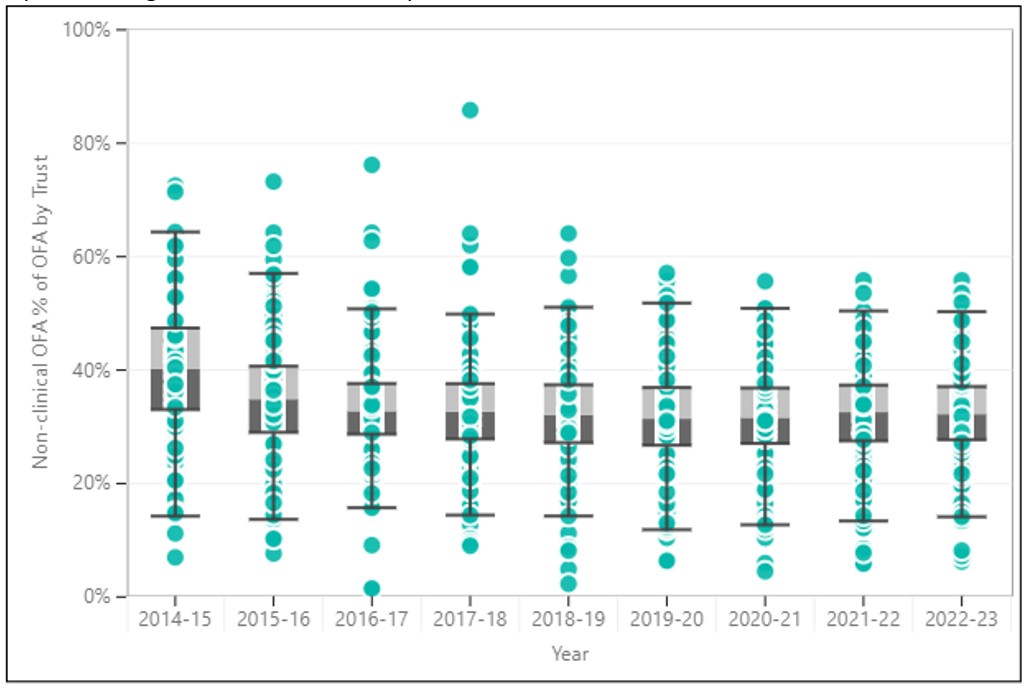
Figure 9: Real cost of occupancy across all NHS trusts normalised for occupied floor area
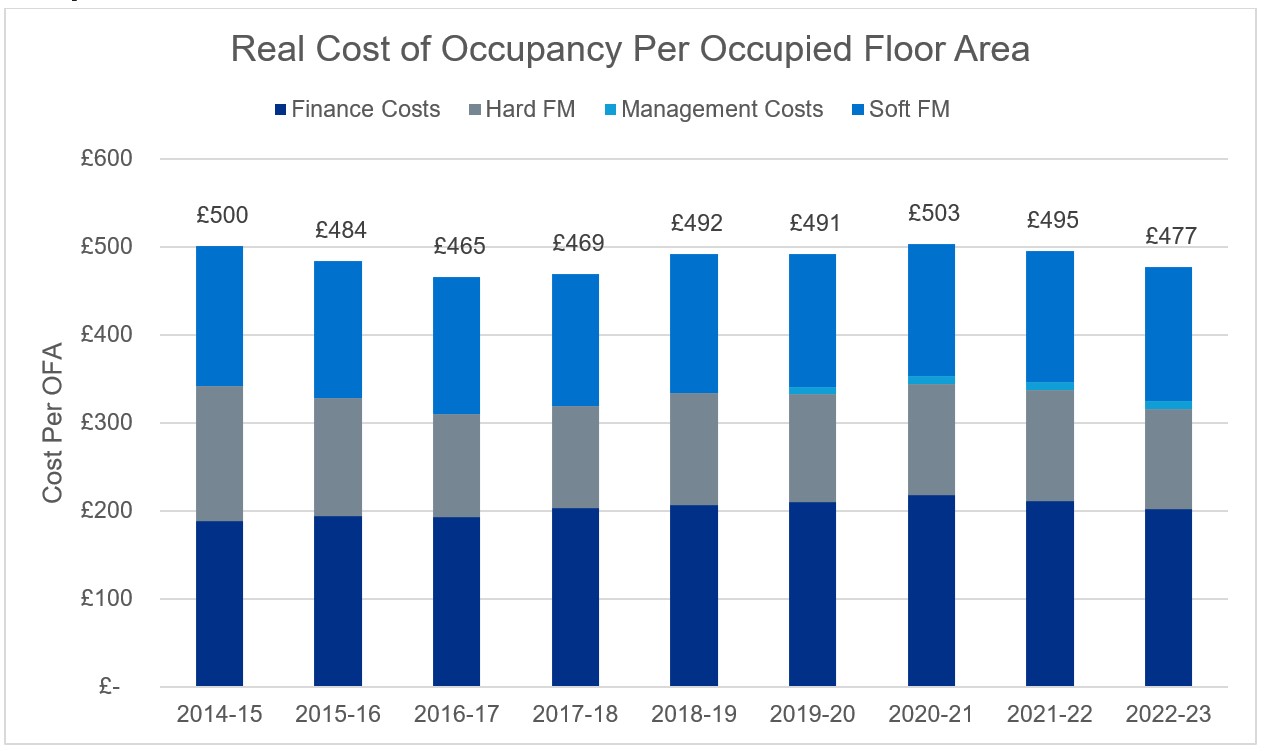
Figure 10: Breakdown of finance costs
Real finance costs have increased by £0.5 billion in total since 2014/15 and by £14 per occupied floor area (square meter).
Figure 10a: Real finance costs
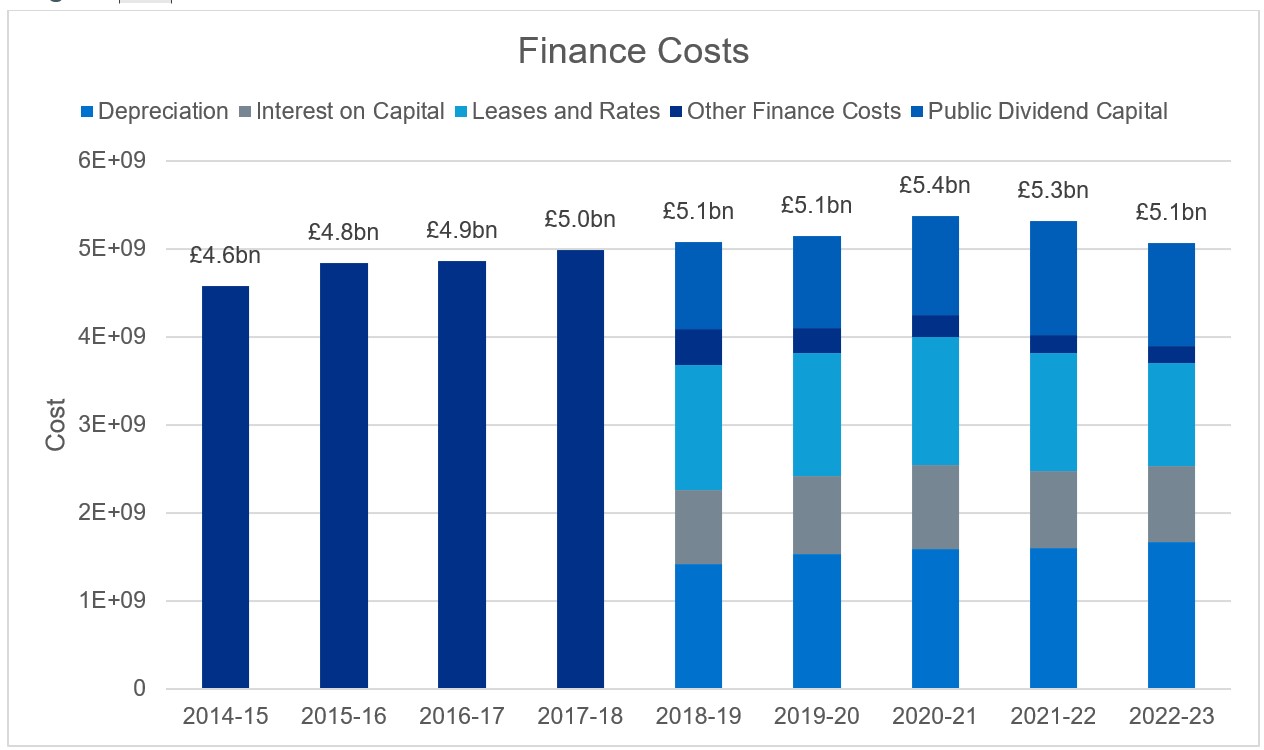
Figure 10b: Real finance costs per occupied floor area
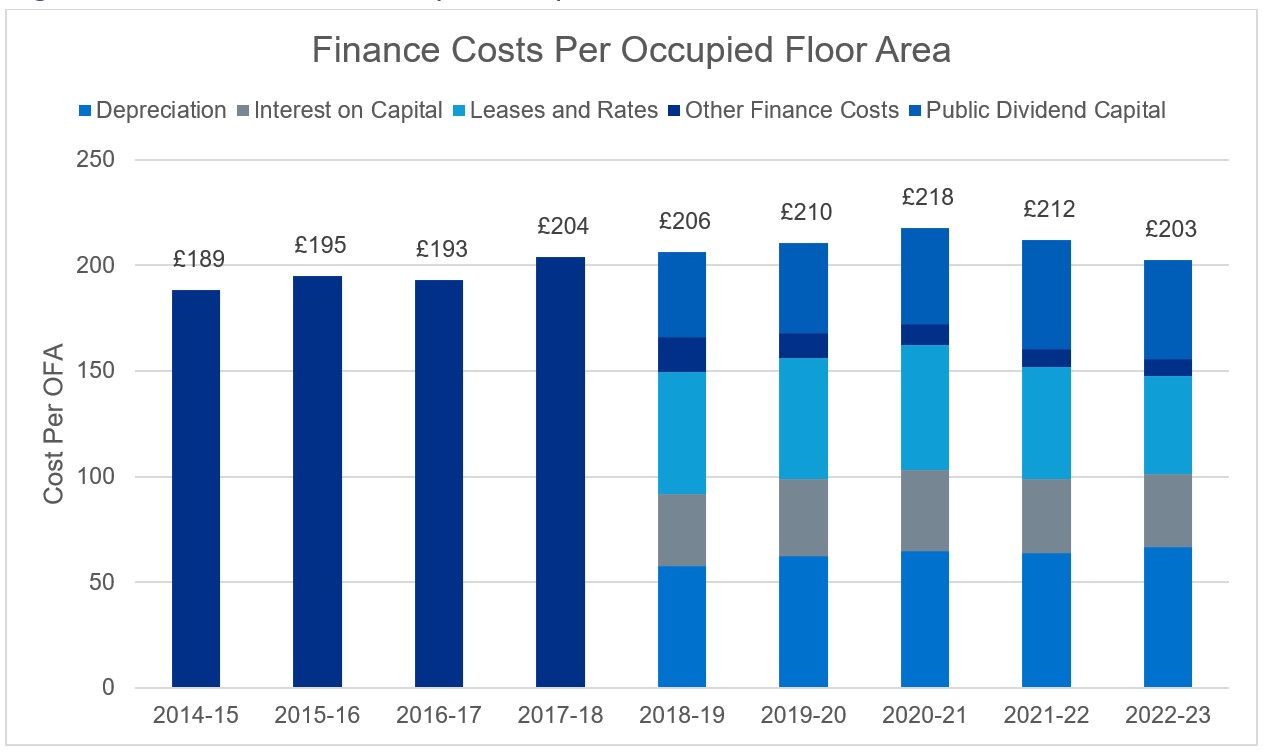
Figure 11: Hard facilities management costs
Hard facilities management costs have reduced, in real terms, by £0.9 billion since 2014/15 (excluding electro-biomedical engineering (EBME)). From 2019/20 the management costs include soft facilities management and hard facilities management, so the real costs for hard facilities management may be slightly lower than shown here.
Figure 11a: Breakdown of real hard facilities management costs
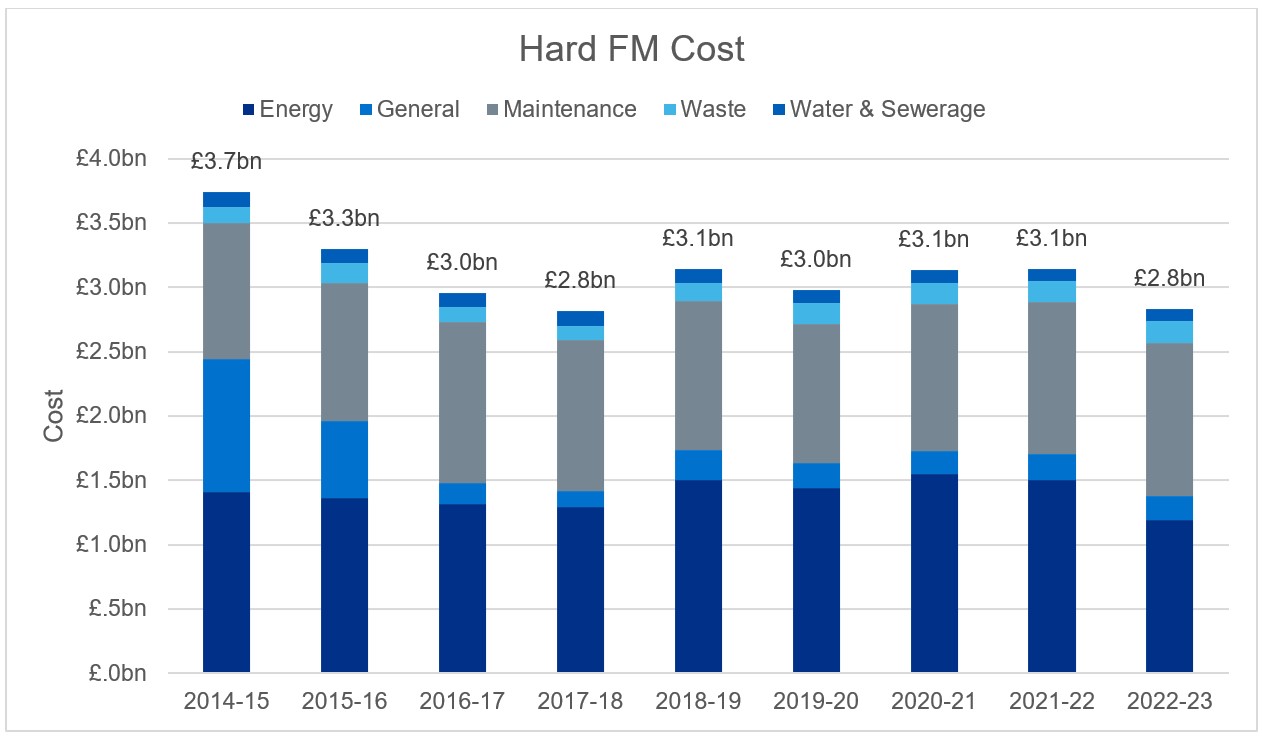
Figure 11b: Real hard facilities management costs per occupied floor area
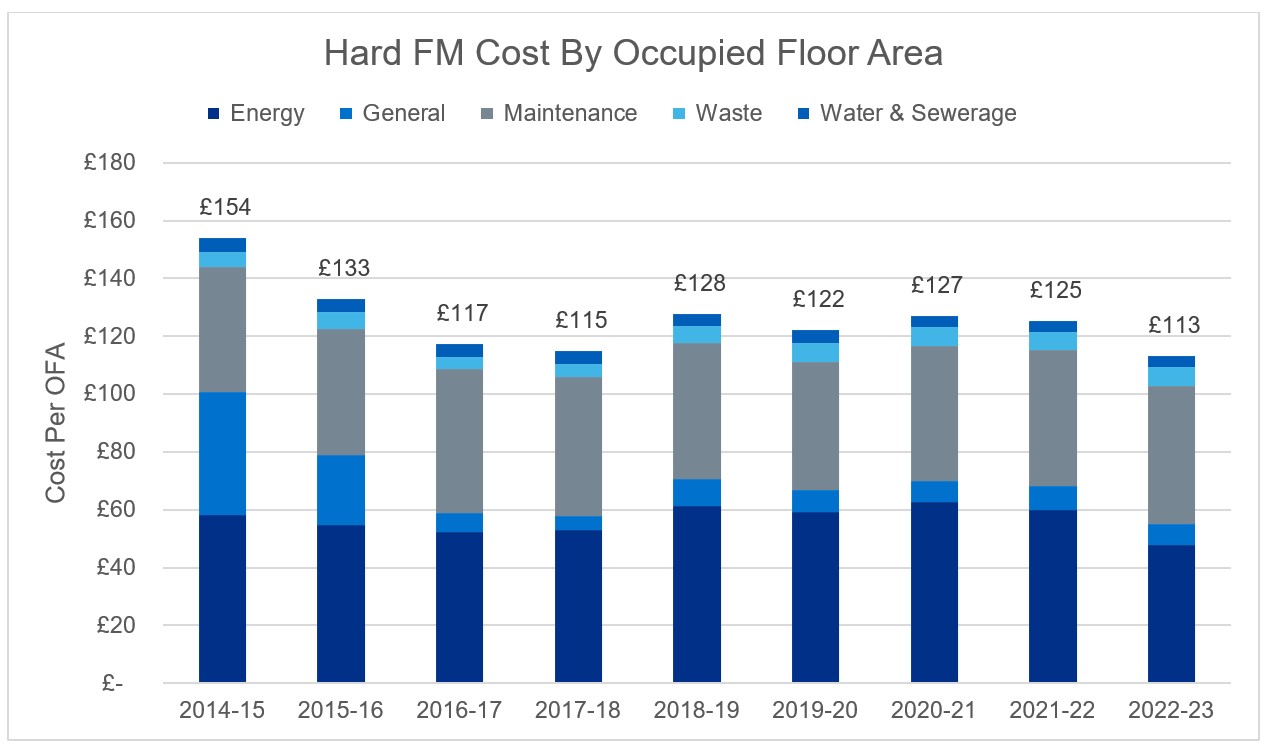
Figure 12: Food costs
The variation between sites in real food cost per meal (for sites that served more than 3,000 meals).
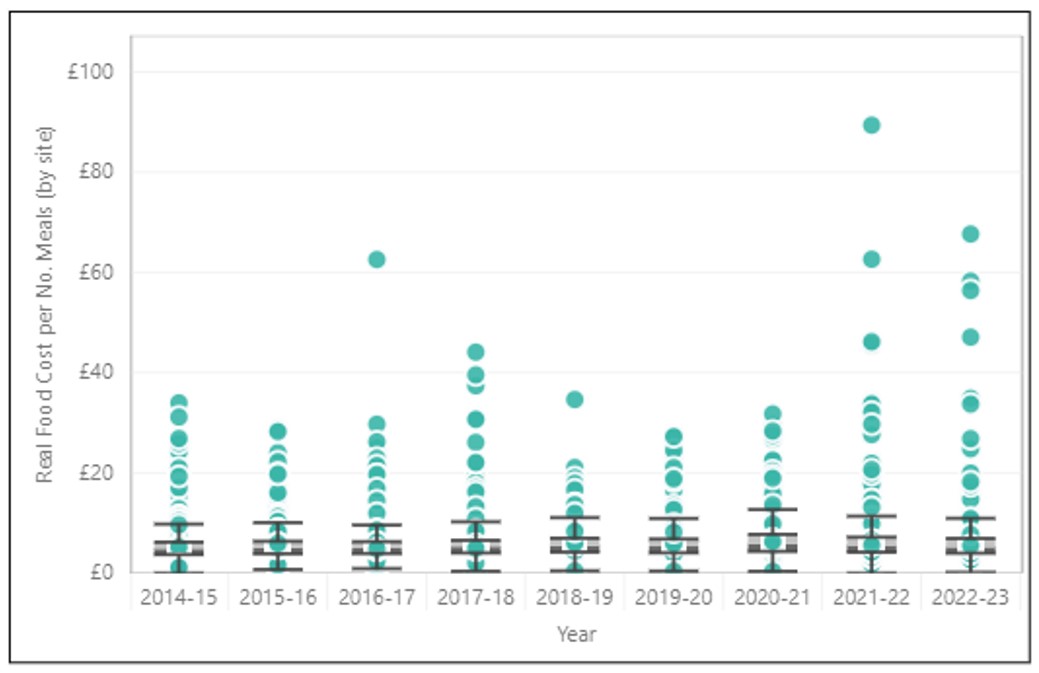
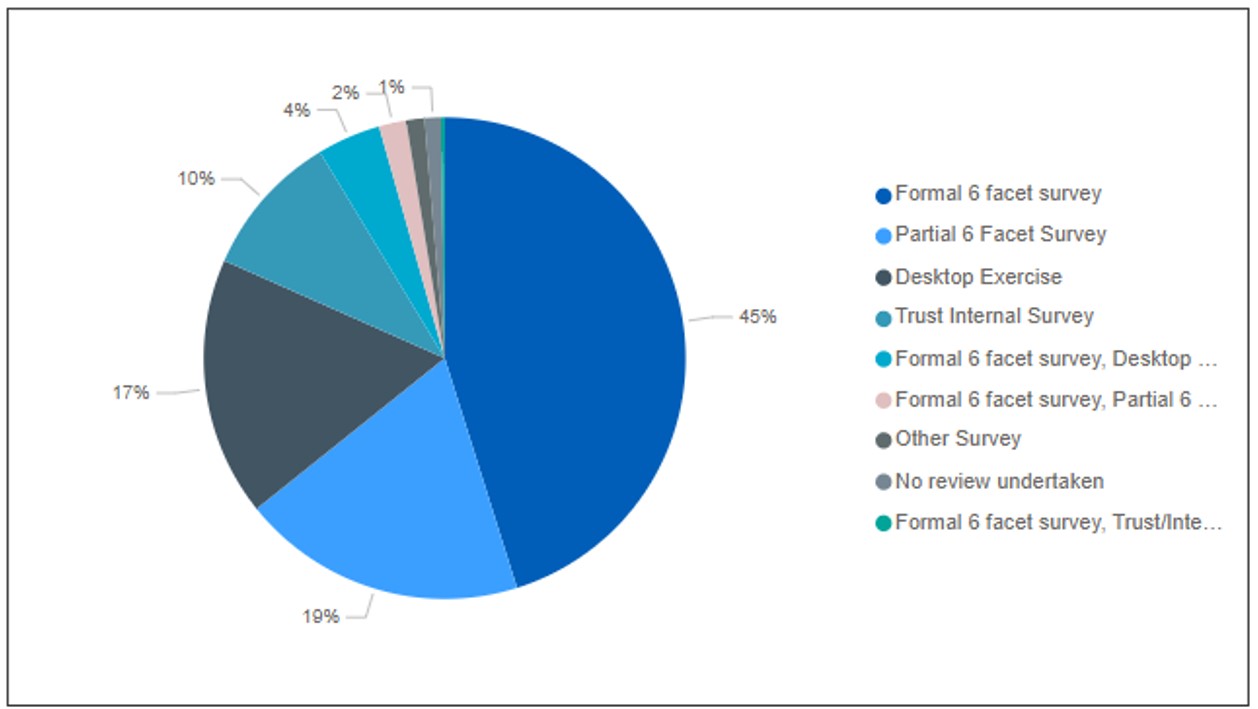
Figure 13: Backlog surveys undertaken
The proportion of each type of survey used by the site to report backlog in 2022/23.
Appendix C: ERIC validation
ERIC validation 22/23
In system validations (occurs as trusts populate information)
The EFM undertakes an in-system validation.
Metric dependant, where there is a 10%/15% movement from the prior year a validation comment is requested.
The validation comment has moved from a free text option which many trusts circumvented by entering a “.” of a space; to a selection from a drop-down list.
The list options are as follows:
- Error in the previous year’s data submission
- Data confirmed by the trust as correct
- Change in trust reporting methodology
- Change in service (e.g. contract or service provider, costs/fees)
- Change in usage of the site
- Improved accuracy in data reporting
Specific rules also apply in the system stopping certain data responses.
Submission: Can only be submitted by the Director or Estates or equivalent after they have declared they have reviewed the information.
Backlog maintenance (BLM): audit/enhanced validation (early data cut – 2 weeks onto collection)
Trusts submit selected BLM-related metrics collected within the collection.
NB: This is classified as RESTRICTED – Management information. Only available to colleagues on the pre-access approval list.
10 key BLM metrics are requested to be submitted by trusts before the end of May.
A sample of trusts selected based on:
- top 20 by largest BLM value
- top 20 by largest BLM increases from the prior year
- top 20 by largest BML decreases from the prior year
- no movement in BLM from the prior year
- top 20 by largest BLM increases from the prior year for individual site
Approximately 50 trusts were identified, based on different trust types and regions.
Trusts requested to complete an enhanced BLM questionnaire which will be scrutinised by the Capital and Commercial team with support from Strategic Estates Leads for error identification and resolution.
Aim: to review all trusts over a 5-year period.
Energy and waste: audit/enhanced validation (early data cut – 2 weeks onto collection)
Trusts submit selected key energy and waste metrics collected within the collection.
NB: This is classified as RESTRICTED – Management information. Only available to colleagues on the pre-access approval list.
Metrics identified for review based on 3 validation flags:
- Range Check (Flag 1): Flagged values based on Performance indicators (PI’s) (cost per unit) that are believed to be outside the plausible range for a specific metric.
- Movement Check (Flag 2): Flagged values are those that have increased or decreased significantly from last year’s submitted data, based on the data entered. To trigger the flag, a large % movement (+/-) and a large numerical movement must be observed versus all the other sites in ERIC for that specific metric.
- Outlier Check (Flag 3): Flags PI’s that are statistical outliers vs. the comparable PI’s in year. Values that are in the n percentile compared to other trust data. n will vary for differing PI’s
Trusts receive a bespoke report identifying metrics that failed validation tests to review and rectify.
Data submission
Summer validation (occurring since 2016/17)
This step occurs after the first submission.
Metrics identified for review based on 4 validation flags:
- Range Check (Flag 1): Flagged values based on PI’s that are believed to be outside the plausible range for a specific metric.
- Movement Check (Flag 2): Flagged values are those that have increased or decreased significantly from last year’s submitted data, based on the data entered. To trigger the flag, a large % movement (+/-) and a large numerical movement must be observed versus all the other sites in ERIC for that specific metric.
- Outlier Check (Flag 3): Flags PI’s that are statistical outliers vs. the comparable PI’s in year. Values that are in the nth percentile compared to other trust data. n will vary for differing PI’s.
- Bespoke Validation Check (Flag 4): Flags metrics based on responses to metrics or responses to a range of metrics. The flag text will give a brief description of why the validation has been raised
Trusts receive a bespoke report identifying metrics that failed validation tests to review and rectify
4-week period given to trusts to review and update information.
Material outlier trusts are contacted directly.
Submission: Data must be submitted again by the Director or Estates or equivalent after they have declared they have reviewed the information.
Note: Every single metric is not validated. Data quality ultimately remains the trust’s responsibility.
Post summer validation review (new for ERIC 22/23)
This step occurs after the final submission.
Review of BLM, energy and waste data for material outliers remaining.
Trusts engaged with by NHS England E&F team.
1-week window to update erroneous data.
The data submitted remains the trust’s data and should reflect what has occurred in the collection period.
Note: Data quality ultimately remains the trust’s responsibility
Appendix D: Inflation calculations
Table 3: inflation indices
| Inflation indices relative to 2023 | |||||||||
| 2014/15 | 2015/16 | 2016/17 | 2017/18 | 2018/19 | 2019/20 | 2020/21 | 2021/22 | 2022/23 | |
| Inflation index | 2015 | 2016 | 2017 | 2018 | 2019 | 2020 | 2021 | 2022 | 2023 |
| Electricity | 2.41 | 2.41 | 2.41 | 2.17 | 2.09 | 1.93 | 1.99 | 1.67 | 1.00 |
| Gas | 2.24 | 2.39 | 2.49 | 2.47 | 2.52 | 2.53 | 3.00 | 2.33 | 1.00 |
| Oil | 1.44 | 1.59 | 1.33 | 1.30 | 1.28 | 1.27 | 1.31 | 1.03 | 1.00 |
| Coal and solid fuels | 1.55 | 1.56 | 1.53 | 1.50 | 1.46 | 1.40 | 1.36 | 1.23 | 1.00 |
| Retail Price Index (RPI) | 1.42 | 1.40 | 1.36 | 1.31 | 1.28 | 1.25 | 1.23 | 1.14 | 1.00 |
| Food and catering RPI | 1.23 | 1.25 | 1.25 | 1.22 | 1.19 | 1.17 | 1.16 | 1.13 | 1.00 |
| Laundry Cost Index | 1.62 | 1.56 | 1.50 | 1.43 | 1.37 | 1.33 | 1.31 | 1.09 | 1.00 |
| Cleaning | 1.39 | 1.35 | 1.31 | 1.27 | 1.22 | 1.18 | 1.13 | 1.07 | 1.00 |
| Hard facilities management | 1.41 | 1.37 | 1.32 | 1.28 | 1.23 | 1.19 | 1.13 | 1.06 | 1.00 |
| NHS full-time equivalent pay inflation | 1.27 | 1.25 | 1.21 | 1.20 | 1.16 | 1.13 | 1.09 | 1.05 | 1.00 |
| Pay weighted RPI | 1.37 | 1.35 | 1.31 | 1.28 | 1.24 | 1.21 | 1.18 | 1.11 | 1.00 |
| Tender Price Index | 1.43 | 1.37 | 1.29 | 1.19 | 1.13 | 1.11 | 1.13 | 1.09 | 1.00 |
- For ERIC reports up to and including 2017/18, the total energy cost was reported with no breakdown. To define the proportion of total energy cost associated with each energy type in these years, the £/kWh from 2018/19 ERIC data (the first year with the breakdown of costs reported) were adjusted for inflation, to give the nominal £/kWh in each year. This nominal £/kWh was used to estimate the proportion of the total cost based on the kWh reported in each of the years prior to 2017/18.
- Pay-weighted RPI, was a weighted average of RPI and NHS FTE pay inflation assuming that 33% (based on workforce data collected in 2018/19) of soft facilities management costs were associated with pay.
- The ‘NHS full-time equivalent pay inflation’ was based on reported pay for NHS infrastructure support staff
Table 4: inflation indices used
| Field | Inflation Index | ||
| Backlog (£) | Backlog (£) | TPI | |
| Finance costs (£) | Finance costs (including contributions to costs) (£) | RPI | |
| Hard facilities management (£) | Energy (£) | Coal (£) | Coal and Solid Fuels |
| Electricity (£) | Electricity | ||
| Gas (£) | Gas | ||
| Oil (£) | Oil | ||
| Other energy (£) | Gas | ||
| General (£) | Hard facilities management | ||
| Maintenance (£) | Other maintenance (£) | Hard facilities management | |
| Maintenance (£) | Electro-biomedical engineering (EBME) maintenance (£) | Hard facilities management | |
| Waste (£) | Hard facilities management | ||
| Water and sewerage (£) | Hard facilities management | ||
| Management costs (£) | Management costs (£) | NHS FTE pay inflation | |
| Soft facilities management (£) | Cleaning (£) | Cleaning | |
| Food (£) | Food and Catering RPI | ||
| General (£) | Pay weighted RPI | ||
| Laundry and linen (£) | Laundry Cost Index | ||
| Portering (£) | Pay weighted RPI | ||
Publication reference: PRN01522