
Introduction
Pay gap reporting is a key accountability measure that ensures transparency in how organisations reward their workforce. By identifying and addressing disparities, we can create a fairer, more inclusive workplace where all colleagues can thrive.
This is about more than compliance; it’s about harnessing talent to better serve the public, strengthen our workforce, and improve patient care.
This report presents NHS England’s gender, ethnicity, disability, and sexual orientation pay gaps as of 31 March 2024, based on data from the Electronic Staff Record (ESR). The reporting period covers 1 April 2023 to 31 March 2024, with hourly pay calculated in accordance with government guidelines.
The pay gap data for ethnicity, disability, and sexual orientation relies on self-disclosure.*
*Due to limitations in ESR, not all colleagues are able to self-declare or identify their protected characteristics, including ethnicity, gender identity, and social mobility status. As such, the data used for pay gap reporting may not fully reflect the diversity of the workforce, and efforts to improve data capture are ongoing.
Our reporting follows the government’s guidance as published by the Women and Equalities Unit, measuring the average hourly pay difference between:
- men and women (gender pay gap)
- white and Black and minority ethnic (BME) staff (ethnicity pay gap)
- non-disabled and disabled staff (disability pay gap)
- heterosexual and lesbian, gay, or bi (LGB) staff (sexual orientation pay gap)
Pay gaps by banding reveal disparities, particularly among non-Agenda for Change (AfC) grades, which include staff from organisations like Public Health England and the University of London.
These employees retain original terms and salaries, and their numbers have decreased to 88 in 2023/24.
Given the small numbers, these should be considered separately from the overall pay gap analysis.
The gender pay gap
What was our gender pay gap on 31 March 2024?
On 31 March 2024, NHS England employed 15,758 people. 63.59% of our workforce were women and 36.41% were men.
This report calculates both median and mean averages to measure the gender pay gap – the difference between average hourly rates paid to women versus men.
On 31 March 2024, the mean gender pay gap at NHS England was 11.41%, calculated by adding all pay rates together and dividing by the total number of people.
The median gender pay gap, was 8.66%. The median gender pay gap is the difference in hourly pay between the woman who would be in the middle if you considered female employees from the lowest to the highest paid, and the man who would be in the middle of a similar profile of male employees. This way of looking at the pay gap avoids the influence of very high or very low salaries on the average.
While these figures show a decrease compared to 2021/22, the comparison should be considered within the context of organisational change as the 2022/23 data includes the newly combined NHS England (with NHS Digital and Health Education England), unlike the 2021/22 figures.
Figure 1: Mean gender pay gap trends at NHS England, NHS Digital and Health Education England between 2017/18 and 2021/22
| Year | NHS England | NHS Digital | Health Education England |
|---|---|---|---|
| 2017/18 | 19.30% | 14.40% | 23.08% |
| 2018/19 | 18.58% | 12.34% | 20.35% |
| 2019/20 | 16.65% | 10.67% | 18.44% |
| 2020/21 | 16.20% | 9.34% | 18.44% |
| 2021/22 | 14.72% | 10.60% | 17.29% |
Figure 2: Mean gender pay gap trends at NHS England between 2022/23 and 2023/24
| Year | NHS England |
|---|---|
| 2022/23 | 11.84% |
| 2023/24 | 11.41% |
What is the proportion of men and women at different pay levels?
Women make up 51% of the population of England and Wales,* and occupied 52.02% of the highest paid jobs in NHS England (the upper quartile) on 31 March 2024.
They also held 72.56% of the lowest-paid quarter of jobs in the organisation, with men occupying 27.44% of these roles. Men make up 49% of the general population.
[*According to the 2021 census.]
Figure 3: The proportion of men and women in each pay quartile on 31 March 2024
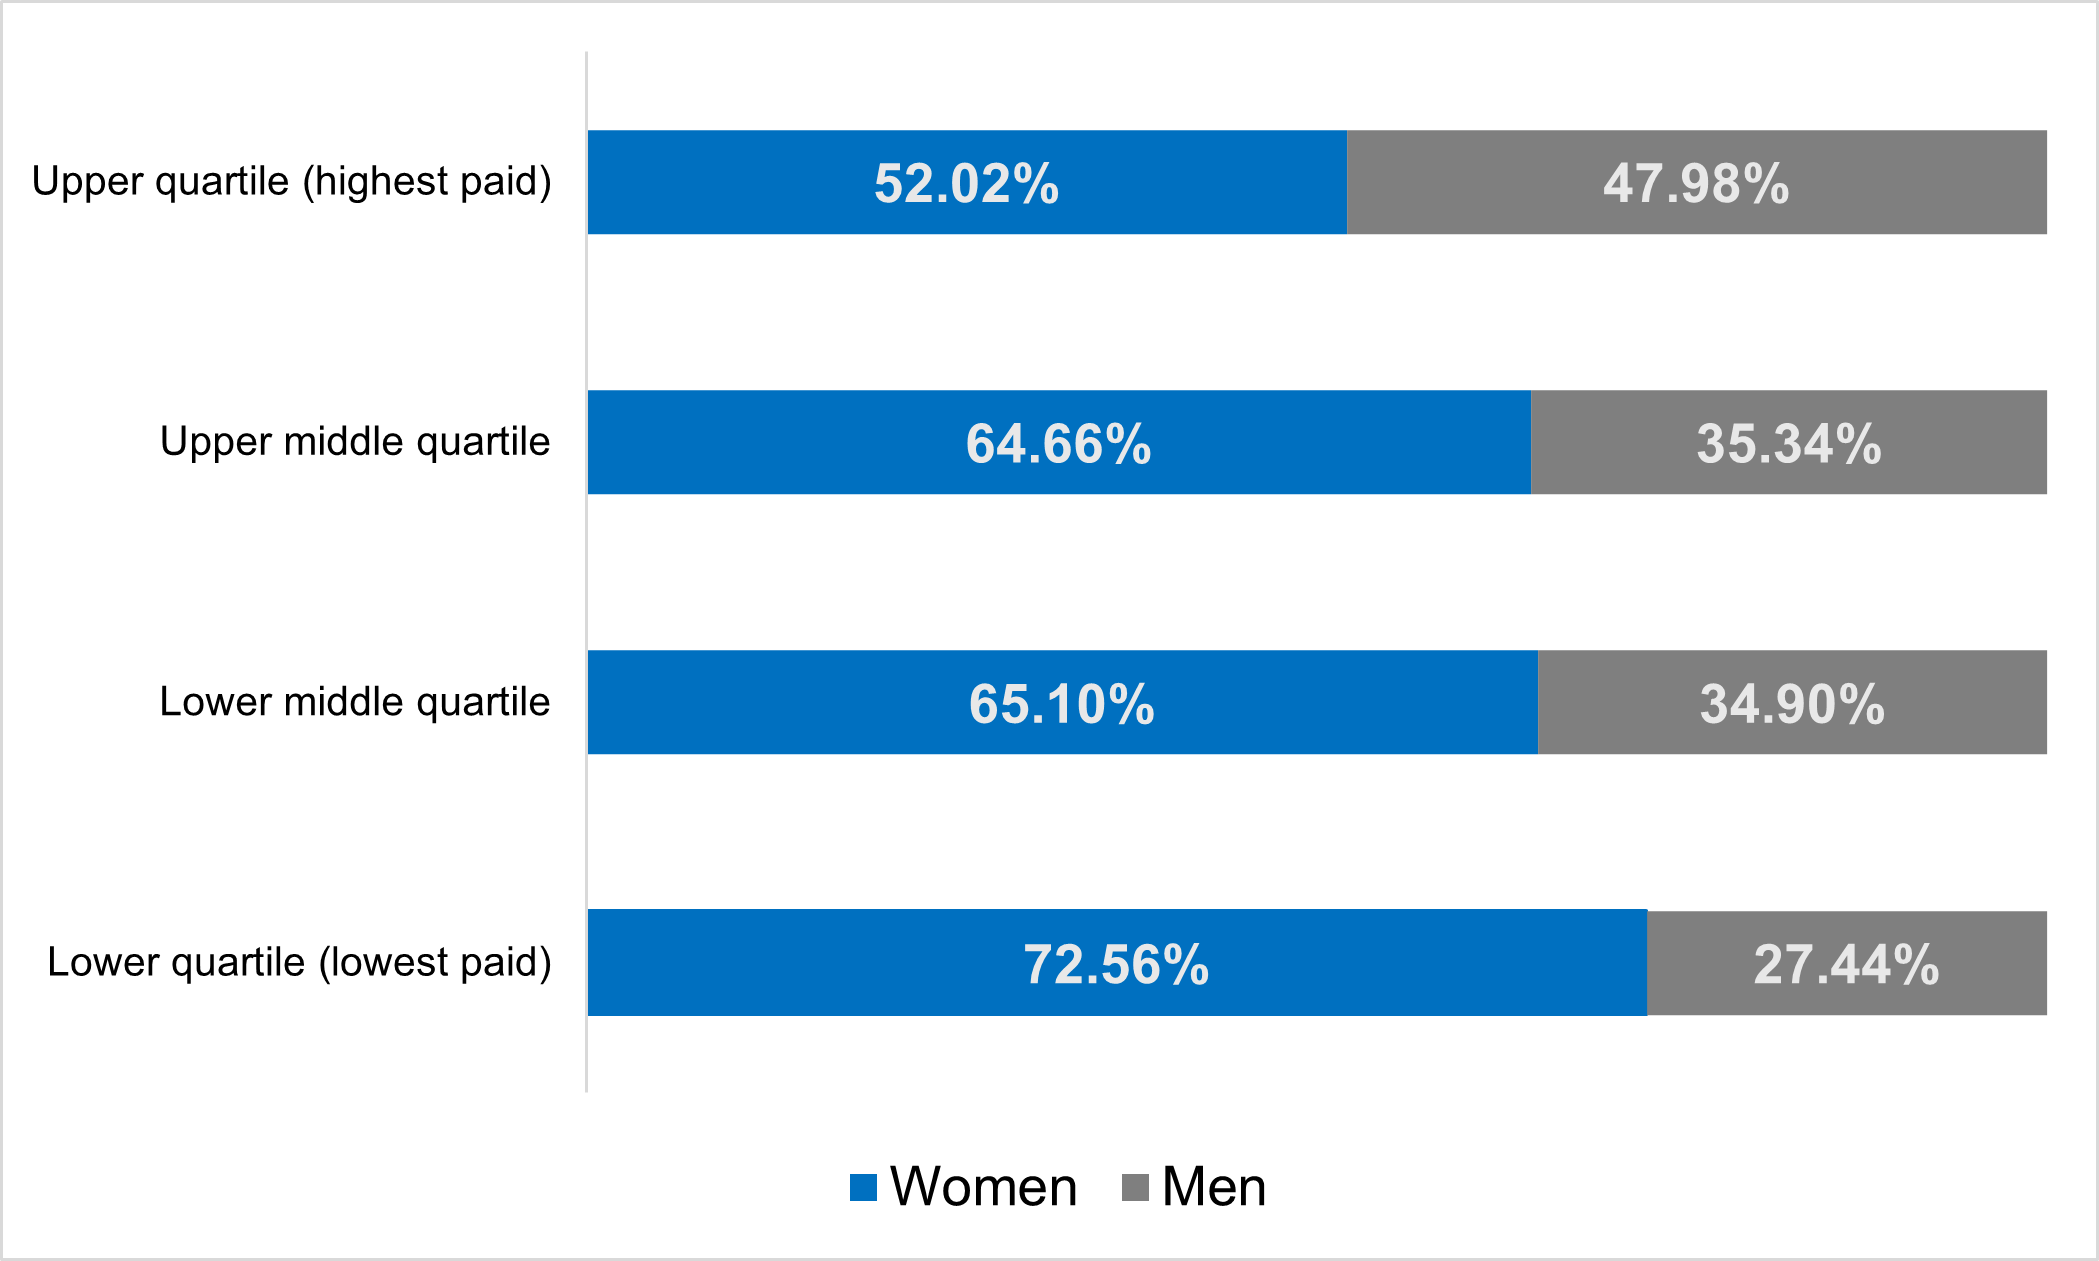
Figure 3 above shows the following proportions:
- Upper quartile (highest paid): 52.02% women, 47.98% men
- Upper-middle quartile: 64.66% women, 35.34% men
- Lower-middle quartile: 65.10% women, 34.90% men
- Lower quartile (lowest paid): 72.56% women, 27.44% men
What are the gender pay gaps at different pay bands?
Women are in a majority of roles in pay bands 5 to 8a, while men are most represented at bands 7 and above.
Women out-earn men in pay bands 3, 5 and 6, while men earn more in bands 2, 8b and above.
These differences are likely to be influenced by factors including length of service, and part-time and full-time hours.
Figure 4: Gender pay gaps at different pay bands
| 1* | 2* | 3* | 4* | 5* | 6* | 7* | |
|---|---|---|---|---|---|---|---|
| Pay bands | Mean hourly rate: women | Number of staff: women | Mean hourly rate: men | Number of staff: men | % of women in band | % of men in band | % difference in mean hourly rate |
| Band 2 | £11.30 | 7 | £11.96 | 11 | 0.07% | 0.19% | +5.50% |
| Band 3 | £12.51 | 70 | £12.50 | 24 | 0.70% | 0.42% | -0.11% |
| Band 4 | £13.83 | 521 | £13.97 | 175 | 5.20% | 3.05% | +0.99% |
| Band 5 | £16.97 | 998 | £16.69 | 307 | 9.96% | 5.35% | -1.70% |
| Band 6 | £20.66 | 997 | £20.53 | 450 | 9.95% | 7.84% | -0.60% |
| Band 7 | £24.89 | 1515 | £25.01 | 754 | 15.12% | 13.14% | +0.45% |
| Band 8a | £28.26 | 1558 | £28.72 | 933 | 15.55% | 16.26% | +1.59% |
| Band 8b | £32.96 | 1314 | £33.79 | 818 | 13.11% | 14.26% | +2.44% |
| Band 8c | £39.16 | 1035 | £40.30 | 704 | 10.33% | 12.27% | +2.83% |
| Band 8d | £46.57 | 653 | £47.97 | 447 | 6.52% | 7.79% | +2.92% |
| Band 9 | £56.08 | 402 | £56.90 | 290 | 4.01% | 5.05% | +1.44% |
| ESM/MDL | £66.30 | 249 | £67.50 | 259 | 2.49% | 4.51% | +1.77% |
| Medical | £54.23 | 646 | £55.30 | 533 | 6.45% | 9.29% | +1.93% |
| Non-AfC | £28.53 | 55 | £40.29 | 33 | 0.55% | 0.58% | +29.18% |
| All Grades | £31.67 | 10,020 | £35.75 | 5,738 | 100% | 100% | +11.41% |
* Column notes:
- Mean average hourly rate paid to women in each band.
- Number of women employed in each band.
- Mean average hourly rate paid to men in each band.
- Number of men employed in each band.
- Number of women employed in each band, expressed as a percentage of all women employed overall.
- Number of men employed in each band, expressed as a percentage of all men employed overall.
- Percentage difference between the mean average hourly rate paid to men and women in each band. A positive value shows the men’s average rate is higher, a negative value shows the women’s average rate is higher.
What is the gender pay gap for bonuses?
The gender pay gap for bonus payments, including clinical impact awards (CIAs), is calculated separately and does not contribute to the overall gender pay gap figure.
National clinical impact awards are determined by an independent process for the entire NHS, led by the Advisory Committee on Clinical Impact Awards.
During this reporting period, 47 NHS England employees received CIAs and corresponding payments, of which 47% were made to males and 53% to females.
Due to the small sample size, the pay gap for awards for CIAs show variation and is not fully representative or statistically significant.
For 2023/24, the mean gender gap in awards was 42.20%, compared to 40.06% in 2022/23. The median gender gap was 64.71%, compared to 72.22% in the previous year.
The ethnicity pay gap
What was our ethnicity pay gap on 31 March 2024?
On 31 March 2024, NHS England employed 15,758 people. Our workforce profile was 22.79% BME, 70.63% white, and 6.58% having no recorded ethnicity in ESR (referred to here as ‘unknown’).
The ethnicity pay gap measures the difference between the average hourly rate paid to BME employees and that paid to white employees. We use both median and mean averages.
On 31 March 2024, the mean ethnicity pay gap at NHS England was 5.09%, with white employees earning more than BME employees. This was calculated by adding all pay rates together and dividing by the total number of people.
The median ethnicity pay gap was 1.98% on 31 March 2024 in favour of white employees. The median ethnicity pay gap compares the middle-earning BME employee with the middle-earning white employee when ranked by pay. This method avoids the influence of very high or low salaries.
While these gaps appear to decrease compared with 2021/22 (both the mean and median averages), this comparison should be considered within the context of organisational change as the 2022/23 data includes the newly combined NHS England (with NHS Digital and Health Education England), unlike the 2021/22 figures.
Figure 5: Mean ethnicity pay gap trends at NHS England, NHS Digital and Health Education England between 2017/18 and 2021/22
| Year | NHS England | NHS Digital | Health Education England |
|---|---|---|---|
| 2017/18 | 15.01% | 8.59% | – |
| 2018/19 | 12.75% | 8.82% | – |
| 2019/20 | 10.95% | 7.71% | 0.58% |
| 2020/21 | 9.04% | 7.75% | 3.29% |
| 2021/22 | 7.30% | 8.40% | 1.62% |
Figure 6: Mean ethnicity pay gap trends at new NHS England between 2022/23 and 2023/24
| Year | New NHS England |
|---|---|
| 2022/23 | 9.13% |
| 2023/24 | 5.09% |
What is the proportion of white and BME staff at different pay levels?
Individuals from BME backgrounds make up 18.3% of the population of England and Wales* and occupied 20.28% of the highest paid jobs in NHS England (the upper quartile) on 31 March 2024.
27.01% of the lowest-paid quarter of jobs in the organisation (the lower quartile) were held by staff from BME backgrounds, with white staff at 66.37%. This compares with 81.7% of white individuals present in the general population.
[*According to the 2021 census.]
Figure 7: The proportion of BME and white staff in each pay quartile on 31 March 2024
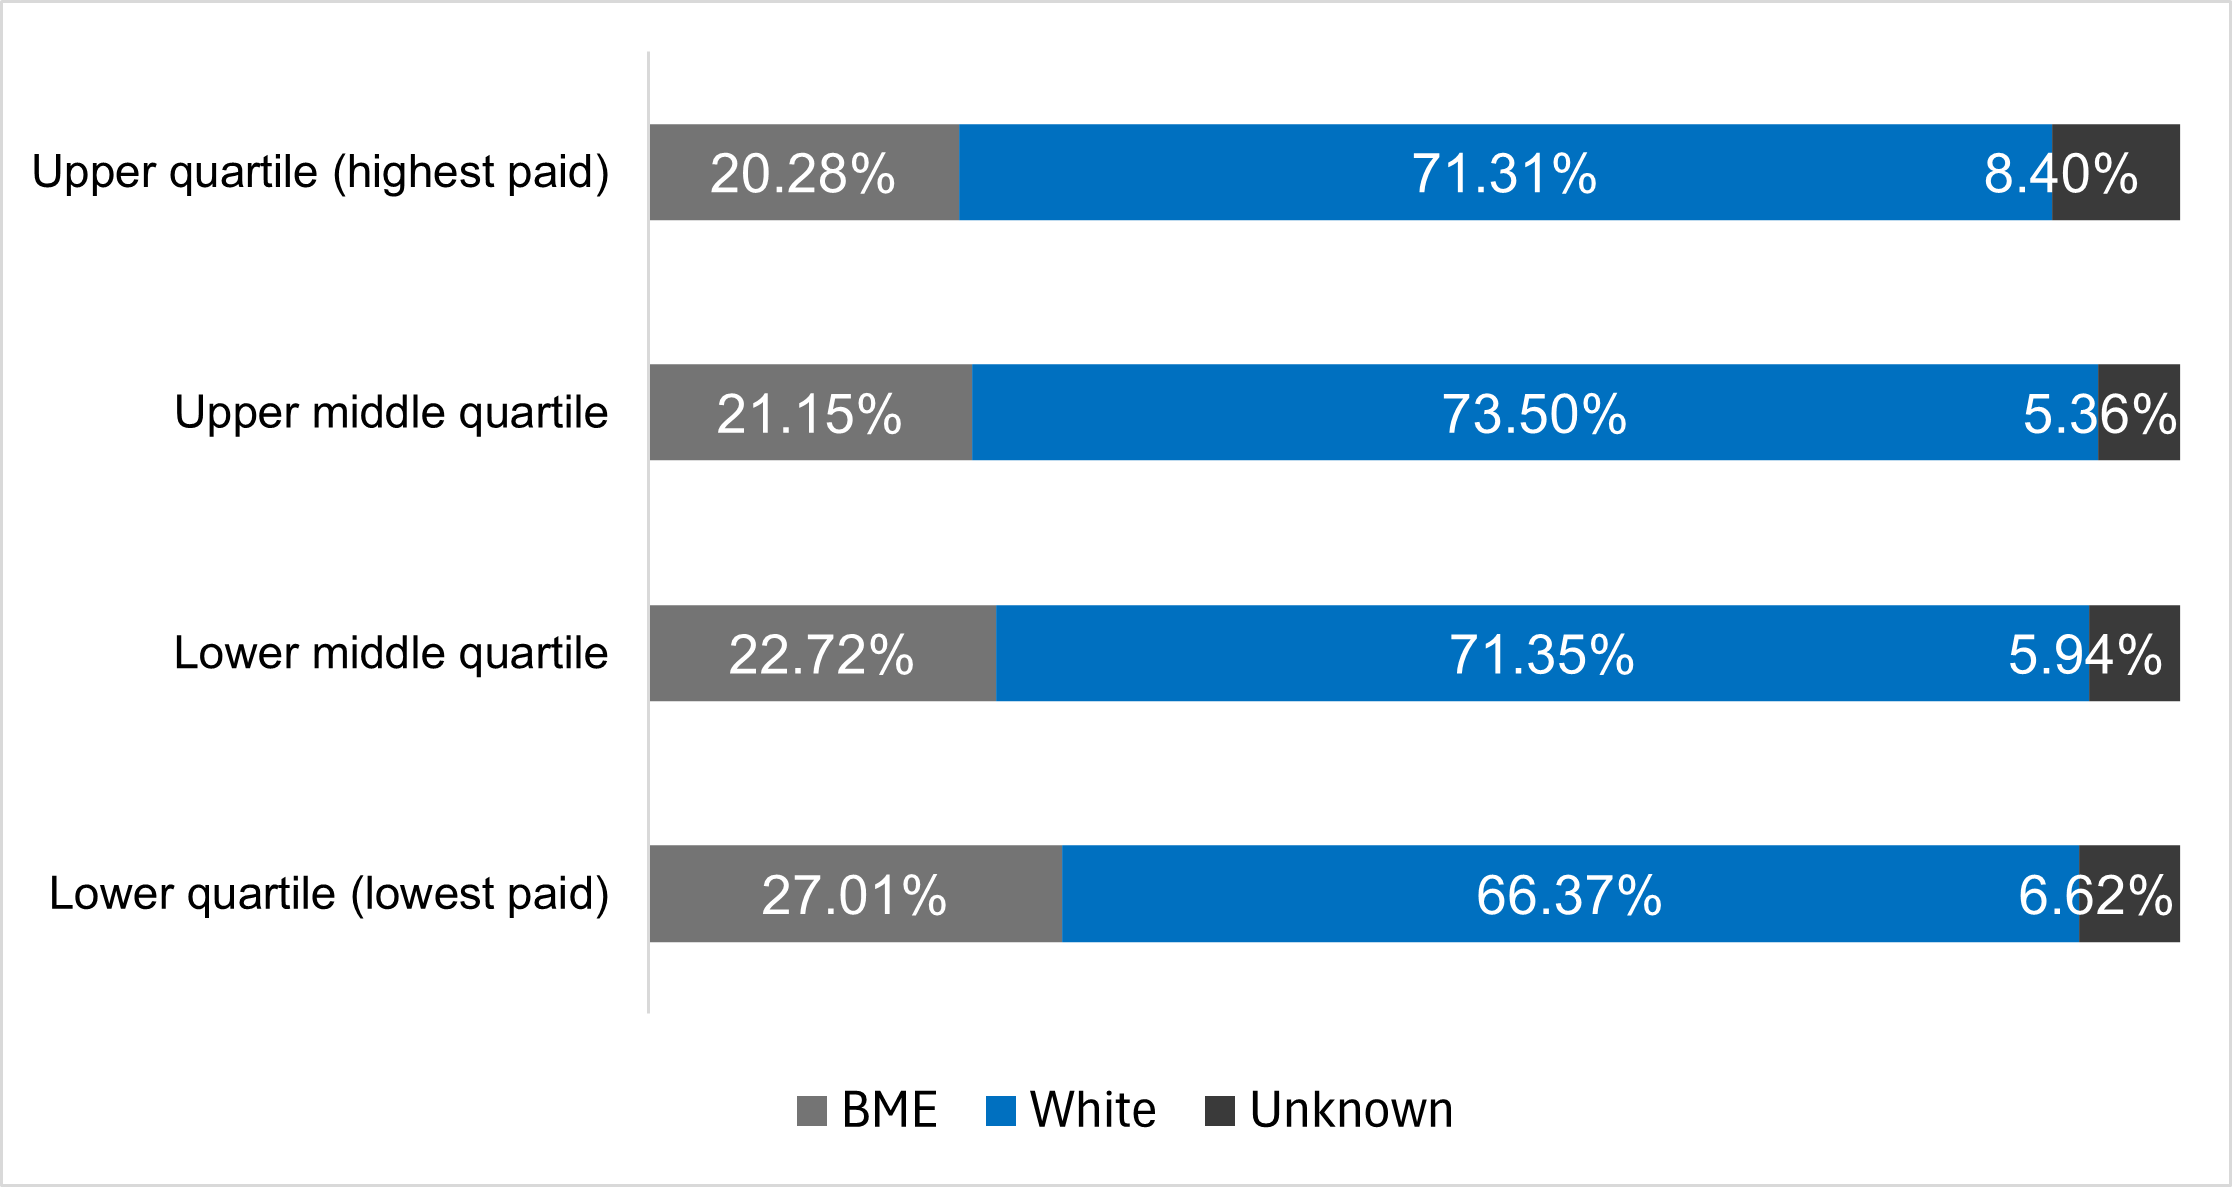
Figure 7 above shows the following proportions:
- Upper quartile (highest paid): 20.28% BME, 71.31% white, 8.40% unknown
- Upper-middle quartile: 21.15% BME, 73.50% white, 5.36% unknown
- Lower-middle quartile: 2.72% BME, 71.35% white, 5.94% unknown
- Lower quartile (lowest paid): 27.01% BME, 66.37% white, 6.62% unknown
What are the ethnicity pay gaps at different bands?
While the mean salaries for BME colleagues across pay bands 3 to 9 are higher, the ESM level shows a disparity in the ethnicity pay gap.
Similarly, we have the highest proportion of BME staff in pay bands 7, 8a, and 8b, whereas staff from a white background are more concentrated between bands 8a and 8b.
Figure 8: Ethnicity pay gaps at different bands
| 1* | 2* | 3* | 4* | 5* | 6* | 7* | |
|---|---|---|---|---|---|---|---|
| Pay bands | Mean hourly rate: BME | Number of staff: BME | Mean hourly rate: white | Number of staff: white | Mean hourly rate: unknown | Number of staff: unknown | Mean % difference |
| Band 2 | £12.19 | 7 | £11.38 | 7 | £11.44 | <=5 | -7.12% |
| Band 3 | £12.47 | 28 | £12.55 | 60 | £12.23 | 6 | +0.70% |
| Band 4 | £14.26 | 214 | £13.66 | 442 | £13.98 | 40 | -4.41% |
| Band 5 | £17.11 | 366 | £16.76 | 841 | £17.40 | 98 | -2.11% |
| Band 6 | £21.19 | 393 | £20.35 | 961 | £21.00 | 93 | -4.10% |
| Band 7 | £25.53 | 546 | £24.66 | 1584 | £25.67 | 139 | -3.55% |
| Band 8a | £28.96 | 571 | £28.19 | 1761 | £29.30 | 159 | -2.75% |
| Band 8b | £33.60 | 448 | £33.14 | 1580 | £34.02 | 104 | -1.36% |
| Band 8c | £39.96 | 312 | £39.49 | 1325 | £40.32 | 102 | -1.18% |
| Band 8d | £47.46 | 152 | £47.02 | 893 | £48.18 | 55 | -0.94% |
| Band 9 | £56.13 | 91 | £56.35 | 566 | £58.24 | 35 | +0.40% |
| ESM/MDL | £61.00 | 96 | £68.39 | 352 | £67.68 | 60 | +10.80% |
| Medical | £53.89 | 358 | £55.37 | 695 | £53.42 | 126 | +2.66% |
| Non-AfC | £50.09 | 9 | £30.30 | 63 | £33.70 | 16 | -65.34% |
| All Grades | £31.74 | 3,591 | £33.45 | 11,130 | £34.94 | 1,037 | +5.09% |
* Column notes:
- Mean average hourly rate paid to Black and minority ethnic staff in each band.
- Number of Black and minority ethnic staff employed in each band.
- Mean average hourly rate paid to white staff in each band.
- Number of white staff employed in each band.
- Mean average hourly rate paid to staff in each band whose ethnicity is unrecorded.
- Number of staff employed in each band whose ethnicity is unrecorded.
- Percentage difference between the mean average hourly rate paid to Black and minority ethnic staff in each band, and that paid to white staff in that band. A positive value shows the average rate paid to white staff is higher; a negative value shows the average rate paid to Black and minority ethnic staff is higher.
What is the ethnicity pay gap for bonuses?
Of 47 NHS England employees receiving clinical impact awards payments, 70% identified as white, 28% identified as BME, and 5 or fewer colleagues reported an ‘unknown’ ethnicity.
Due to small sample sizes, the pay gap for awards shows variation and is not fully representative or statistically significant.
The mean ethnicity award gap for 2023/24 is 58.33%, which is a reduction from 60.88% last year. Similarly, the median ethnicity award gap reduced to 66.67%, from 70.59%.
The disability pay gap
What was our disability pay gap on 31 March 2024?
On 31 March 2024, NHS England employed 15,758 people. 9.79% identified as disabled.
The disability pay gap measures the difference between the average hourly rate paid to disabled and non-disabled employees, using both median and mean averages.
NHS England’s mean disability pay gap was 6.64% on 31 March, based on total pay rates divided by employee numbers.
The median disability pay gap was 4.58% for the same period. The median represents the difference between the middle-earning disabled employee and their non-disabled counterpart when ranked by pay. This method avoids the influence of very high or very low salaries.
While these gaps have decreased since 2021/22 (both the mean and median averages), this comparison is not direct as the 2022/23 data includes the newly combined NHS England (with NHS Digital and Health Education England), unlike the 2021/22 figures.
Figure 9: Mean disability pay gap trends at NHS England between 2018/19 and 2021/22
| Year | NHS England |
|---|---|
| 2018/19 | 7.30% |
| 2019/20 | 8.60% |
| 2020/21 | 7.70% |
| 2021/22 | 8.20% |
Figure 10: Mean disability pay gap trends at NHS England between 2022/23 and 2023/24
| Year | New NHS England (combined) |
|---|---|
| 2022/23 | 7.20% |
| 2023/24 | 6.64% |
What is the proportion of disabled and non-disabled staff at different pay levels?
People who confirm they have a disability make up 17.7% of the population in England and Wales,* and occupied 7.84% of the highest paid jobs in NHS England (the upper quartile) on 31 March 2024.
Meanwhile, disabled staff occupied 11.45% of the 25% lowest paid jobs in the organisation (the lower quartile), with non-disabled staff occupying 78.81% of these roles. Non-disabled people make up 82.3% of the general population.
[*According to the 2021 census.]
Figure 11: The proportion of disabled and non-disabled staff in each pay quartile on 31 March 2024
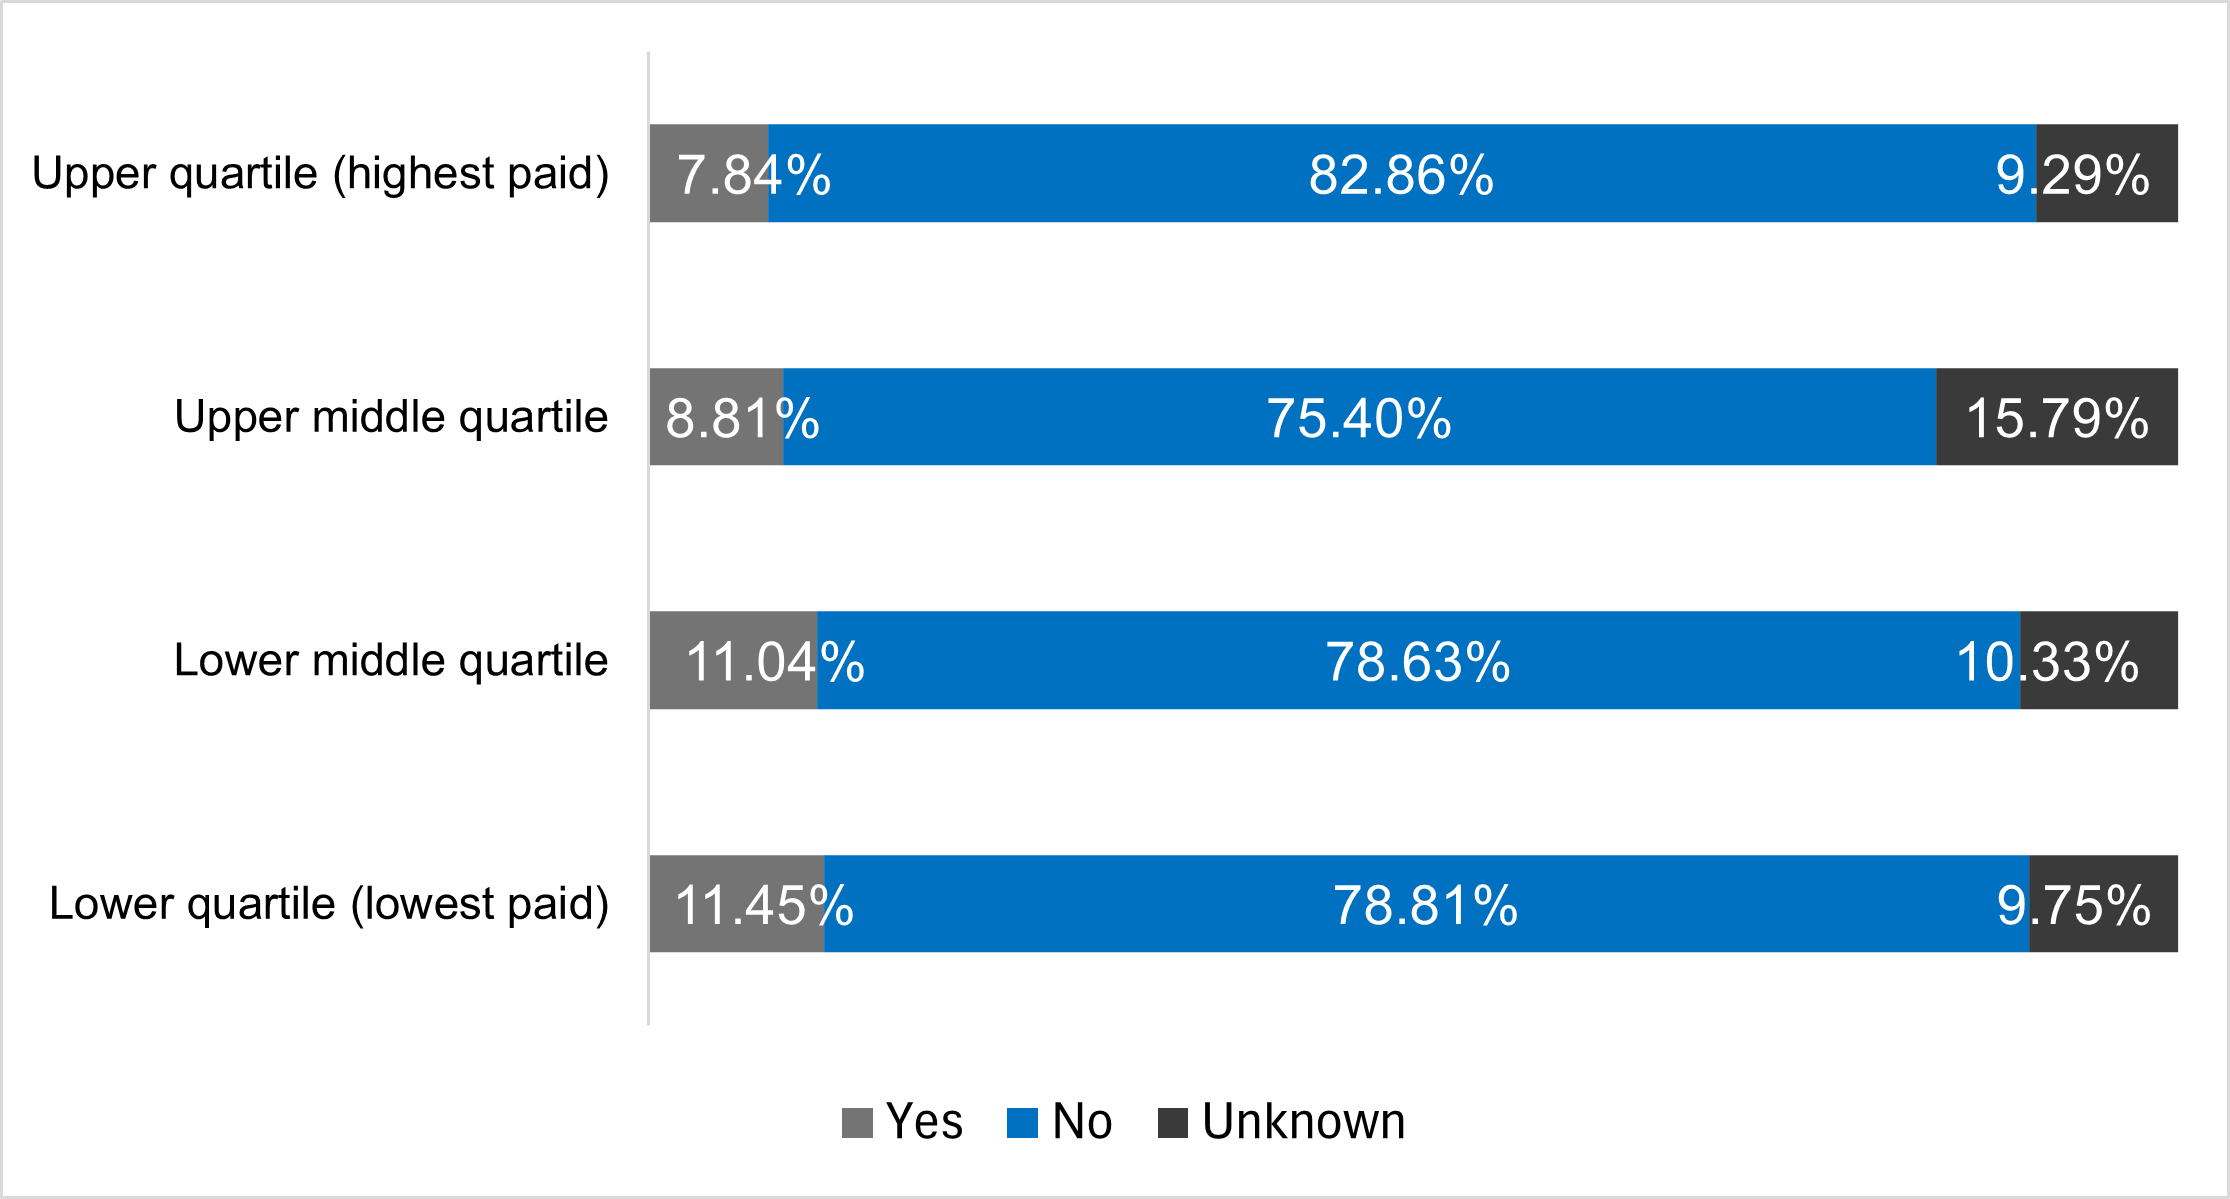
Figure 11 above shows the following proportions:
- Upper quartile (highest paid): 7.84% disabled, 82.86% non-disabled, 9.29% unknown
- Upper-middle quartile: 8.81% disabled, 75.40% non-disabled, 15.79% unknown
- Lower-middle quartile: 11.04% disabled, 78.63% non-disabled, 10.33% unknown
- Lower quartile (lowest paid): 11.45% disabled, 78.81% non-disabled, 9.75% unknown
What are the disability pay gaps at different pay bands?
The mean pay gap between disabled and non-disabled staff is most pronounced in the medical workforce.
Disabled employees in band 2 and non-AfC grades have higher mean pay compared to other bands, which show a minimal to no gap.
Figure 12: Disability pay gaps at different pay bands
| 1* | 2* | 3* | 4* | 5* | 6* | 7* | |
|---|---|---|---|---|---|---|---|
| Pay bands | Mean hourly rate: disabled | Number of staff: disabled | Mean hourly rate: non-disabled | Number of staff: non-disabled | Mean hourly rate: unknown | Number of staff: unknown | Mean % difference |
| Band 2 | £11.44 | <=5 | £11.71 | 8 | £11.96 | <=5 | +2.34% |
| Band 3 | £12.51 | 12 | £12.50 | 73 | £12.59 | 9 | -0.08% |
| Band 4 | £14.04 | 95 | £13.81 | 551 | £14.12 | 50 | -1.68% |
| Band 5 | £16.96 | 134 | £16.82 | 1,015 | £17.43 | 156 | -0.83% |
| Band 6 | £20.68 | 173 | £20.55 | 1,148 | £21.18 | 126 | -0.65% |
| Band 7 | £25.03 | 241 | £24.88 | 1,788 | £25.24 | 240 | -0.60% |
| Band 8a | £28.34 | 279 | £28.36 | 1,961 | £29.14 | 251 | +0.08% |
| Band 8b | £33.55 | 200 | £33.12 | 1,718 | £34.36 | 214 | -1.30% |
| Band 8c | £39.77 | 154 | £39.49 | 1,399 | £40.53 | 186 | -0.73% |
| Band 8d | £46.27 | 100 | £47.02 | 874 | £48.67 | 126 | +1.58% |
| Band 9 | £55.72 | 55 | £56.12 | 550 | £58.77 | 87 | +0.72% |
| ESM/MDL | £65.72 | 32 | £66.52 | 384 | £68.97 | 92 | +1.21% |
| Medical | £59.48 | 57 | £54.49 | 912 | £54.37 | 210 | -9.16% |
| Non-AfC | £39.33 | <=5 | £36.75 | 56 | £23.86 | 27 | -7.03% |
| All Grades | £30.83 | 1,542 | £33.03 | 12,437 | £36.03 | 1,779 | +6.64% |
* Column notes:
- Mean average hourly rate paid to disabled staff in each band.
- Number of disabled staff employed in each band.
- Mean average hourly rate paid to non-disabled staff in each band.
- Number of non-disabled staff employed in each band.
- Mean average hourly rate paid to staff in each band whose disability status is unrecorded.
- Number of staff employed in each band whose disability status is unrecorded.
- Percentage difference between the mean average hourly rate paid to disabled staff in each band, and that paid to non-disabled staff in that band. A positive value shows the average rate paid to non-disabled staff is higher; a negative value shows the average rate paid to disabled staff is higher.
What is the disability pay gap for bonuses?
During this reporting period, 47 NHS England employees received clinical impact payments decided upon and awarded by an independent national process across the entire NHS for medical staff and beyond NHS England.
Of these, 81% identified as non-disabled, while 5 or fewer colleagues identified as having a disability, and an additional 5 or fewer reported an ‘unknown’ disability status.
Due to low levels of employees identifying as disabled we cannot calculate a disability pay gap for those awards.
The sexual orientation pay gap
What was our sexual orientation pay gap on 31 March 2024?
On 31 March 2024, NHS England employed 15,758 people, with 13,329 disclosing their sexual orientation on ESR. The workforce comprises 4.96% colleagues identifying as lesbian, gay or bi (LGB), 79.31% as heterosexual, 0.31% recorded as ‘other’ and 15.41% are unknown.
The sexual orientation pay gap measures the difference between average hourly rate paid to LGB employees and heterosexual employees, using both median and mean averages.
On 31 March 2024, the mean gap was 0.68% in favour of heterosexual employees, based on total pay rates divided by employee numbers.
The median sexual orientation pay gap was 0% for the same period. The median sexual orientation pay gap is the difference in hourly pay between the LGB employee who would be in the middle if you considered LGB employees from the lowest to the highest paid and the heterosexual employee who would be in the middle of a similar profile of heterosexual employees. This way of looking at the pay gap avoids the influence of very high or very low salaries on the average.
In figure 14, the March 2024 figure is for the combined new NHS England, including both NHS Digital and Health Education England; the ‘NHS England’ figures for 2021/22 relate only to the former NHS England.
Figure 13: Mean sexual orientation pay gap trends at NHS England between 2018/19 and 2021/22*
| Year | NHS England |
|---|---|
| 2018/19 | -4.10% |
| 2019/20 | -3.80% |
| 2020/21 | -3.90% |
| 2021/22 | -2.00% |
*negative figures show where the gap has shifted the other way. In this instance LGB employees earn more than heterosexual employees.
Figure 14: Mean sexual orientation pay gap trends at new NHS England between 2022/23 and 2023/24
| Year | New NHS England |
|---|---|
| 2022/23 | 1.29% |
| 2023/24 | 0.68% |
What is the proportion of heterosexual and LGB staff at different pay levels?
LGB people make up 3.2% of the population of England and Wales,* and occupied 4.57% of the highest paid jobs in NHS England (the upper quartile) on 31 March.
In NHS England, LGB staff held 4.97% of the lowest-paid jobs (the lower quartile), with heterosexual staff at 81.09%. Heterosexual people represent 89.4% of the general population.
[*According to the 2021 census.]
Figure 15: The proportion of LGB and heterosexual staff in each pay quartile on 31 March 2024
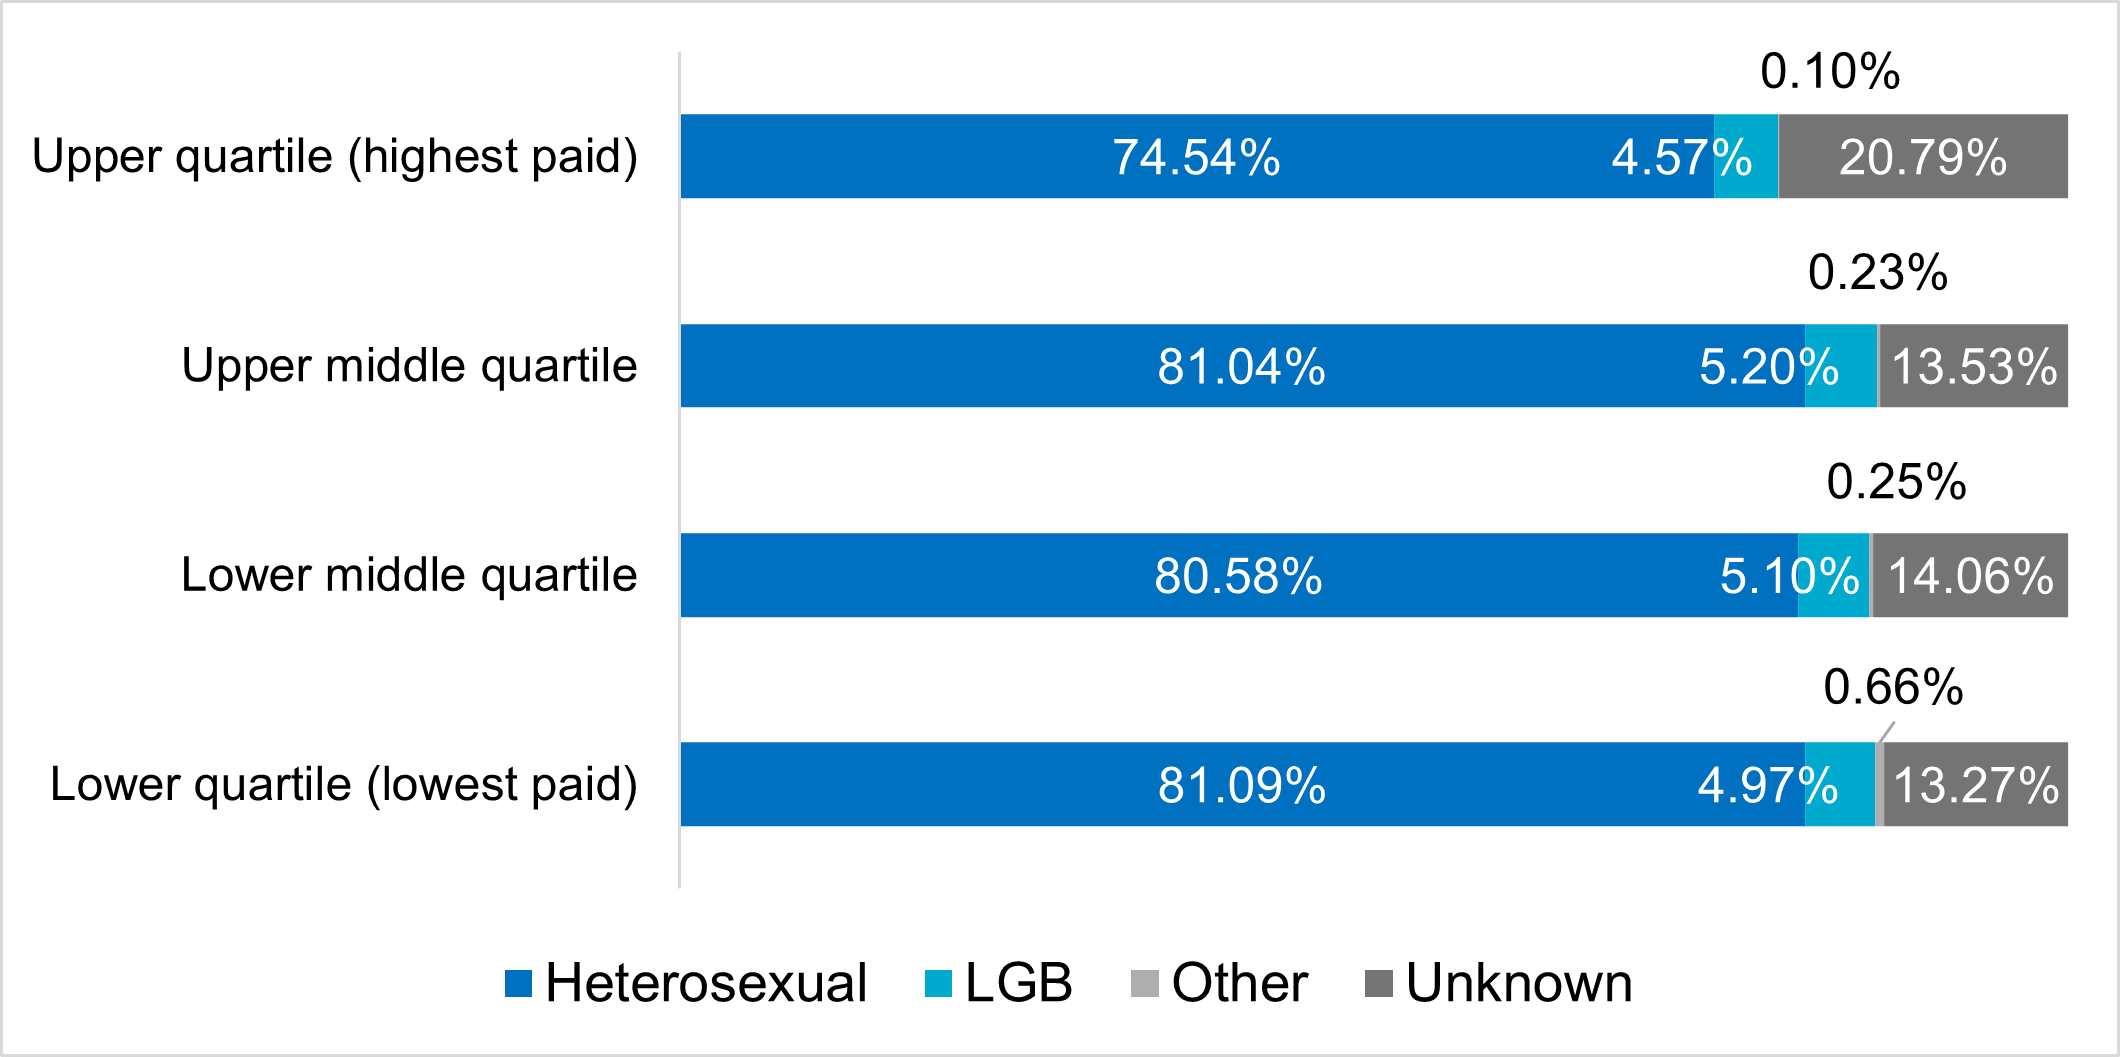
Figure 15 above shows the following proportions:
- Upper quartile (highest paid): 75.54% heterosexual, 4.57% LGB, 0.10% other, 20.79% unknown
- Upper-middle quartile: 81.04% heterosexual, 5.20% LGB, 0.23% other, 13.53% unknown
- Lower-middle quartile: 80.58% heterosexual, 5.10% LGB, 0.25% other, 14.06% unknown
- Lower quartile (lowest paid): 81.09% heterosexual, 4.97% LGB, 0.66% other, 13.27% unknown
What are the sexual orientation pay gaps at different pay bands?
The mean salaries for LGB colleagues across pay bands 7 to Medical were higher than those at band 2 to band 6.
Figure 16: Sexual orientation pay gaps at different pay bands
| 1* | 2* | 3* | 4* | 5* | 6* | 7* | |
|---|---|---|---|---|---|---|---|
| Pay bands | Mean hourly rate: LGB | Number of staff: LGB | Mean hourly rate: hetero-sexual | Number of staff: hetero-sexual | Mean hourly rate: unknown | Number of staff: unknown | Mean % difference |
| Band 2 | – | – | £11.92 | 12 | £11.28 | 6 | – |
| Band 3 | £12.05 | 6 | £12.59 | 76 | £12.18 | 11 | +4.27% |
| Band 4 | £13.82 | 35 | £13.83 | 581 | £14.13 | 73 | +0.10% |
| Band 5 | £16.79 | 57 | £16.85 | 1052 | £17.24 | 191 | +0.36% |
| Band 6 | £20.47 | 79 | £20.57 | 1175 | £21.01 | 185 | +0.48% |
| Band 7 | £25.23 | 122 | £24.87 | 1794 | £25.16 | 340 | -1.44% |
| Band 8a | £28.62 | 129 | £28.30 | 2021 | £29.13 | 337 | -1.12% |
| Band 8b | £33.03 | 112 | £33.16 | 1709 | £34.08 | 305 | +0.41% |
| Band 8c | £39.88 | 96 | £39.46 | 1357 | £40.34 | 284 | -1.07% |
| Band 8d | £46.72 | 51 | £46.99 | 873 | £47.96 | 173 | +0.58% |
| Band 9 | £55.87 | 46 | £56.23 | 539 | £57.62 | 107 | +0.64% |
| ESM/MDL | £66.41 | 17 | £66.63 | 376 | £67.91 | 115 | +0.32% |
| Medical | £61.94 | 31 | £54.67 | 880 | £54.02 | 268 | -13.31% |
| Non-AfC | £13.45 | <=5 | £34.88 | 53 | £30.50 | 34 | +61.43% |
| All Grades | £32.54 | 782 | £32.76 | 12,498 | £35.58 | 2,429 | +0.68% |
* Column notes:
- Mean average hourly rate paid to staff in each band identifying as lesbian, gay or bi.
- Number of staff employed in each band identifying as lesbian, gay or bi.
- Mean average hourly rate paid to staff in each band identifying as heterosexual.
- Number of staff employed in each band identifying as heterosexual.
- Mean average hourly rate paid to staff in each band whose sexual orientation is not disclosed.
- Number of staff employed in each band whose sexual orientation is not disclosed.
- Percentage difference between the mean average hourly rate paid to staff in each band identifying as lesbian, gay or bi, and that paid to staff in the same band identifying as heterosexual. A positive value shows the average rate paid to heterosexual staff is higher; a negative value shows the average rate paid to LGB staff is higher.
What is the sexual orientation pay gap for bonuses?
During this reporting period, 47 NHS England employees received clinical impact awards, with 85% identifying as heterosexual, no employees identifying as LGB, and 15% whose sexual orientation status was ‘unknown’.
As there were no employees identifying as LGB, we cannot calculate a sexual orientation pay gap for those awards.
Actions to reduce the gap
Structural aspects of NHS England’s workforce contribute to our pay gaps.
Effective strategies to close our pay gaps will address systemic barriers and factors common to all, while also targeting inequalities faced by specific groups based on characteristics such as gender, ethnicity, disability, sexual orientation, age, and profession.
NHS England’s internal Equality Diversity and Inclusion team has developed a comprehensive EDI Improvement Strategy and plan.
Furthermore, the EDI Improvement Plan 2025/26 will be refined with clear, measurable steps aimed at reducing the key pay gaps outlined in this report.
The plan will be considered, approved and monitored through our existing governance framework, ensuring senior leadership accountability, regular progress reviews, and transparent reporting to drive sustained focus and track outcomes.
Together, we are committed to building a better place to work which is why we have already taken several important steps to address our pay gaps, informed by feedback from our 2023/24 staff survey. These steps include:
- introducing new organisational values – Collaboration, Inclusion, and Learning and Improvement.
- launching the mandatory Line Management Development Programme.
- strengthening our inclusive recruitment practices.
- reviewing and updating our Special Leave and Flexible Working policies.
- encouraging self-identification to enhance data quality.
Addressing our pay gaps is vital to living our values. Over the next year, we will continue to work with our staff networks and make key changes, including:
- further strengthening recruitment practices, including standardising criteria, reducing bias, and diversifying interview panels to improve representation in senior roles.
- developing strategies for equitable access to training, development, and leadership opportunities, especially for underrepresented groups.
- identifying and supporting high-potential individuals to build a strong, representative leadership pipeline.
- providing targeted mentorship and sponsorship to support progression into senior roles.
Ensuring a fair and inclusive workplace where all colleagues can succeed requires a clear focus on pay gaps and the barriers that contribute to them.
Transparency and accountability in how we reward our workforce allow us to identify and remove barriers, strengthening our organisation.
This work is fundamental to building the best possible workforce, one that is equipped to serve the public with excellence and deliver the highest standard of care.
Publication reference: PRN01854