
Introduction
This report presents NHS England’s gender, ethnicity, disability and sexual orientation pay gaps as of 31 March 2025, based on data from the NHS Electronic Staff Record (ESR). The reporting period covers 1 April 2024 to 31 March 2025, with hourly pay calculated in accordance with government guidelines.
Pay gap reporting is a key accountability measure that ensures transparency in how organisations reward their workforce. By identifying and addressing disparities, we can create a fairer, more inclusive workplace where all colleagues can thrive.
The pay gap data for ethnicity, disability and sexual orientation relies on self-disclosure.
Note: due to limitations in ESR, not all colleagues can self-declare or identify their protected characteristics, including ethnicity, gender identity and social mobility status. As such, the data used for pay gap reporting may not fully reflect the diversity of the workforce, and efforts to improve data capture are ongoing.
Our reporting follows the government’s guidance as published by the Women and Equalities Unit, measuring the average hourly pay difference between:
- men and women (gender pay gap)
- White and ethnic minority staff (ethnicity pay gap)
- non-disabled and disabled staff (disability pay gap)
- heterosexual and lesbian, gay or bisexual (LGB) staff (sexual orientation pay gap)
Pay differences across bands reflect some variation, including a group of 72 individuals who are not employed under Agenda for Change (AfC) terms and conditions. These staff members are former employees of Public Health England and the University of London and remain on legacy employment contracts.
The gender pay gap
Our gender pay gap on 31 March 2025
On 31 March 2025, NHS England employed 15,658 people. 9,960 (63.61%) of our workforce were women and 5,698 (36.39%) were men.
This report calculates both median and mean averages to measure the gender pay gap – the difference between average hourly rates paid to men and women.
On 31 March 2025, the mean gender pay gap at NHS England was 10.58%, meaning that women earned on average 10.58% less per hour than men. This figure is calculated by adding all pay rates together and dividing by the total number of people.
The median gender pay gap was 11.2%. The UK average in 2023/24 was 13.1%.
The median gender pay gap is the difference in hourly pay between the midpoint female earner and the midpoint male earner. This is calculated by ranking all employees in each group by hourly wage and selecting the middle value. This method reduces the influence of very high or very low salaries on the overall figure.
Compared to 2023/24, the mean gender pay gap has decreased by 0.83%, while the median gender pay gap has increased by 2.54%.
Table 1: Mean and median gender pay gap trends at NHS England between 2022/23 and 2024/25
| Year | Mean pay gap | Median pay gap |
|---|---|---|
| 2022/23 | 11.84% | 8.87% |
| 2023/24 | 11.41% | 8.66% |
| 2024/25 | 10.58% | 11.20% |
The proportion of men and women at different pay levels
According to the 2021 Census, women make up 49.4% of the working population in England and Wales. Women represented 63.61% of the NHS England workforce and accounted for 54.09% of the highest-paid roles (upper quartile) as of 31 March 2025.
Women also held 72.16% of the lowest-paid quarter of jobs in NHS England – with men accounting for 27.84% of these roles. Men make up 49% of the general population.
Figure 1: The actual numbers and proportion of men and women in each pay quartile on 31 March 2025
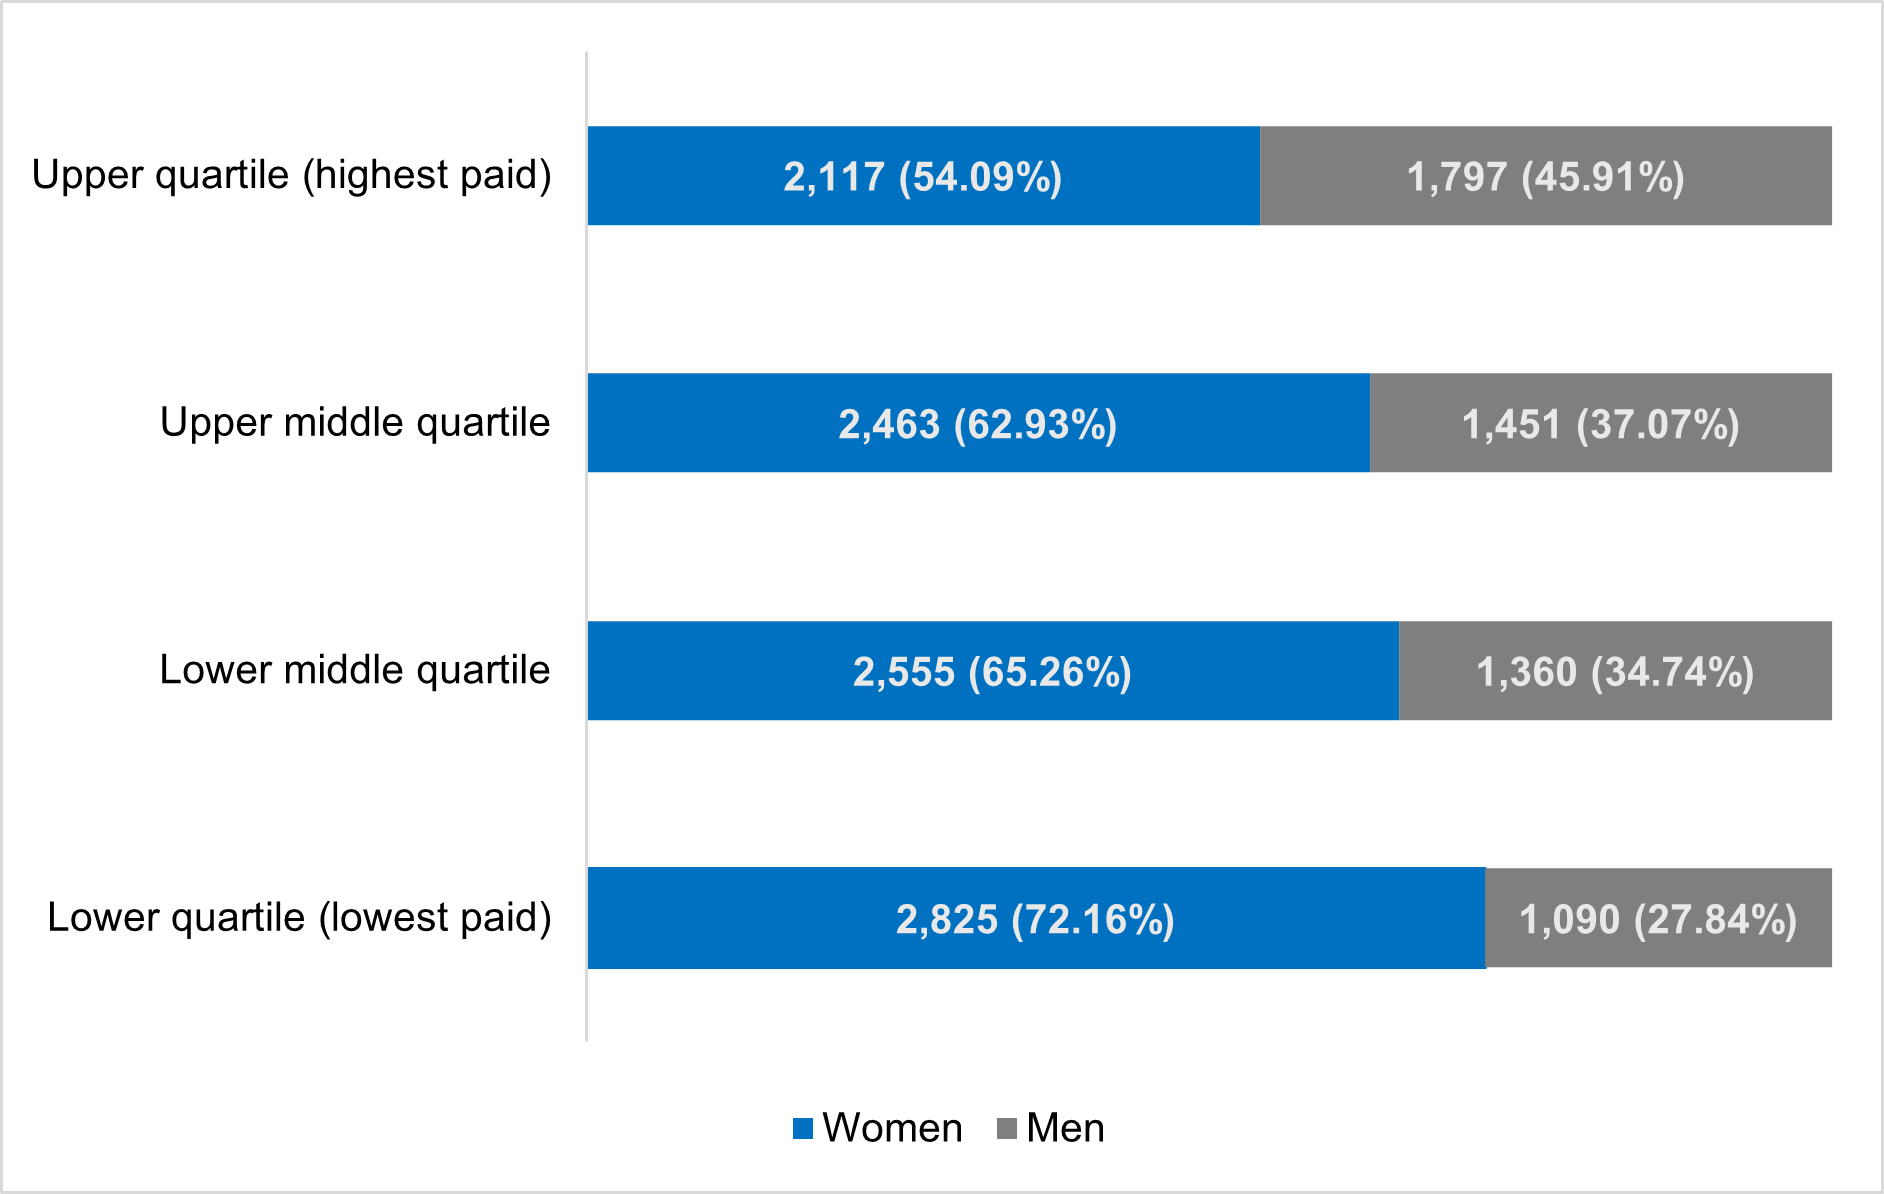
The above chart shows:
- for the upper quartile (highest paid): 2,117 women (54.09%) and 1,797 men (45.91%)
- for the upper middle quartile: 2,463 women (62.93%) and 1,451 men (37.07%)
- for the lower middle quartile: 2,555 women (65.26%) and 1,360 men (34.74%)
- for the lower quartile (lowest paid): 2,825 women (72.16%) and 1,090 men (27.84%)
Gender pay gaps at different pay bands
Women form the majority of staff in pay bands 3 to 9, while men slightly outnumber women in Band 2. However, the proportion of men increases at the most senior levels.
Women earn more than men in pay bands 2, 5 and 6, while men have higher earnings in bands 3, 4, 7 and above. These differences are likely influenced by factors such as length of service, working hours (part-time versus full-time) and pay step progression.
Table 2: Gender pay gaps at different pay bands
| Grade | Mean hourly rate: women | Number of staff: women | Mean hourly rate: men | Number of staff: men | % of all women employed in this band | % of all men employed in this band | Mean % difference |
|---|---|---|---|---|---|---|---|
| Band 2 | £12.31 | 8 | £12.18 | 9 | 0.08% | 0.16% | -1.08% |
| Band 3 | £13.12 | 60 | £13.22 | 24 | 0.60% | 0.42% | 0.72% |
| Band 4 | £14.82 | 477 | £14.93 | 146 | 4.79% | 2.56% | 0.74% |
| Band 5 | £18.10 | 964 | £18.05 | 297 | 9.68% | 5.21% | -0.24% |
| Band 6 | £22.00 | 991 | £21.92 | 408 | 9.95% | 7.16% | -0.36% |
| Band 7 | £26.53 | 1444 | £26.55 | 768 | 14.50% | 13.48% | 0.07% |
| Band 8a | £30.54 | 1507 | £30.95 | 932 | 15.13% | 16.36% | 1.34% |
| Band 8b | £35.62 | 1402 | £36.58 | 829 | 14.08% | 14.55% | 2.63% |
| Band 8c | £42.51 | 1091 | £43.44 | 751 | 10.95% | 13.18% | 2.13% |
| Band 8d | £50.33 | 695 | £51.73 | 473 | 6.98% | 8.30% | 2.7% |
| Band 9 | £60.75 | 395 | £61.15 | 284 | 3.97% | 4.98% | 0.67% |
| ESM and MDL* | £69.56 | 249 | £71.13 | 255 | 2.50% | 4.48% | 2.20% |
| Medical | £56.70 | 634 | £56.97 | 493 | 6.37% | 8.65% | 0.48% |
| Non-AfC | £27.00 | 43 | £40.20 | 29 | 0.43% | 0.51% | 32.85% |
| All grades | £34.26 | 9960 | £38.31 | 5698 | 100% | 100.00% | 10.58% |
* ESM stands for executive senior manager and MDL is medical leader
Gender pay gap for bonuses
Clinical Impact Awards (CIAs) are determined through an independent national process led by the Advisory Committee on Clinical Impact Awards.
During the reporting period, 40 NHS England employees received CIAs and associated payments. Of these, 42.5% were awarded to men and 57.5% to women. The median bonus payment value was higher for men, resulting in a median gender pay gap for bonuses of 66.67%, up from 64.71% the previous year.
The ethnicity pay gap
Our ethnicity pay gap on 31 March 2025
On 31 March 2025, NHS England employed 15,658 people. Our workforce was 3,672 (23.45%) ethnic minority employees, 11,056 (70.61%) White employees and 930 (5.94%) employees having no recorded ethnicity in ESR.
The ethnicity pay gap measures the difference between the average hourly rate paid to ethnic minority employees and that paid to White employees. We use both median and mean averages.
On 31 March 2025, the mean ethnicity pay gap at NHS England was 5.47%, with White employees earning more than ethnic minority employees. This was calculated by adding all pay rates together and dividing by the total number of people.
The median ethnicity pay gap was 5.65% on 31 March 2025 in favour of White employees. The median ethnicity pay gap compares the middle-earning ethnic minority employee with the middle-earning White employee when ranked by pay. This method avoids the influence of very high or low salaries.
Table 3: Mean and median ethnicity pay gap trends at NHS England between 2022/23 and 2024/25
| Year | Mean pay gap | Median pay gap |
|---|---|---|
| 2022/23 | 9.13% | 6.66% |
| 2023/24 | 5.09% | 1.98% |
| 2024/25 | 5.47% | 5.65% |
The proportion of White and ethnic minority staff at different pay levels
According to the 2021 Census, individuals from ethnic minority backgrounds represented 12% of the working population in England and Wales. Ethnic minority employees represented 23.45% of the NHS England workforce and accounted for 22.18% of its highest-paid roles (upper quartile) as of 31 March 2025.
Staff from ethnic minority backgrounds held 27.99% of roles in the lowest-paid quartile, where White staff made up 66.13%. This compares with White individuals who comprise 80.7% of the working population.
Figure 2: The proportion of ethnic minority and White staff in each pay quartile on 31 March 2025
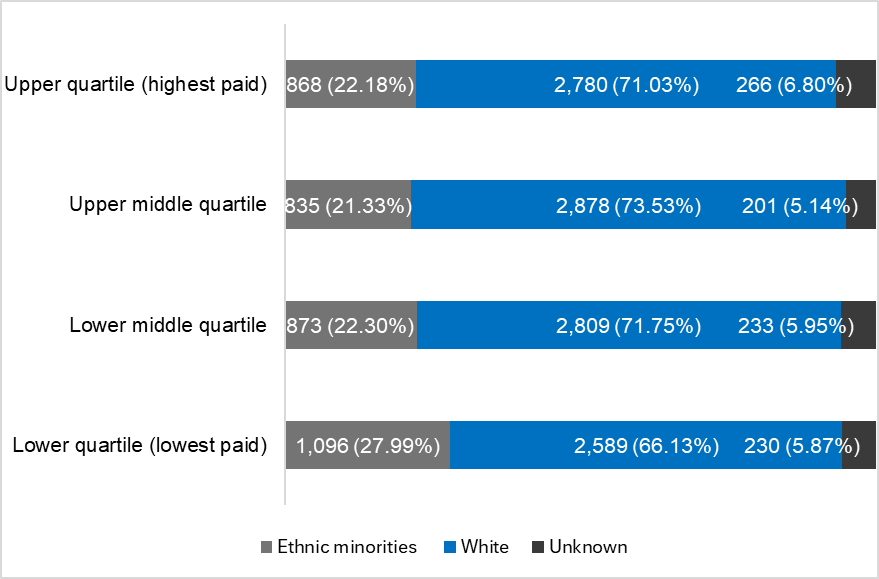
The above chart shows:
- upper quartile (highest paid): 868 ethnic minority staff (22.18%), 2,780 White staff (71.03%) and 266 staff with unknown ethnicity (6.80%)
- upper middle quartile: 835 ethnic minority staff (21.33%), 2,878 White staff (73.53%) and 201 unknown (5.14%)
- lower middle quartile: 873 ethnic minority staff (22.30%), 2,809 White staff (71.75%) and 233 unknown (5.95%)
- lower quartile (lowest paid): 1,096 ethnic minority staff (27.99%), 2,589 White staff (66.13%) and 230 unknown (5.87%)
Ethnicity pay gaps at different pay bands
Across pay bands 3 to 9, mean salaries for colleagues from ethnic minority backgrounds are generally higher than those of their White counterparts. At the executive senior manager (ESM) level, however, mean salaries for ethnic minority staff fall below those of White colleagues, highlighting a disparity at the most senior grades.
Within the ethnic minority workforce, staff are most concentrated in pay bands 7, 8a and 8b. In contrast, White staff are more concentrated in bands 8a and 8b.
The number of ethnic minority employees within NHS England increased by 81, from 3,591 in 2023/24 to 3,672 in 2024/25. The number of White employees decreased by 74 from 11,130 to 11,056 and the number of unknowns decreased by 107. This shift is likely to have impacted the overall increase in the pay gap, with more ethnic minority employees in NHS England than in previous years.
While the hourly rates paid to ethnic minority staff have largely kept pace with, and in some cases exceeded, those of White staff, the overall ethnicity pay gap has widened slightly. This is primarily due to the higher concentration of White staff in the most senior and better-paid roles, where pay growth has been stronger.
Table 4: Ethnicity pay gaps at different bands
| Grade | Mean hourly rate: ethnic minority staff | Number of ethnic minority staff | Mean hourly rate: White staff | Number of White staff | Mean hourly rate: ethnicity unknown | Number of staff: ethnicity unknown | Mean % difference |
|---|---|---|---|---|---|---|---|
| Band 2 | £12.42 | 9 | £11.49 | 6 | £13.72 | <=5 | -8.08% |
| Band 3 | £13.16 | 28 | £13.23 | 50 | £12.44 | 6 | 0.49% |
| Band 4 | £15.32 | 201 | £14.60 | 387 | £14.81 | 35 | -4.92% |
| Band 5 | £18.38 | 382 | £17.89 | 801 | £18.73 | 78 | -2.76% |
| Band 6 | £22.67 | 399 | £21.66 | 919 | £22.13 | 81 | -4.67% |
| Band 7 | £27.14 | 546 | £26.25 | 1528 | £27.30 | 138 | -3.38% |
| Band 8a | £31.40 | 572 | £30.40 | 1723 | £31.48 | 144 | -3.30% |
| Band 8b | £36.44 | 486 | £35.81 | 1648 | £36.39 | 97 | -1.76% |
| Band 8c | £43.36 | 330 | £42.77 | 1418 | £43.10 | 94 | -1.39% |
| Band 8d | £51.16 | 175 | £50.83 | 943 | £51.39 | 50 | -0.67% |
| Band 9 | £61.08 | 90 | £60.87 | 555 | £61.24 | 34 | 0.35% |
| ESM/MDL | £66.53 | 99 | £71.37 | 353 | £70.77 | 52 | 6.77% |
| Medical | £56.53 | 348 | £56.98 | 669 | £56.58 | 110 | 0.79% |
| Non-AfC | £43.88 | 7 | £31.95 | 56 | £25.63 | 9 | -37.36% |
| All grades | £34.16 | 3,672 | £36.14 | 11,056 | £37.15 | 930 | 5.47% |
Ethnicity pay gap for bonuses
Of the 40 NHS England employees who received Clinical Impact Award payments, 77.5% identified as White and 22.5% identified as ethnic minority. Fewer than 5 colleagues did not report their ethnicity, and due to small numbers, this group is not expressed as a separate percentage.
As the number of ethnic minority staff within this cohort is small, it is not possible to calculate a meaningful or statistically significant ethnicity pay gap for these awards.
The disability pay gap
Our disability pay gap on 31 March 2025
On 31 March 2025, NHS England employed 15,658 people. 1,818 (11.61%) of employees identified as disabled, 12,208 (77.97%) declared having no disability and 1,632 (10.42%) had no data or did not wish to disclose.
The disability pay gap measures the difference between the average hourly rate paid to disabled and non-disabled employees, using both median and mean averages.
On 31 March 2025, NHS England’s mean disability pay gap was 8.12%, This was calculated by adding all pay rates together and dividing by the total number of employees.
The median disability pay gap was 6.38% for the same period. The median represents the difference between the middle-earning disabled employee and their non-disabled counterpart when ranked by pay. This method avoids the influence of very high or very low salaries.
Table 5: Mean and median disability pay gap trends at NHS England between 2022/23 and 2024/25
| Year | Mean pay gap | Median pay gap |
|---|---|---|
| 2022/23 | 7.20% | 1.29% |
| 2023/24 | 6.64% | 4.58% |
| 2024/25 | 8.12% | 6.38% |
The proportion of disabled and non-disabled staff at different pay levels
According to the 2021 Census, people who confirm they have a disability make up 13% of the working population in England and Wales. Disabled employees represented 11.61% of the NHS England workforce and accounted for 8.41% of its highest-paid roles (upper quartile) as of 31 March 2025.
Meanwhile, disabled staff occupied 13.67% of the 25% lowest paid jobs in the organisation (the lower quartile), with non-disabled staff occupying 76.99% of these roles. Non-disabled people make up 82.2% of the general population.
The number of staff declaring a disability within NHS England has increased by 276, from 1,542 in 2023/24 to 1,818 in 2024/25. The number of staff with no disability declared has decreased by 229 from 12,437 to 12,208 and the number of unknowns has decreased by 147, from 1,779 to 1,632. This shift is likely to have had an impact on the overall increase in the pay gap, with more employees declaring a disability than previous years.
Figure 3: The numbers and proportion of disabled and non-disabled staff in each pay quartile on 31 March 2025
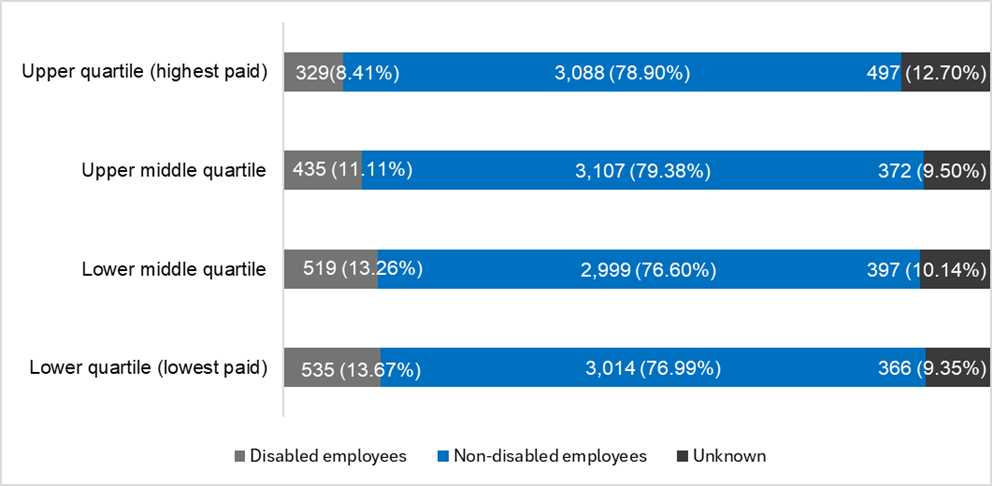
The above chart shows:
- upper quartile: 329 disabled staff (8.41%), 3,088 non‑disabled staff (78.90%), and 497 staff with unknown disability status (12.70%)
- upper middle quartile: 435 disabled staff (11.11%), 3,107 non‑disabled staff (79.38%), and 372 unknown (9.50%)
- lower middle quartile: 519 disabled staff (13.26%), 2,999 non‑disabled staff (76.60%), and 397 unknown (10.14%)
- lower quartile: 535 disabled staff (13.67%), 3,014 non‑disabled staff (76.99%), and 366 unknown (9.35%)
The disability pay gaps at different pay bands
The mean pay gap between disabled and non-disabled staff is most pronounced within the medical workforce. While both groups saw increases in hourly rates, pay for non-disabled staff rose more consistently across the higher pay bands, contributing to the overall gap.
Table 6: Disability pay gap at different pay bands
| Grade | Mean hourly rate: disabled staff | Number of disabled staff | Mean hourly rate: non-disabled staff | Number of non-disabled staff | Mean hourly rate: disability unknown | Number of staff: disability unknown | Mean % difference |
|---|---|---|---|---|---|---|---|
| Band 2 | £12.07 | <=5 | £12.04 | 11 | £13.17 | <=5 | -0.27% |
| Band 3 | £12.94 | 14 | £13.29 | 59 | £12.66 | 11 | 2.62% |
| Band 4 | £15.01 | 102 | £14.78 | 478 | £15.16 | 43 | -1.54% |
| Band 5 | £18.17 | 150 | £18.00 | 975 | £18.66 | 136 | -0.99% |
| Band 6 | £22.01 | 201 | £21.90 | 1078 | £22.60 | 120 | -0.53% |
| Band 7 | £26.57 | 290 | £26.49 | 1690 | £26.81 | 232 | -0.30% |
| Band 8a | £30.55 | 318 | £30.63 | 1886 | £31.38 | 235 | 0.28% |
| Band 8b | £36.00 | 254 | £35.92 | 1764 | £36.39 | 213 | -0.23% |
| Band 8c | £42.64 | 217 | £42.88 | 1454 | £43.29 | 171 | 0.57% |
| Band 8d | £50.29 | 123 | £50.83 | 935 | £52.18 | 110 | 1.07% |
| Band 9 | £60.94 | 49 | £60.75 | 555 | £62.18 | 75 | -0.32% |
| ESM/MDL | £66.73 | 32 | £70.42 | 390 | £71.44 | 82 | 5.25% |
| Medical | £61.22 | 60 | £56.43 | 888 | £57.25 | 179 | -8.48% |
| Non-AfC | £41.02 | <=5 | £34.76 | 45 | £25.35 | 22 | -18.03% |
| All grades | £32.95 | 1,818 | £35.86 | 12,208 | £37.92 | 1,632 | 8.12% |
Disability pay gap for bonuses
During this reporting period, 40 NHS England employees received Clinical Impact Award payments. Of these recipients, 80% identified as non-disabled, while 5 or fewer colleagues identified as disabled, and an additional 5 or fewer reported their disability status as ‘unknown’.
Due to the small number of employees in this group identifying as disabled, it is not possible to calculate a meaningful or statistically significant disability pay gap for these awards.
Factors influencing the disability pay gap
Because disability declarations change more frequently between reporting years, and a larger proportion of colleagues have historically had unknown disability status, additional analysis is necessary to understand how shifts in disclosure and workforce composition impact the disability pay gap.
The observed pay differences are primarily driven by ESM3 and ESM4, Medical and Non-AFC grades. For all other bands, pay is comparable.
For staff distribution by band:
- fewer staff in Bands 1 to 7 declared as non-disabled in 2025 compared to 2024, while Bands 8 and above show an increase in non-disabled declarations
- the number of staff declaring a disability has increased in Bands 1 to 8 but has decreased in Band 9 and among ESMs compared to 2024
Disability pay gap analysis: 2024 to 2025
In March 2024, the total headcount was 15,758, compared with 15,658 in March 2025. The key changes in disability declaration across the workforce between the 2 reporting years are outlined below.
Changes in employee cohort:
- in 2025 report but not in the previous 2024 report (new starters):
- 1,051 employees
- 97 declared a disability
- 788 declared as non-disabled
- 166 unknown
- employees included in the 2024 report but not included in the 2025 (as they either left or were categorised as long-term absence):
- 1,477 employees
- 143 declared a disability
- 1,167 declared as non-disabled
- 167 unknown
- employees included in the 2025 report but not in the 2024 report (included compared to the previous year i.e long term sick, maternity leave):
- 326 employees
- 24 declared a disability
- 275 declared as non-disabled
- 27 unknown
- employees considered in both the 2024 and 2025 reports:
- 13,762 employees
- 1,392 declared a disability
- 10,975 declared as non-disabled
- 1,395 unknown
Overall changes in disability declaration status from 2024 and 2025
- 50 employees changed from unknown to declaring a disability
- 167 employees changed from unknown to declaring as non-disabled
- 255 employees changed from declaring as non-disabled to declaring a disability
- 44 employees changed from declaring (either disabled or non-disabled) to unknown
- 3 employees changed from declaring a disability to non-disabled
Insights on the potential impact of the disability pay gap
The disability pay gap has increased between 2024 and 2025, which may be influenced by several factors:
- a high number of new joiners: Most of recorded themselves as non‑disabled (788) rather than disabled (97). This changed the overall pay picture because the non‑disabled group grew faster than the disabled group
- changes in declaration status: Some people changed their declaration. 305 employees updated their record to say they have a disability. At the same time, 170 employees moved from unknown to non‑disabled
- workforce turnover: 143 employees declaring a disability left the organisation
- resolution of unknown status: employees with an unknown status updated their record to say they have a disability.
The sexual orientation pay gap
Sexual orientation pay gap on 31 March 2025
On 31 March 2025, NHS England employed 15,658 people, with 13,446 disclosing their sexual orientation on ESR. The workforce comprises 785 (5.01%) colleagues identifying as lesbian, gay or bisexual (LGB), 12,605 (80.50%) as heterosexual, 56 (0.36%) recorded as ‘other’, and 2,212 (14.13%) are unknown.
The sexual orientation pay gap measures the difference between average hourly rate paid to LGB employees and heterosexual employees, using both median and mean averages. On 31 March 2025, the mean gap was 0.06% in favour of heterosexual employees, based on total pay rates divided by employee numbers.
The median sexual orientation pay gap was 0% for the same period. The median sexual orientation pay gap is the difference in hourly pay between the midpoint LGB earner and the midpoint heterosexual earner. This is calculated by ranking all employees in each group by hourly wage and finding the middle value. This way of looking at the pay gap avoids the influence of very high or very low salaries on the average.
Table 7: Mean and median sexual orientation pay gap trends at NHS England between 2022/23 and 2024/25
| Year | Mean pay gap | Median pay gap |
|---|---|---|
| 2022/23 | 1.29% | 0% |
| 2023/24 | 0.68% | 0% |
| 2024/25 | 0.06% | 0% |
Proportion of heterosexual and LGB staff at different pay levels
According to the 2021 Census, LGB people make up 3.2% of the working population in England and Wales. A higher proportion of LGB adults were employed (63.8%) compared to heterosexual adults (57.8%). LGB people represented 5.01% of the NHS England workforce and accounted for 4.75% of its highest-paid roles (upper quartile) as of 31 March 2025.
Meanwhile, LGB staff held 4.98% of the lowest-paid jobs (the lower quartile), with heterosexual staff at 82.07%. Heterosexual people represent 89.4% of the working population.
Figure 4: The numbers and proportion of LGB and heterosexual staff in each pay quartile on 31 March 2025
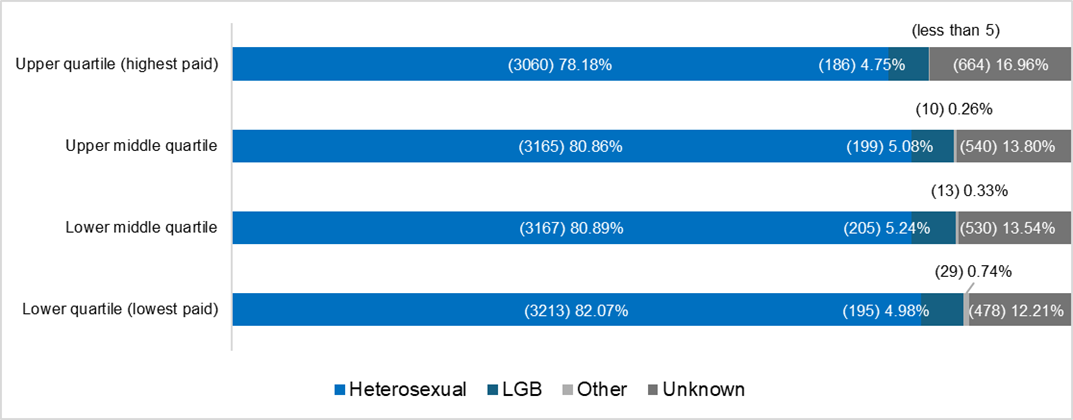
The above chart shows:
- upper quartile: 186 LGB staff (4.75%), 3,060 heterosexual staff (78.18%), less than 5 staff recorded as other sexual orientations and 664 staff with unknown status (16.96%)
- upper middle quartile: 199 LGB staff (5.08%), 3,165 heterosexual staff (80.86%), 10 (0.26%) staff recorded as other sexual orientations and 540 staff with unknown status (13.80%)
- lower middle quartile: 205 LGB staff (5.24%), 3,167 heterosexual staff (80.89%), 13 (0.33%) staff recorded as other sexual orientations and 530 staff with unknown status (13.54%)
- lower quartile: 195 LGB staff (4.98%), 3,213 heterosexual staff (82.07%), 29 (0.74%) staff recorded as other sexual orientations and 478 staff with unknown status (12.21%)
Figure 8: Sexual orientation pay gap at different pay bands
| Grade | Mean hourly rate: LGB staff | Number of LGB staff | Mean hourly rate: heterosexual | Number of heterosexual staff | Mean hourly rate: unknown | Number of staff: unknown | Mean % difference |
|---|---|---|---|---|---|---|---|
| Band 2 | – | – | £12.36 | 13 | £11.86 | <=5 | – |
| Band 3 | £12.79 | 6 | £13.23 | 67 | £12.85 | 11 | 3.28% |
| Band 4 | £14.69 | 35 | £14.86 | 521 | £14.84 | 61 | 1.14% |
| Band 5 | £17.93 | 57 | £18.04 | 1043 | £18.47 | 159 | 0.61% |
| Band 6 | £22.01 | 79 | £21.92 | 1150 | £22.37 | 166 | -0.41% |
| Band 7 | £26.43 | 122 | £26.49 | 1768 | £26.80 | 315 | 0.24% |
| Band 8a | £30.75 | 129 | £30.58 | 1970 | £31.38 | 333 | -0.56% |
| Band 8b | £36.00 | 112 | £25.88 | 1820 | £36.57 | 293 | -0.33% |
| Band 8c | £42.81 | 96 | £42.80 | 1456 | £43.44 | 275 | -0.03% |
| Band 8d | £50.32 | 51 | £50.83 | 953 | £51.53 | 152 | 1.00% |
| Band 9 | £61.26 | 46 | £60.76 | 544 | £61.79 | 87 | -0.81% |
| ESM/MDL | £74.25 | 17 | £69.80 | 385 | £71.68 | 98 | -6.37% |
| Medical | £58.03 | 31 | £56.69 | 871 | £57.13 | 230 | -2.36% |
| Non-AfC | – | – | £35.55 | 44 | £27.23 | 28 | – |
| All Grades | £35.43 | 785 | £35.45 | 12,498 | £37.72 | 2,212 | 0.06% |
Sexual orientation pay gaps at different pay bands
Overall, there is minimal difference in average pay between LGB and heterosexual staff. However, notable variations exist within specific pay bands. For example, in the ESM and MDL grade, LGB staff earn 6.37% more, while in band 3 they earn 3.28% less.
Both LGB and heterosexual staff saw pay increases across most bands during the reporting period.
Sexual orientation pay gap for bonuses
During this reporting period, 40 NHS England employees received Clinical Impact Awards. Of these, 85% identified as heterosexual, 15% did not disclose their sexual orientation, and no recipients identified as LGB.
As a result, it is not possible to calculate a sexual orientation bonus pay gap for LGB employees in this award cycle.
Actions to reduce the pay gaps
Over the past year, NHS England has taken the following actions, committed to in our previous pay gap report, to support a fairer and more inclusive workplace:
- embedded our values of collaboration, inclusion, and learning and improvement into the annual appraisal process by setting clear expectations and using shared tools and guidance to help teams put these values into practice
- rolled out the mandatory Line Management Development Programme nationally, with over 80% of eligible managers completing the first phase
- reviewed and updated Special Leave and Flexible Working policies, with improved accessibility and clearer guidance for staff and managers
- significantly improved self-declaration rates, reducing the numbers of ‘unknown’ responses and improving the completeness of our workforce data; this has enhanced the accuracy of our pay gap analysis, particularly in relation to disability
These actions continue to support our commitment to transparency, equity and inclusion, and are now being embedded into the wider Department of Health and Social Care (DHSC) integration programme to ensure continuity and long-term impact.
To build on this progress, we will:
- continue to monitor and report pay gap trends through the integration period, ensuring transparency and accountability
- work with DHSC colleagues to co-design inclusive leadership development pathways, influenced by our existing mentorship and sponsorship models
- ensure that high-potential individuals from underrepresented groups are identified and supported through transition, with a focus on retaining diverse talent
As NHS England integrates into the DHSC, we are taking deliberate steps to ensure that pay gap insights and equity actions actively inform key programmes of work and processes. This includes work in the following areas.
Governance alignment: pay gap information and inclusion metrics are being incorporated into the integration programme’s governance dashboards, ensuring visibility at programme board level.
Workforce planning: pay gap trends are informing workforce modelling and talent strategies, particularly in identifying underrepresentation in senior roles and targeting interventions.
Network engagement: staff networks are being actively engaged as part of the integration workstreams to ensure lived experience informs decision-making and transition planning. In addition, we are seeking their views on dedicated actions to further narrow our pay gaps, ensuring that solutions are co-designed with those most affected and aligned with our inclusion priorities.
Equality Impact Assessment (EQIA): pay gap data, alongside broader workforce data on protected characteristics, is being used to inform a robust EQIA for the integration programme. This will ensure that decisions made during the transition are equitable, evidence-based, and proactively address potential disparities. The EQIA will help to shape policy design, workforce changes, and service delivery models to mitigate unintended impacts and promote inclusion throughout the change.
Appendix A – statistical methodology
To assess whether any significant differences existed, we ran multiple linear regressions analyses. This allowed us to test if pay gaps between demographic groups (gender, ethnicity, disability and sexual orientation) changed during the period from 31 March 2024 to 31 March 2025. Applying regression analysis allows us to statistically test (using p-values) whether any changes observed are genuinely significant or could have occurred by chance, instead of depending solely on descriptive averages.
Method
- Y range: hourly pay for each employee.
- X range: coded protected characteristics (0 or 1) and date (0 = 2024, 1 = 2025).
- Interaction term: date × protected characteristics, used to determine whether pay gaps changed over time.
- Analysis: we examined the p-value for the interaction term. A p-value equal to or less than 0.05 indicates a statistically significant change; a p-value greater than 0.05 indicates no significant change.
Results
| Protected characteristics | P-value | Significance |
|---|---|---|
| Gender | 0.942 | No significant change |
| Ethnicity | 0.481 | No significant change |
| Disability | 0.177 | No significant change |
| Sexual orientation | 0.788 | No significant change |
Conclusion
All p-values were above 0.05, indicating that pay gaps for all protected characteristics did not change significantly between 2024 and 2025. Pay differences between groups have therefore remained stable over this period.
More detail on p-values
P-values in regression (summary)
A p-value shows whether an observed effect in regression is statistically significant or could have occurred by chance.
- Each regression coefficient has a p-value testing the null hypothesis that the coefficient = 0 (no effect).
- Low p-value (equal to or less than 0.05): strong evidence the variable affects the outcome (significant).
- High p-value (greater than 0.05): no significant effect; observed differences could be due to random variation.
How it’s calculated
- Regression estimates the coefficient ((β^ })) using least squares.
- Standard error (SE) measures uncertainty in the estimate.
- t-statistic = β^ / SE)
- P-value = probability of seeing such a t-statistic if the coefficient were actually zero.
In this analysis
- interaction term p-values show whether pay gaps changed significantly between 2024 and 2025
- all protected characteristics had p-values greater than 0.05, meaning there were no significant changes in pay gaps over time
Publication reference: PRN02342