
Introduction
In 2017, the government made it mandatory for all organisations with more than 250 employees to report on their gender pay gap every year.
This report is a snapshot of the gender pay gap at NHS England on 31 March 2023.
At that time, we were in the middle of a merger. NHS England and NHS Digital legally merged on 1 February 2023, followed by Health Education England (HEE) on 1 April 2023.
This report combines data from employee staff records across the 3 former organisations. Although HEE didn’t formally merge into NHS England until the day after this snapshot on 31 March 2023, it is treated in this report as being part of the new organisation.
Our approach is based on the government’s methodology for calculating differences in pay between men and women. ‘Equal pay’ means being paid equally for the same or similar work and ‘gender pay gap’ is the difference in average hourly pay between men and women.
What was our gender pay gap on 31 March 2023?
On 31 March 2023, NHS England employed 18,930 people. 64.6% of our workforce were women and 35.4% were men.
To measure the gender pay gap, we look at the difference between the average hourly rate paid to women and that paid to men. We calculate both median and mean averages for this.
On 31 March 2023, the mean gender pay gap at NHS England was 11.84%. This was calculated by adding all pay rates together and dividing by the total number of people.
We also calculated the median gender pay gap, which was 8.87% on 31 March 2023.
The median gender pay gap is the difference in hourly pay between the woman who would be in the middle if you lined up female employees from the lowest to the highest paid and the man who would be in the middle of a similar line-up of male employees. This way of looking at the pay gap avoids the influence of very high or very low salaries on the average.
While the gender pay gap for NHS England appears to have shrunk compared with 2021/22 (both the mean and median averages), this is not a like-for-like comparison. The March 2023 figure is for the combined new NHS England, including both NHS Digital and HEE; the “NHS England” figures for 2021/22 relate only to the former NHS England.
Figure 1: Mean gender pay gap trends at NHS England, NHS Digital and HEE between 2017/18 and 2022/23
| Organisation | 2017/18 | 2018/19 | 2019/20 | 2020/21 | 2021/22 | 2022/23 |
|---|---|---|---|---|---|---|
| NHS England | 19.30% | 18.58% | 16.65% | 16.20% | 14.72% | – |
| NHS Digital | 14.40% | 12.34% | 10.67% | 9.34% | 10.60% | – |
| Health Education England | 23.08% | 20.35% | 18.44% | 18.44% | 17.29% | – |
| New NHS England (combined) | – | – | – | – | – | 11.84% |
Table description
The table provides data and mean gender pay gap trends across fiscal years, comparing the three key organisations within England’s NHS and health education system.
- NHS England starts at 19.30% in 2017/18 and gradually decreases to 14.72% in 2021/22
- NHS Digital starts at 14.40% in 2017/18 and falls to 10.60% in 2021/22.
- Health Education England starts at 23.08% in 2017/18 and falls to 17.29% in 2021/22.
- the final row shows a combined figure for “New NHS England (combined)” in 2022/23, which is 11.84%
What is the proportion of men and women at different pay levels?
Women make up 51% of the general population of England and Wales* but occupied 55.43% of the highest paid jobs in NHS England (the upper quartile) on 31 March 2023.
Meanwhile, they occupied 73.38% of the 25% lowest paid jobs in the organisation (the lower quartile), with men occupying 26.62% of these roles. Men make up 49% of the general population.
*According to the 2021 Census
Figure 2: The proportion of men and women in each pay quartile on 31 March 2023
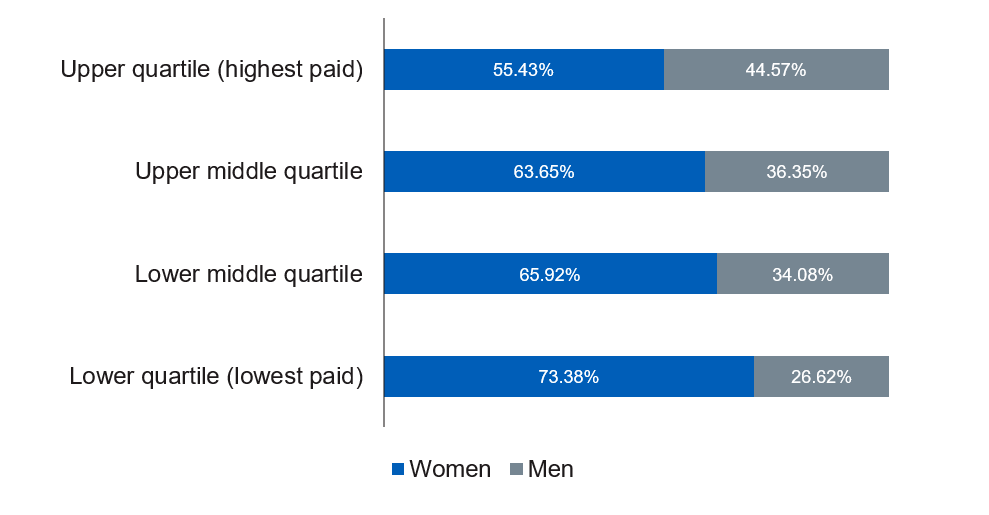
Image description
This chart illustrates the gender pay gap by comparing the distribution of women and men across different pay quartiles.
The pay quartiles are divided into lower quartile (lowest paid), lower middle quartile, upper middle quartile, and upper quartile (highest paid).
- lower quartile, 73.38% are women and 26.62% are men
- lower middle quartile, 65.92% are women and 34.08% are men
- upper middle quartile, 63.65% are women and 36.35% are men
- in the upper quartile, 55.43% are women and 44.57% are men
What are the gender pay gaps at different pay bands?
We have the highest proportion of women in pay bands 5 to 8a. The highest representation of men is at bands 8b and above.
Women in pay bands 2 to 7 earn higher salaries than men at the same bands, while men earn significantly more than women at bands 8b and above. In both cases, these differences are likely to be influenced by factors including length of service and part-time and full-time hours.
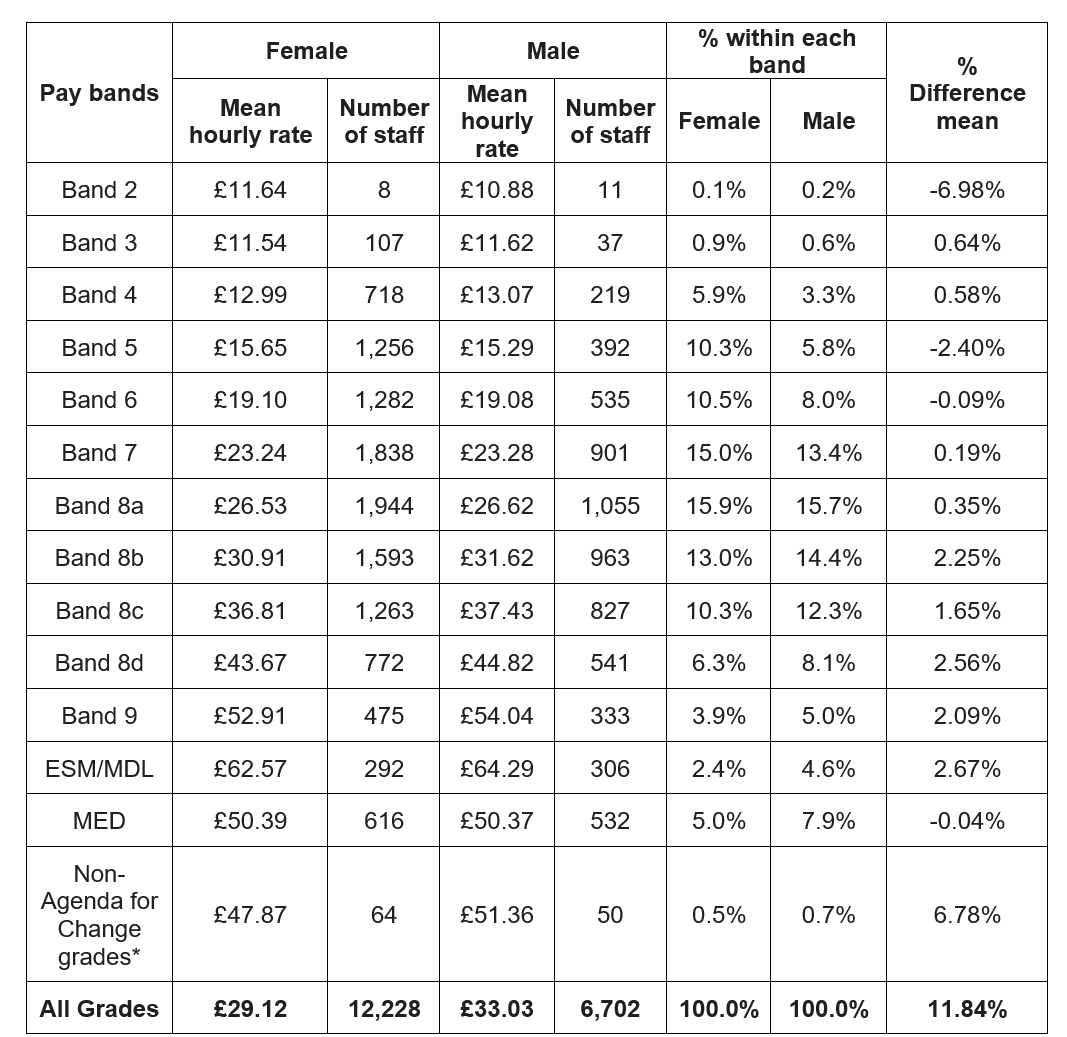
*Non-Agenda for Change grades reflect staff that have been transferred from other organisations where their employment terms and conditions and salaries have been retained (for example, Public Health England, the University of London and Monitor).
Image description
The image is a comprehensive pay data table that provides insights into the gender pay gap within the organization. The table covers a range of pay bands, from Band 2 to Band 9, as well as senior management (ESM/MDL), medical (MED), and non-agenda for change grades.
For each pay band, the table shows the mean hourly rate for both female and male staff, as well as the number of staff in each gender. The percentage of female and male staff within each pay band is also provided, giving a clear indication of the gender distribution across the different roles and levels.
The final column in the table calculates the percentage difference in mean pay between female and male staff. This allows for a direct comparison of the gender pay gap across the various pay bands and grades.
What is the gender pay gap for bonuses?
NHS England does not provide bonus payments, in line with the Agenda for Change terms and conditions of service.
We honour clinical excellence award (CEA) payments. CEAs are awarded by NHS employers and have been protected to attract and retain exceptional clinical skills and expertise.
The mean gender pay gap for CEA payments in NHS England is 40.06%. The median gender pay gap for CEA payments is 72.22%.
Actions we are taking
Structural aspects of NHS England’s workforce, along with those of the broader NHS health and care sector, contribute to our gender pay gap. We have many more women at lower pay bands than men. The percentage of women sharply declines at higher pay bands compared to entry level positions, although women are still in the majority. This is unacceptable and we are determined to do better.
Effective policies for closing the gender pay gap seek to address factors and barriers common to all women and target inequalities faced by women belonging to specific groups, based on characteristics such as ethnicity, age and profession.
To reduce our pay gap over the next year we will:
- develop talent management strategies tailored to specific staff groups, such as those in data and analytics and digital roles, so women are supported in their development
- listen to our staff, including by working with staff networks, to understand how development can be improved across and within different groups
- improve our recruitment practices following the organisational change programme, so women are not unfairly disadvantaged
- further develop mechanisms to attract and retain applicants and employees from diverse communities
We are also reviewing other factors influencing the pay gap, so we can take further action, including:
- the gender balance of part-time and full-time workers and the effect on average hourly pay rates of part-time and full-time employment
- differences in length of service
- who is receiving London weighting
- the impact of staff turnover
Definitions, assumptions and scope
All employee data contained in this report is extracted from NHS England’s Electronic Staff Record system, showing a snapshot as of 31 March 2023. The reporting period covers 1 April 2022 to 31 March 2023.
Hourly rates are calculated using base pay, allowances and bonus pay (where applicable), based on government published guidelines.
Publication reference: PRN01261