
Executive summary
This briefing draws on official statistics published here.
- There was a total of 2,389,064 attendances at A&E departments across England in March. The average daily attendances increased to 77,067 which is 3.6% higher than the daily average in February and 0.8% higher than March 2024.
- 75.0% of patients were admitted, transferred or discharged within four hours, which is below the NHS constitutional standard of 95%. This is an improvement from 73.4% in February 2025 and 74.3% in March 2024.
- The average ambulance response time for category 2 calls was 28 minutes and 34 seconds. This has decreased from 31 minutes and 22 seconds in February 2025 and 33 minutes and 51 seconds in March 2024. This is below the 30 minute target for the year but not the NHS constitutional standard of 18 minutes.
- As of the end of February, there were 7.40 million waits for treatment, a reduction of 26,000 from January 2025. There were 193,516 waits of more than 52 weeks for treatment at the end of February, compared to 304,919 at the end of February 2024 (down 36.5%) and 198,868 at the end of January 2025 (down 2.7%).
- Waits of more than 65 weeks for treatment was 13,223 at the end of February, reduced compared to 75,004 at the end of February 2024 (down 82.4%) and 14,975 in January 2025 (down 11.7%).
- Performance against the 28 day faster diagnosis standard to reduce the time between referral and diagnosis of cancer was 80.2% in February 2025. This is above the NHS constitutional standard of 75% and represents a 6.8 percentage point increase from January 2025. It conforms to seasonal improvements in performance that are commonly observed each February.
- The Individual Placement and Support service (IPS) is for individuals with severe mental illness (SMI) or complex mental health needs who want to gain or retain paid, competitive employment. The IPS Expansion programme aims to support an additional 140,000 to access IPS services by 2028/29. In February 2025, 42,796 people were reported to have accessed an IPS service in the prior 12 months, which is an increase from 42,254 in January 2025.
Urgent and emergency care
Urgent and emergency care services continued to face high demand in March.
There was a total of 2,389,064 attendances at A&E departments across England in March. The average daily attendances increased to 77,067, this is 3.6% higher than February’s daily average and 0.8% higher than March 2024.
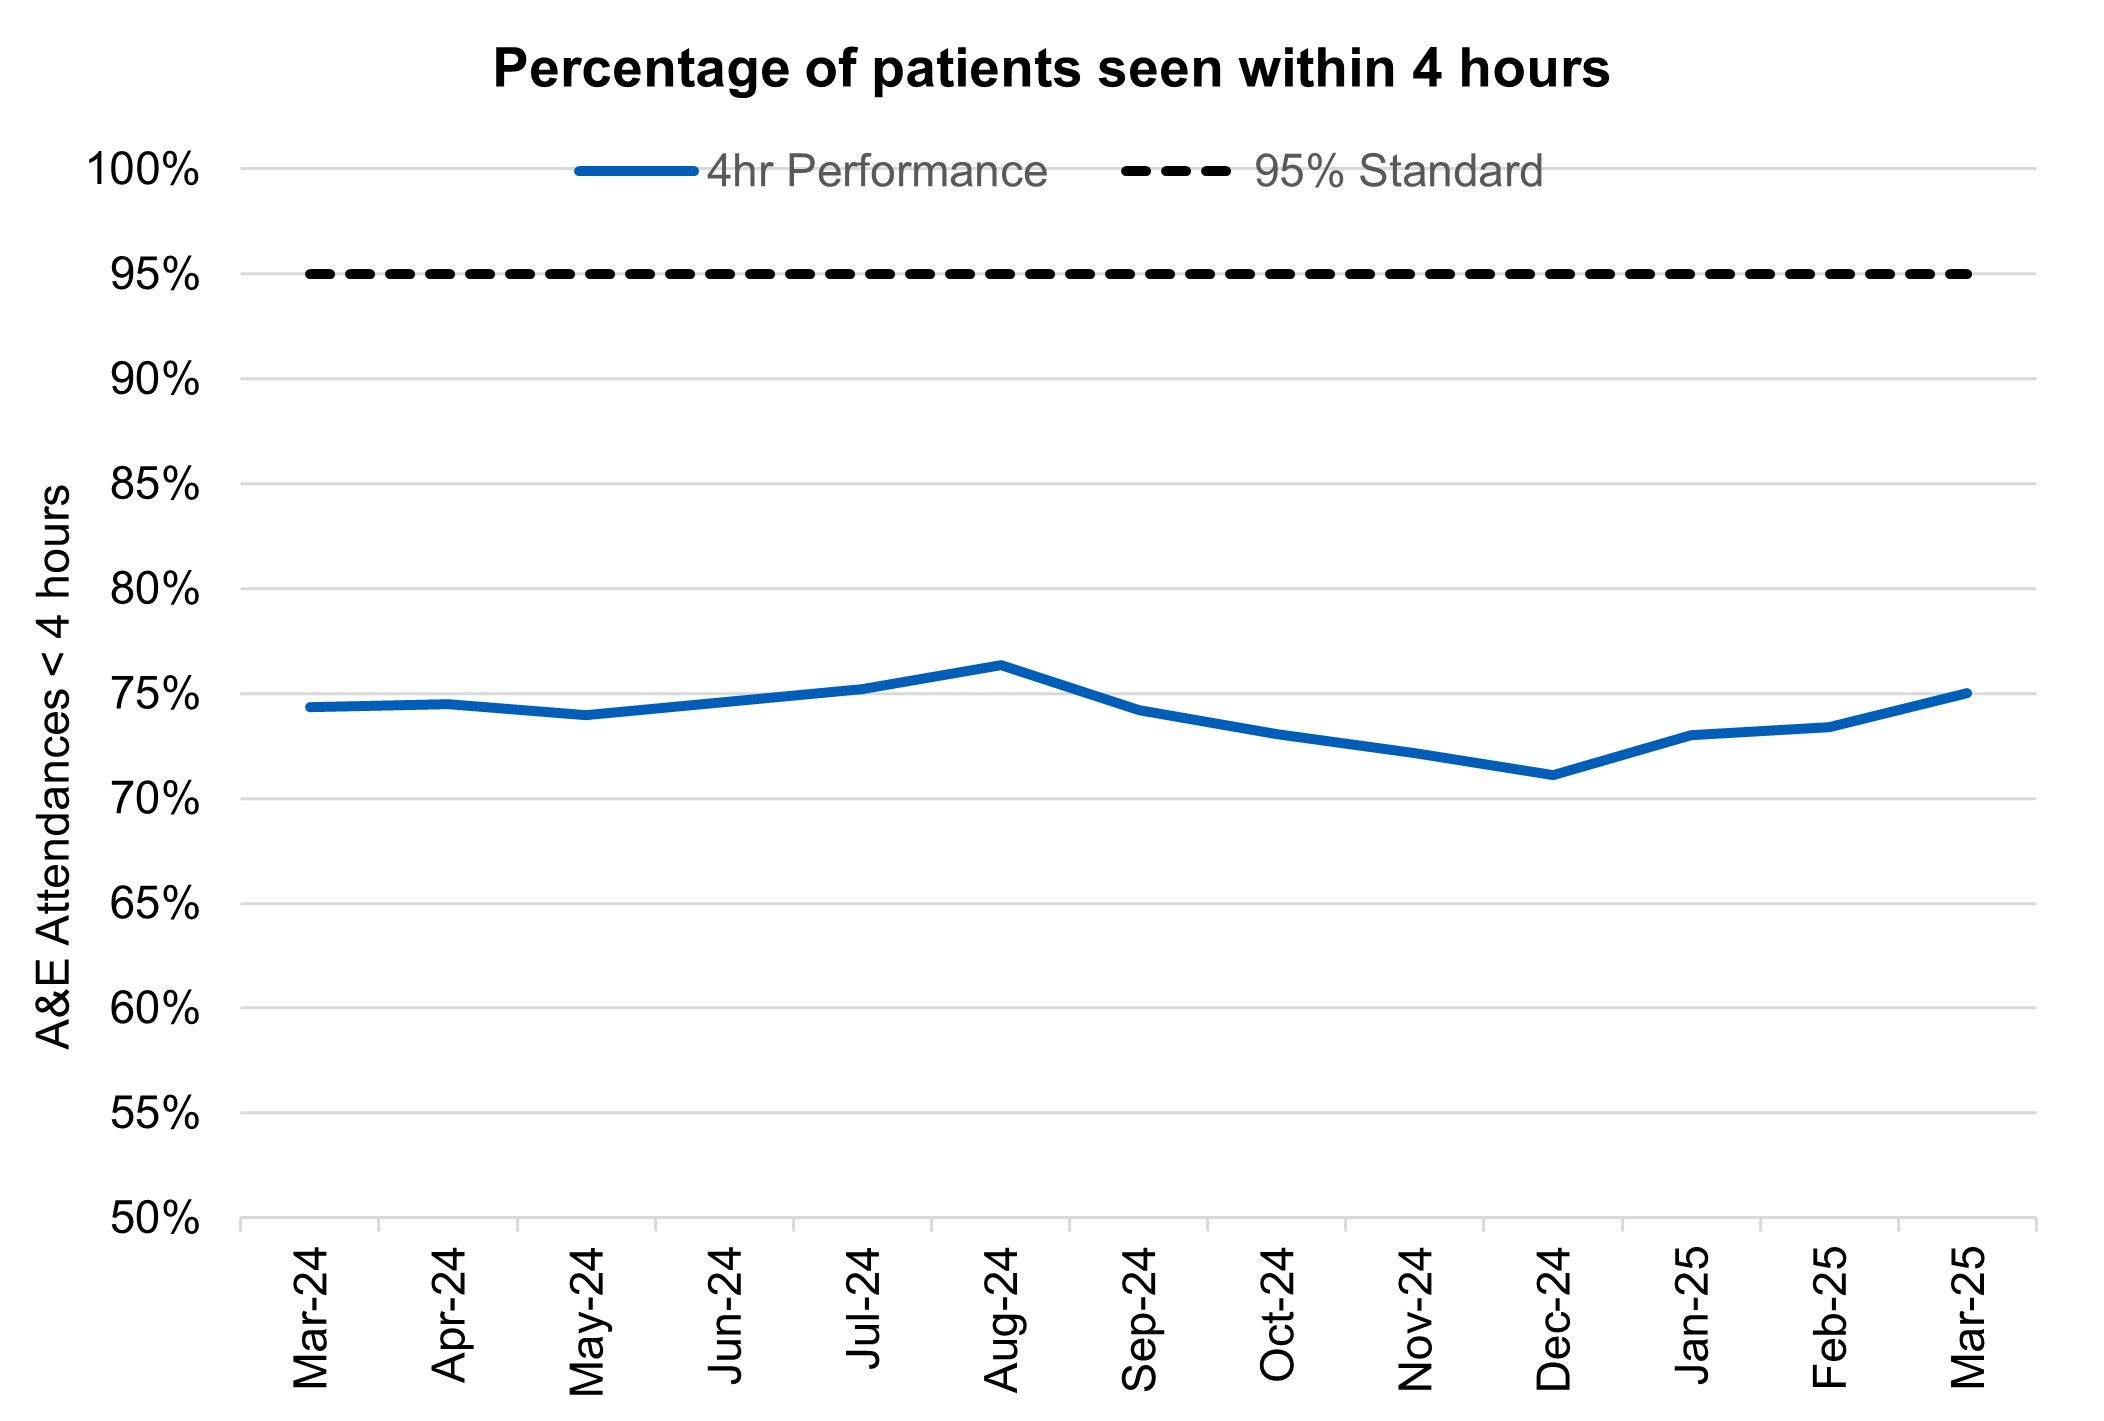
75.0% of patients were admitted, transferred or discharged within four hours, which is below the NHS constitutional standard of 95%. This is an improvement from 73.4% in February and 74.3% in March 2024.
The provisional figures published for March indicate that 9.7% of patients attending a type 1 A&E department spent 12 hours from arrival in A&E compared with 11.3% last month.
Percentage of patients seen within 4 hours
Ambulance services answered 795,279 calls to 999, or 25,654 per day, a decrease of 2.2% compared to February 2025 and 0.3% less than March 2024. There were 385,841 incidents where a patient was conveyed to A&E or 12,446 per day, 0.9% per day more than in both February 2025 and March 2024.
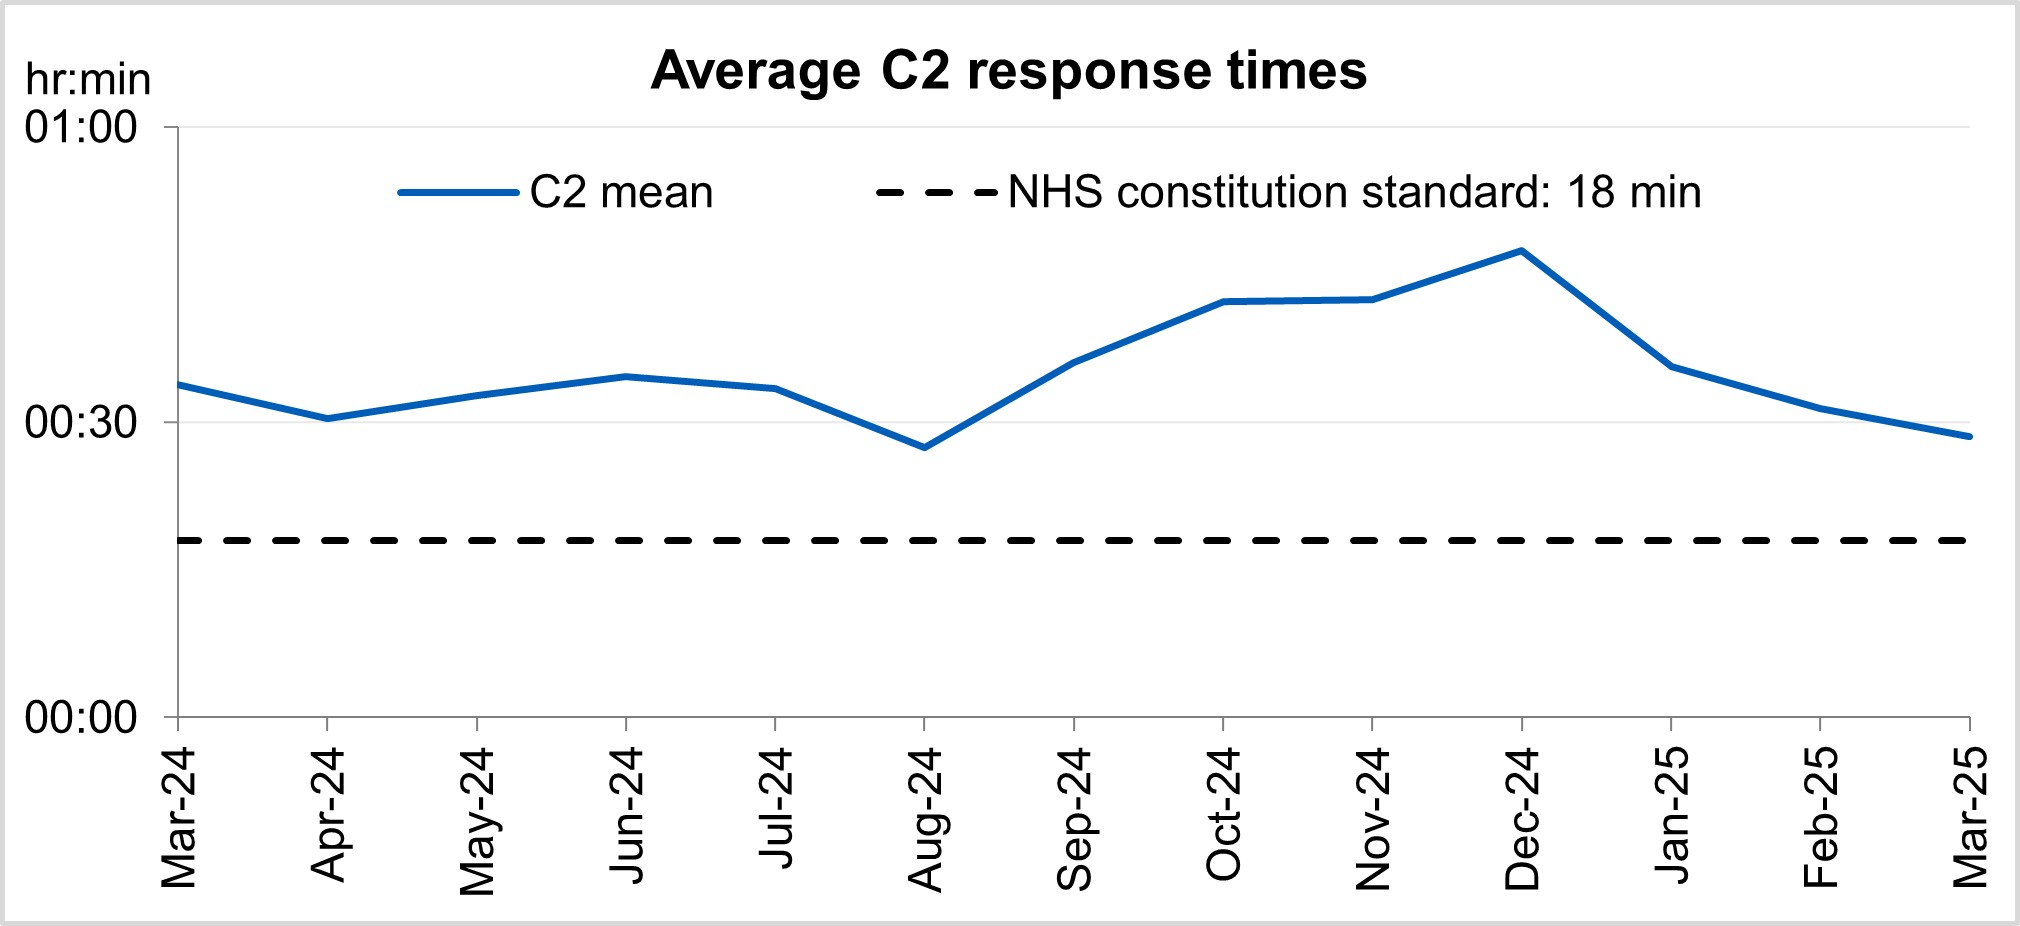
The average ambulance response time for category 2 calls was 28 minutes and 34 seconds. This has decreased from 31 minutes and 22 seconds in February 2025 and 33 minutes and 51 seconds in March 2024. This is below the 30 minute target for the year but not the NHS constitutional standard of 18 minutes.
Average C2 response times
‘Hear and Treat’ clinical teams have been embedded in all ambulance control centres to increase the number of patients who can be appropriately treated over the phone. 999 calls are responded to by an ambulance service over the phone instead of sending an ambulance, with a clinician giving treatment and advice remotely. Since March 2024, 16% of all ambulance calls across England were handled by ‘Hear and Treat’, meaning they did not require an ambulance to be dispatched.
As well as improving outcomes for patients, ‘Hear and Treat’ also reduces pressure on Emergency Departments and improves ambulance response times.
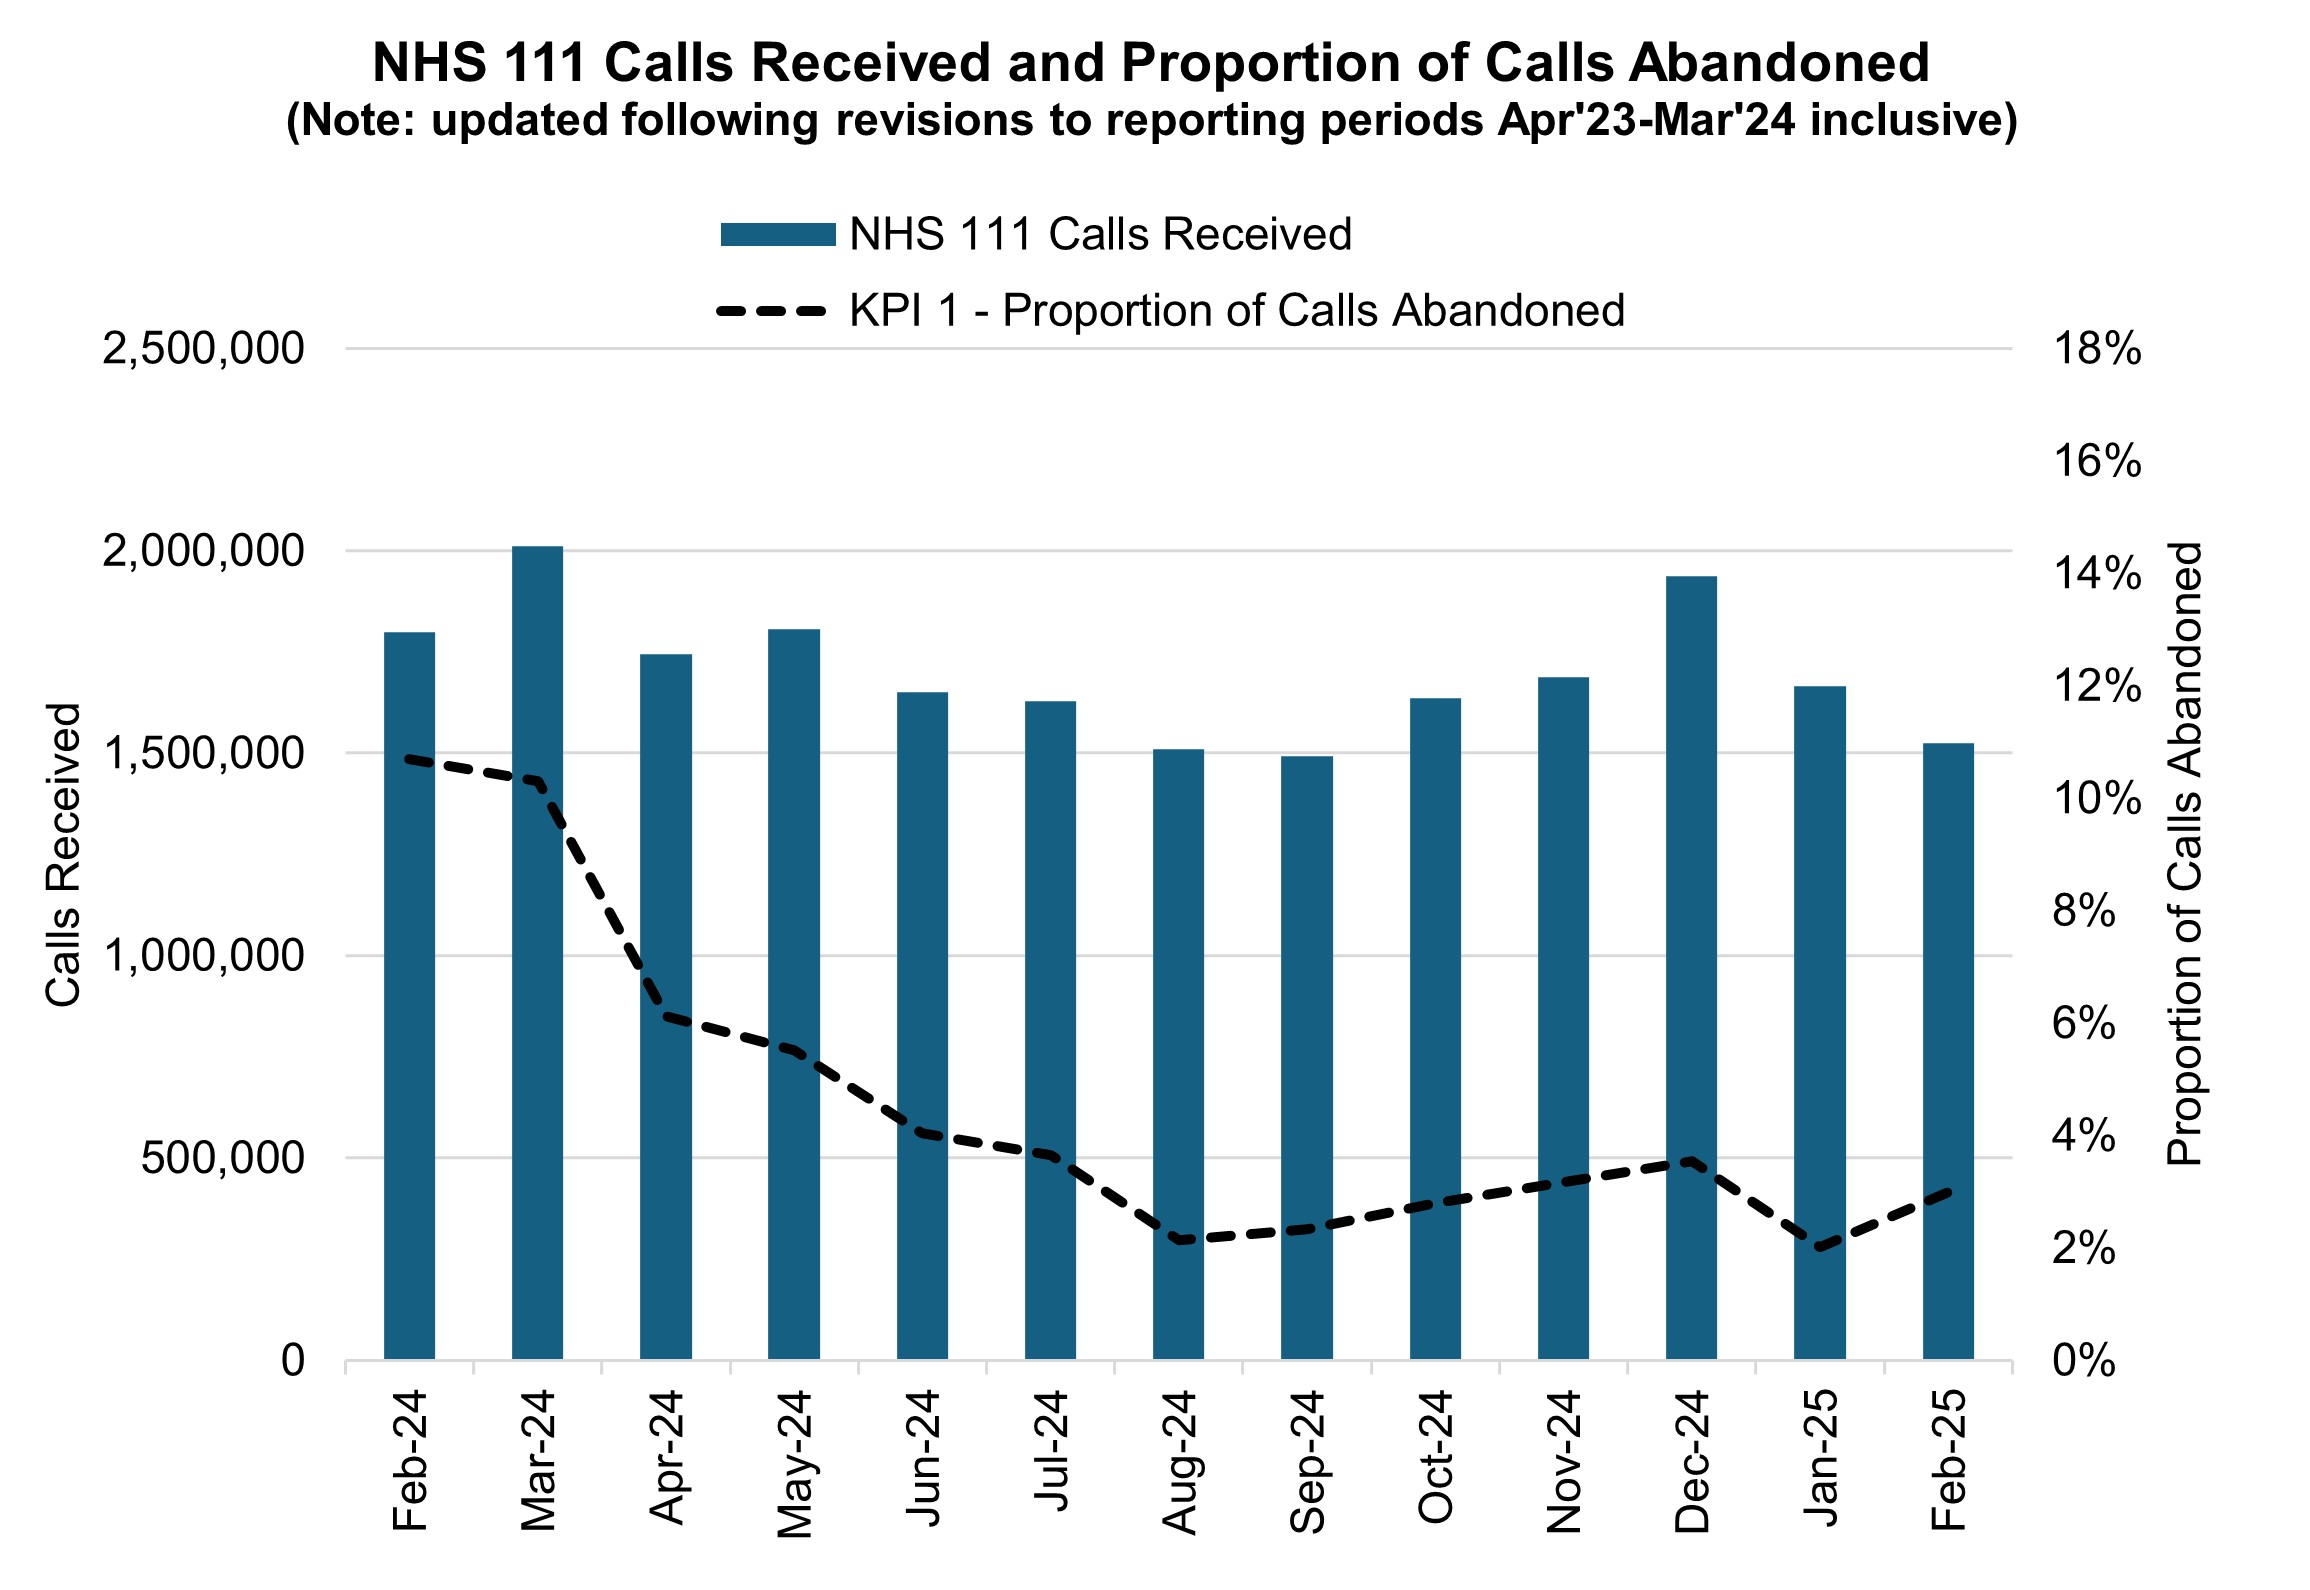
NHS 111 received 1.52 million calls (c. 54.5 thousand per day) in February 2025. Demand per day was 12% down year on year, but 1% up on January 2024. The proportion of calls abandoned increased 1.0% percentage points from the previous month (now at 3.0%) and the average speed to answer increased by 19 seconds to 57 seconds.
NHS 111 calls received and proportion of calls abandoned
Elective recovery
Elective care covers a broad range of planned, non-emergency services – from diagnostic tests and scans to outpatient appointments, surgery and cancer treatment.
As of the end of February, there were 7.40 million waits for treatment, a reduction of 26,000 from January 2025. The estimated number of patients waiting for care at the end of February was 6.24 million people. Of the 7.40 million pathways on the waiting list in February 25, 1.20 million had a decision to be admitted for treatment.
While NHS staff have worked extremely hard in the aftermath of the pandemic to tackle the elective backlog – reducing long waits and treating the most clinically urgent cases – the NHS is a long way from meeting the required constitutional standard. The Elective Reform Plan was launched in January 2025, which sets out our intention to return to delivery of the constitutional standard: 92% of patients on the waiting list should have been waiting no longer than 18 weeks from referral to treatment.
To meet the 18-week standard and reform elective care by March 2029, we are focusing on empowering patients by giving them more choice and control, reforming delivery by working more productively, delivering care in the right place and aligning funding, performance oversight and delivery standards.
The ambition for 18 weeks performance is to reach the constitutional standard of 92% by March 2029 and 65% by March 2026, the current position is 59.2% (up 0.3 percentage points from January 2025).
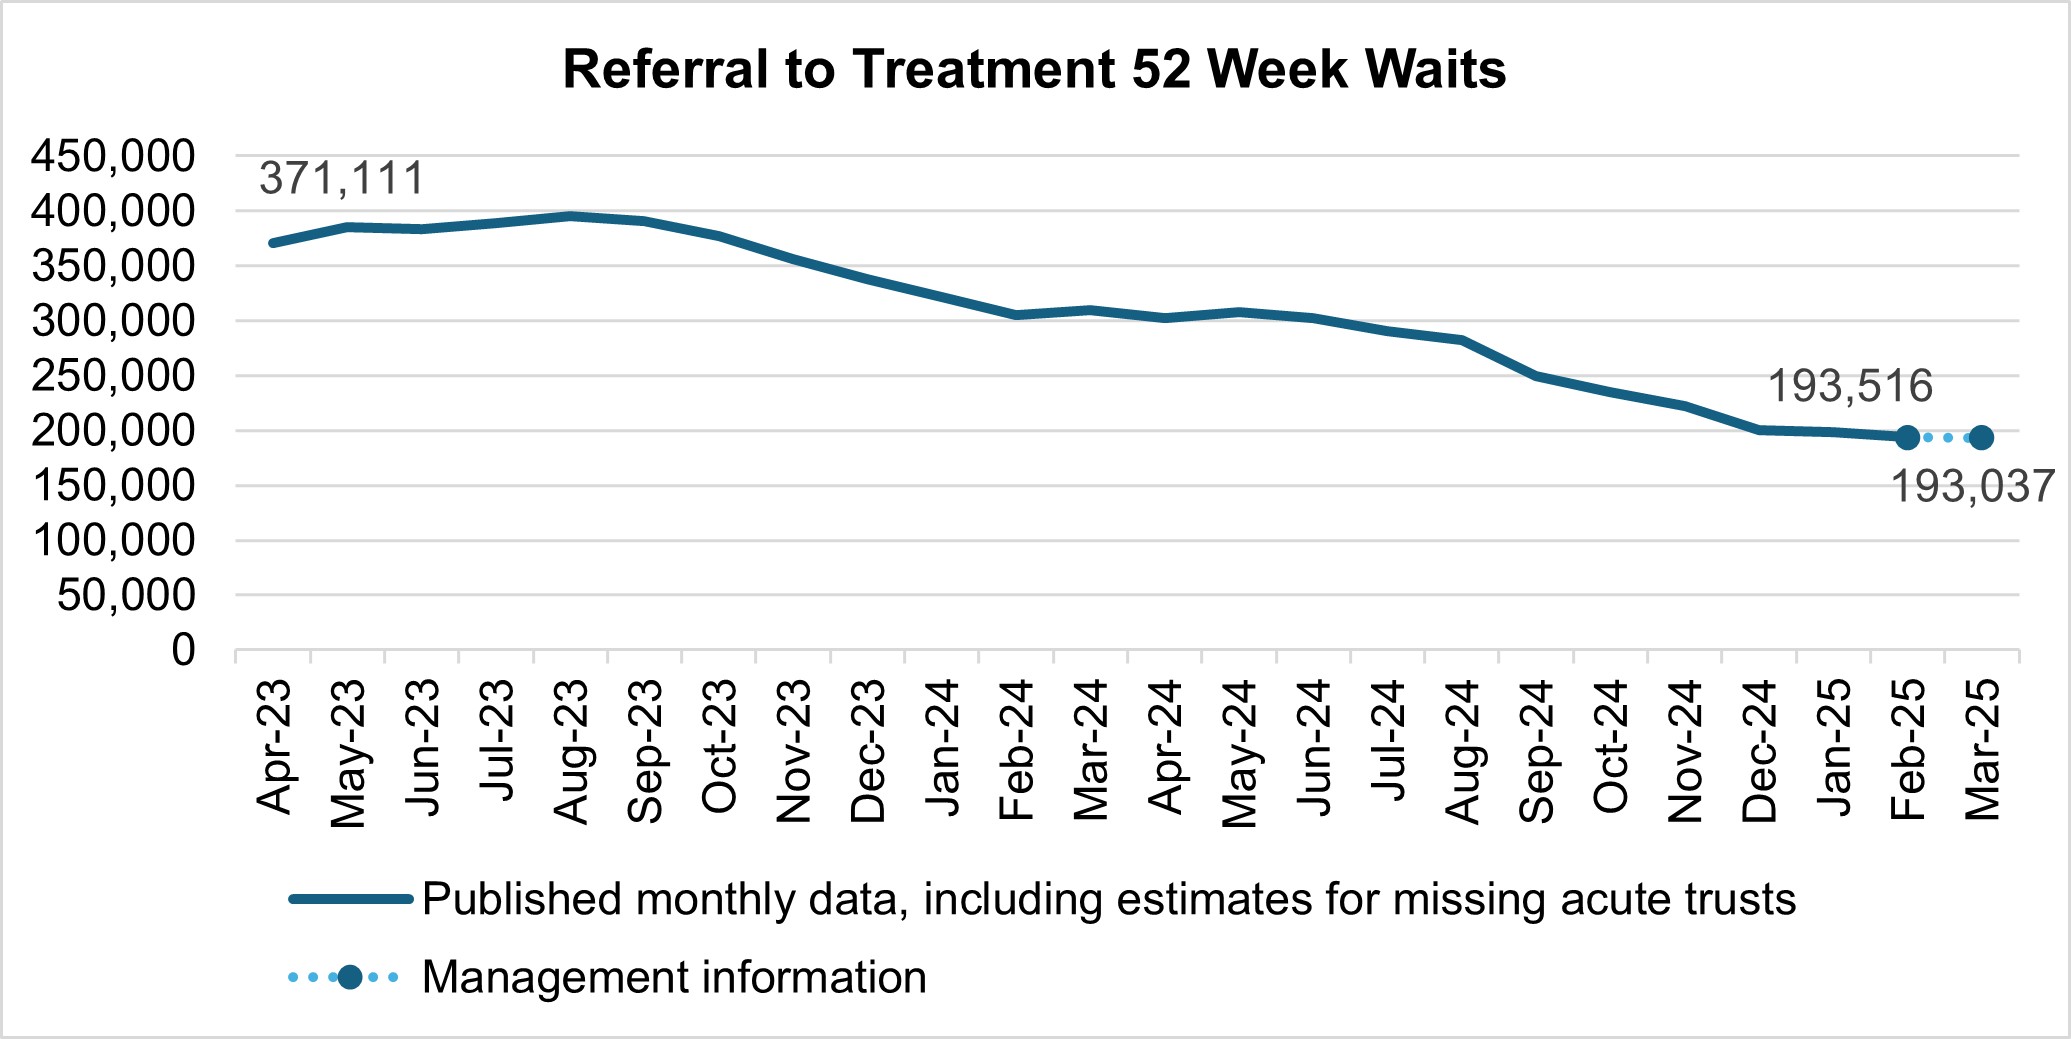
There were 193,516 waits of more than 52 weeks for treatment at the end of February, compared to 304,919 at the end of February 2024 (down 36.5%) and 198,868 at the end of January 2025 (down 2.7%). Additional management data* suggests there were 193,037 waits of more than 52 weeks as of the end of March.
*Management information for the latest month is taken from the Waiting List Minimum Dataset (WLMDS). Figures include data up to week ending 30 March 2025. WLMDS data is subject to less validation than the published monthly figures. All acute trusts submitted data for week ending 30 March 2025.
Referral to treatment 52 week waits
As we shift the focus to the 18 week standard, we will continue to ensure that the longest waits are tackled and the number of patients waiting unacceptably long times continues to reduce. in March 2025 this is currently 2.6%.
Waits of more than 65 weeks for treatment was 13,223 at the end of February, reduced compared to 75,004 at the end of February 2024 (down 82.4%) and 14,975 in January 2025 (down 11.7%). Additional management data suggests there were 8,450 waits of more than 65 weeks for treatment as of the end of March.
There has been a reduction in the longest waits for care, 1,691 patients were waiting more than 78 weeks for treatment at the end of February, compared to 9,969 at the end of February 2024 (down 83.0%) and 2,005 in January 2025 (down 15.7%). Additional management data suggests there were 1,069 waits of more than 78 weeks for treatment as of the end of March.
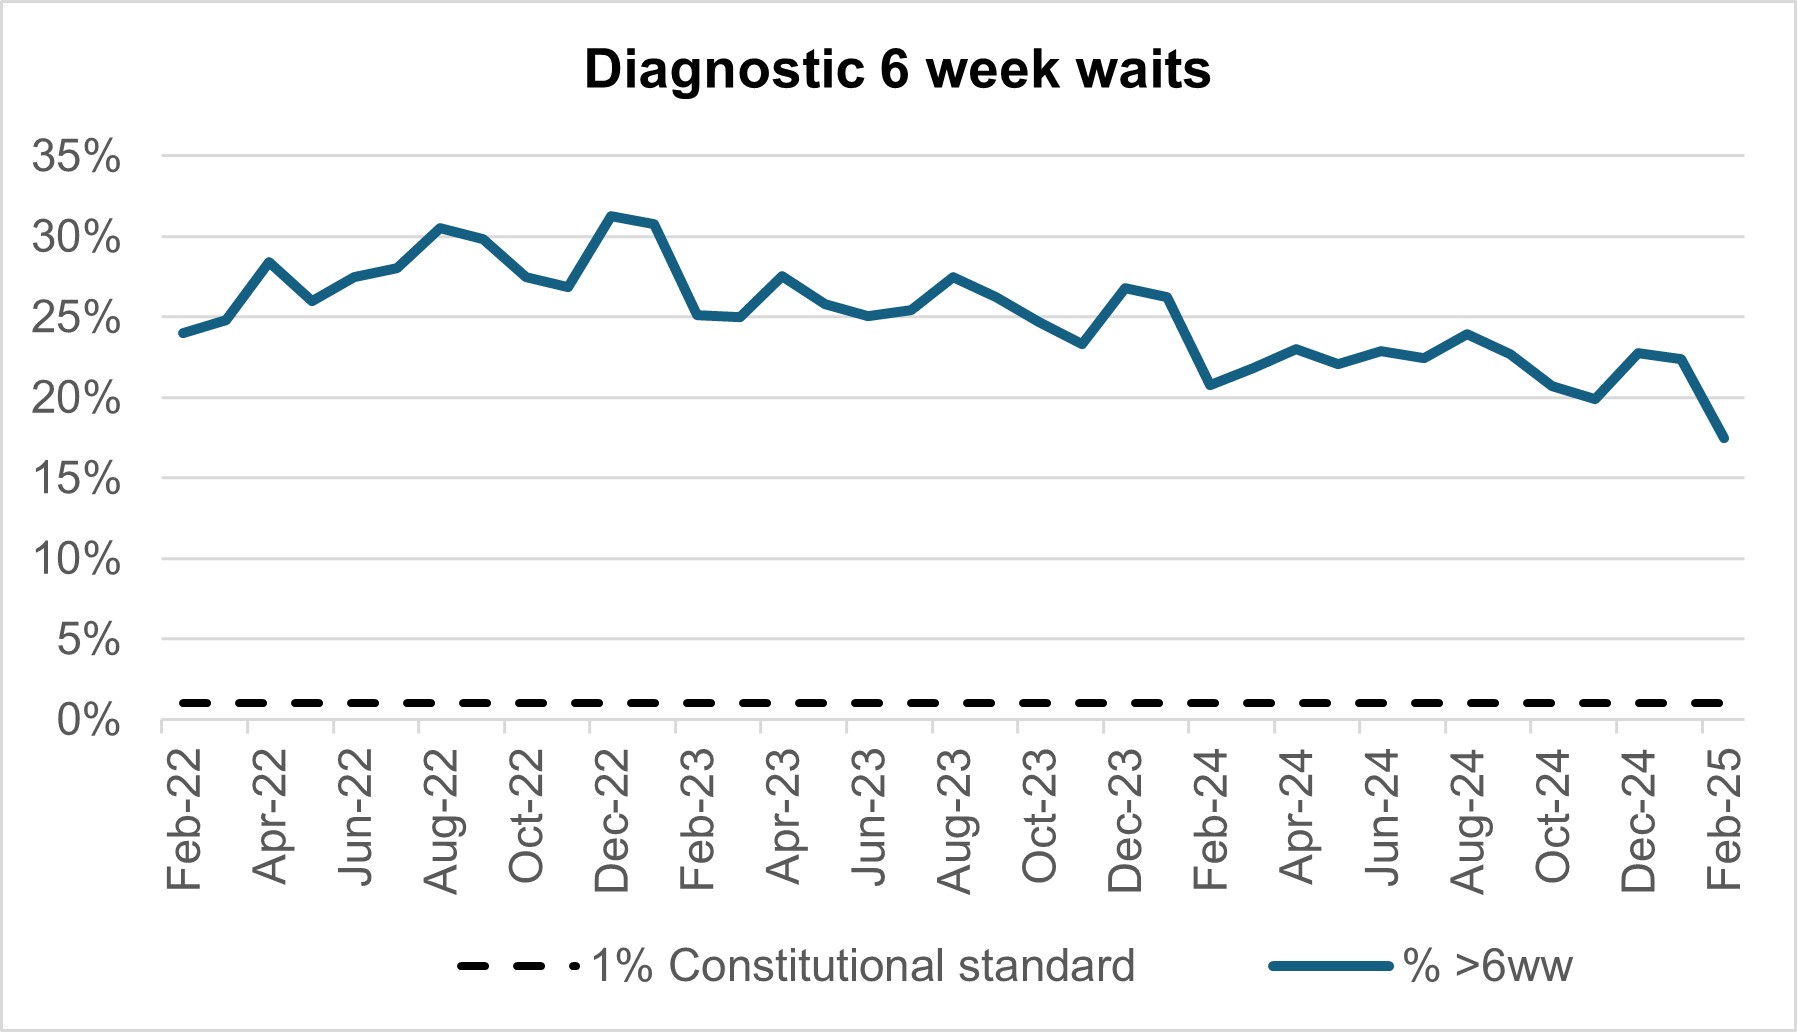
More than 2.3 million diagnostic tests were delivered in February, 4.1% higher than the same month last year (2.2 million in February 2024). At the end of February, on the diagnostic waiting list there were 1.67 million waits, of which 291,000 had waited 6 weeks or more. The percentage of 6 week waits was 17.5%, down from 22.4% in January 2025. Progress is being made towards the interim recovery target of not more than 5% of the waiting list over 6 weeks and an increased percentage of diagnostic activity is supplied by Community Diagnostic Centres.
Diagnostic 6 week wait
By providing a wider range of and capacity for tests and more consulting rooms, CDCs can improve elective pathways for both urgent cancer pathways and routine diagnostic pathways. There are 1.67 million waits for the 15 major diagnostic tests and demand is rising. With 170 community diagnostic centres (CDCs) up and running by the end of March 2025, these centres can take on more of the growing diagnostic demand within elective care.
Cancer
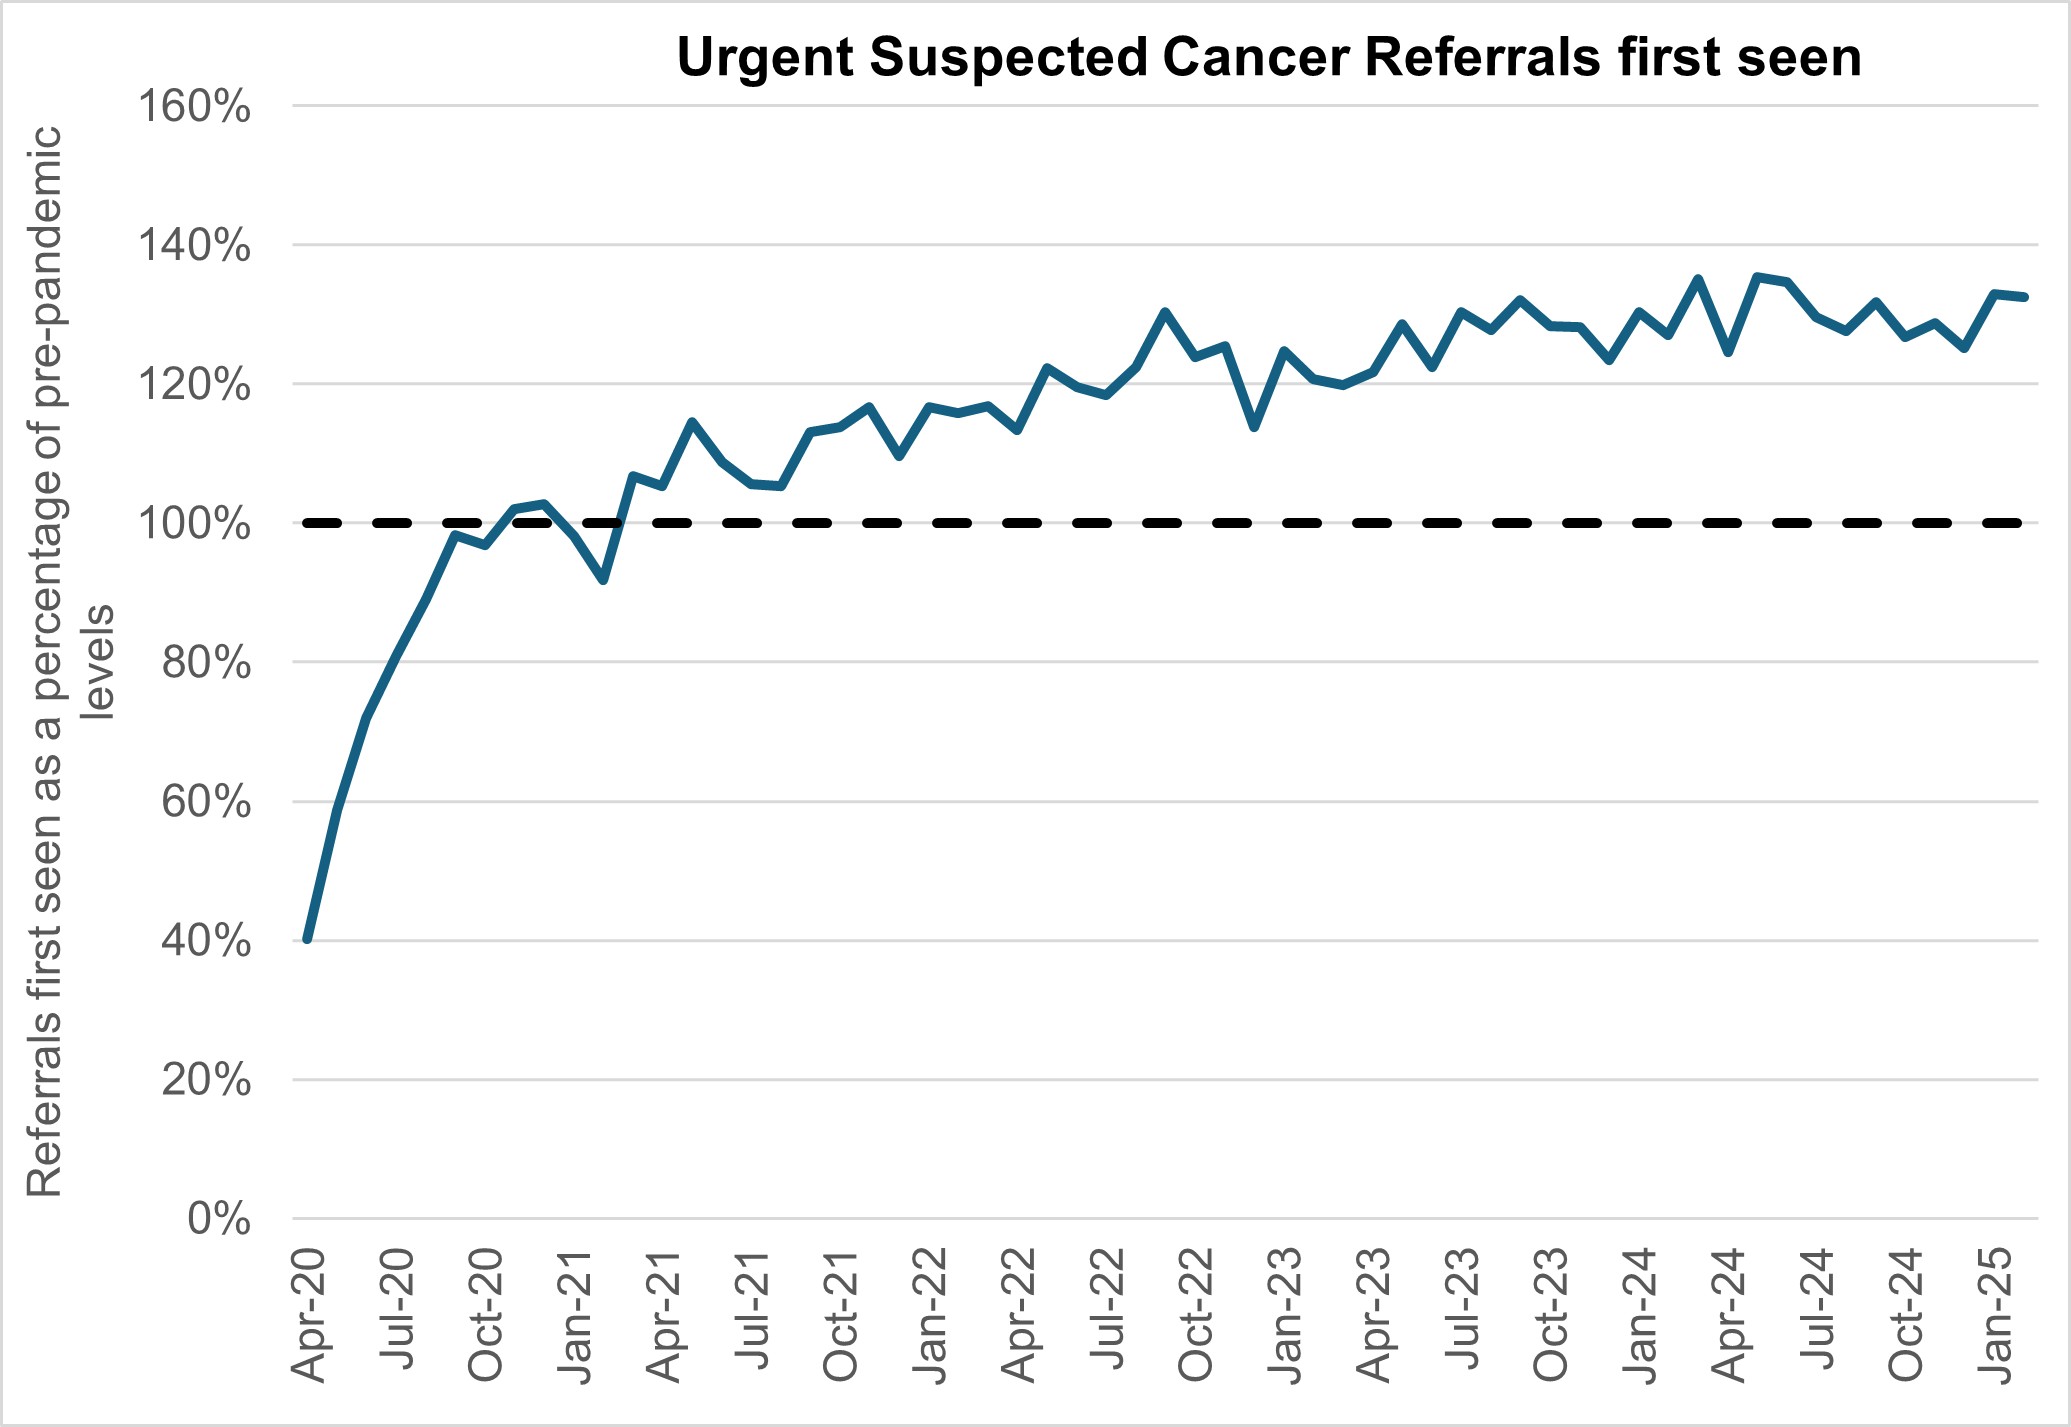
Levels of Urgent Suspected Cancer referrals have remained at high levels, with 12,615 referrals per working day in February 2025. This is 33% more referrals than the NHS was seeing before the pandemic – the equivalent of ~3,100 more referrals per working day.
Treatment activity was also at a record high level with over 1,400 patients starting cancer treatment per working day, 15% above pre-pandemic levels.
Urgent suspected cancer referrals first seen
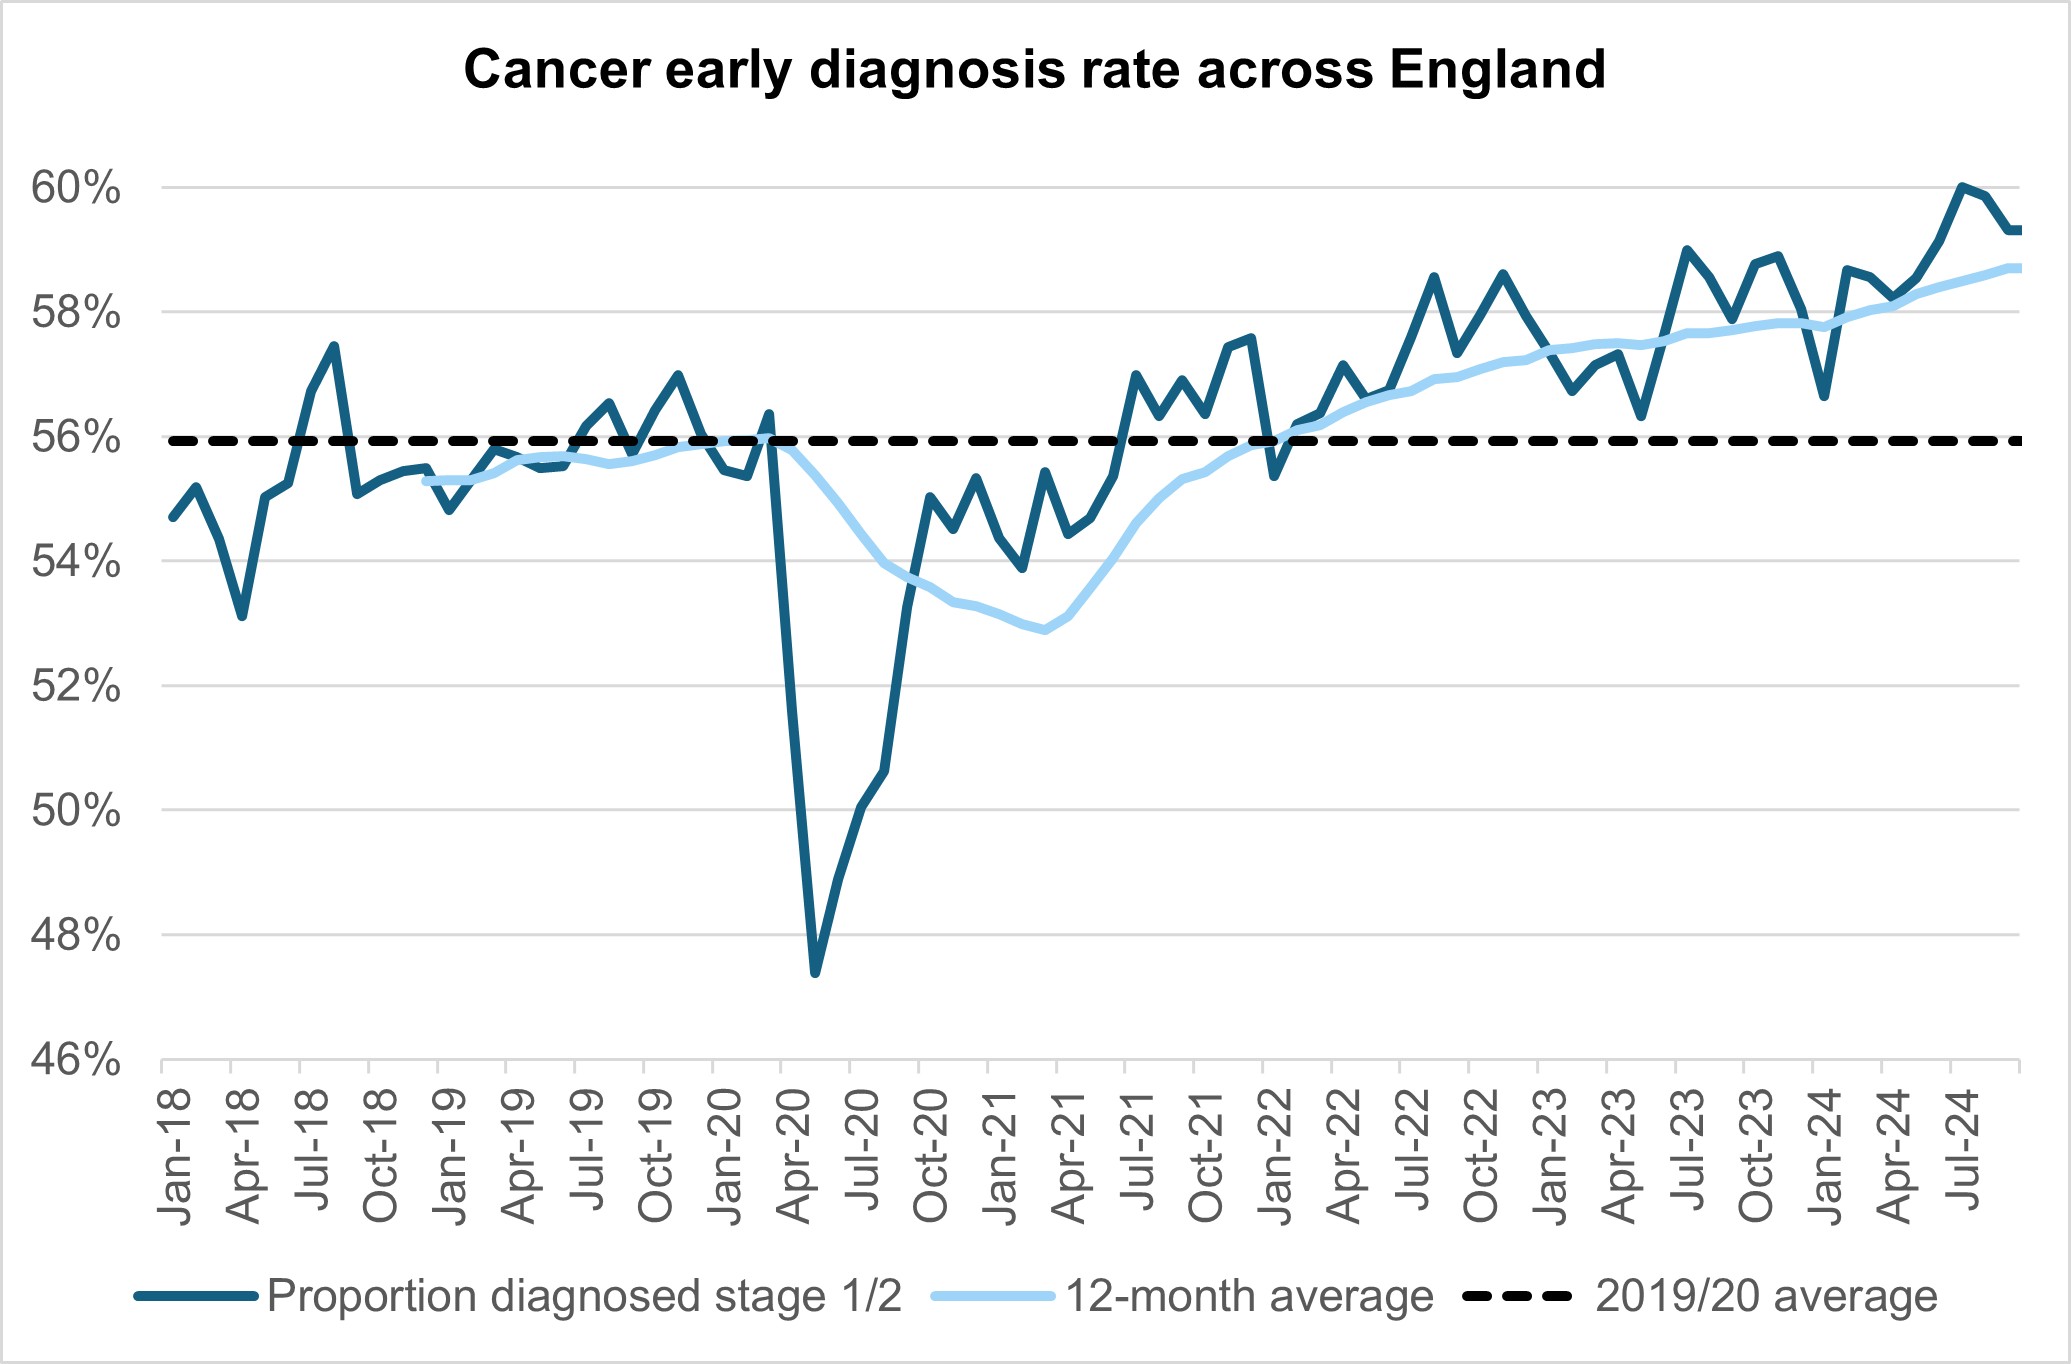
The increase in referrals has also contributed to increases in early diagnosis, which are now about 2 percentage points higher than before the pandemic, cancer survival also continues to improve.
Cancer early diagnostic rates across England
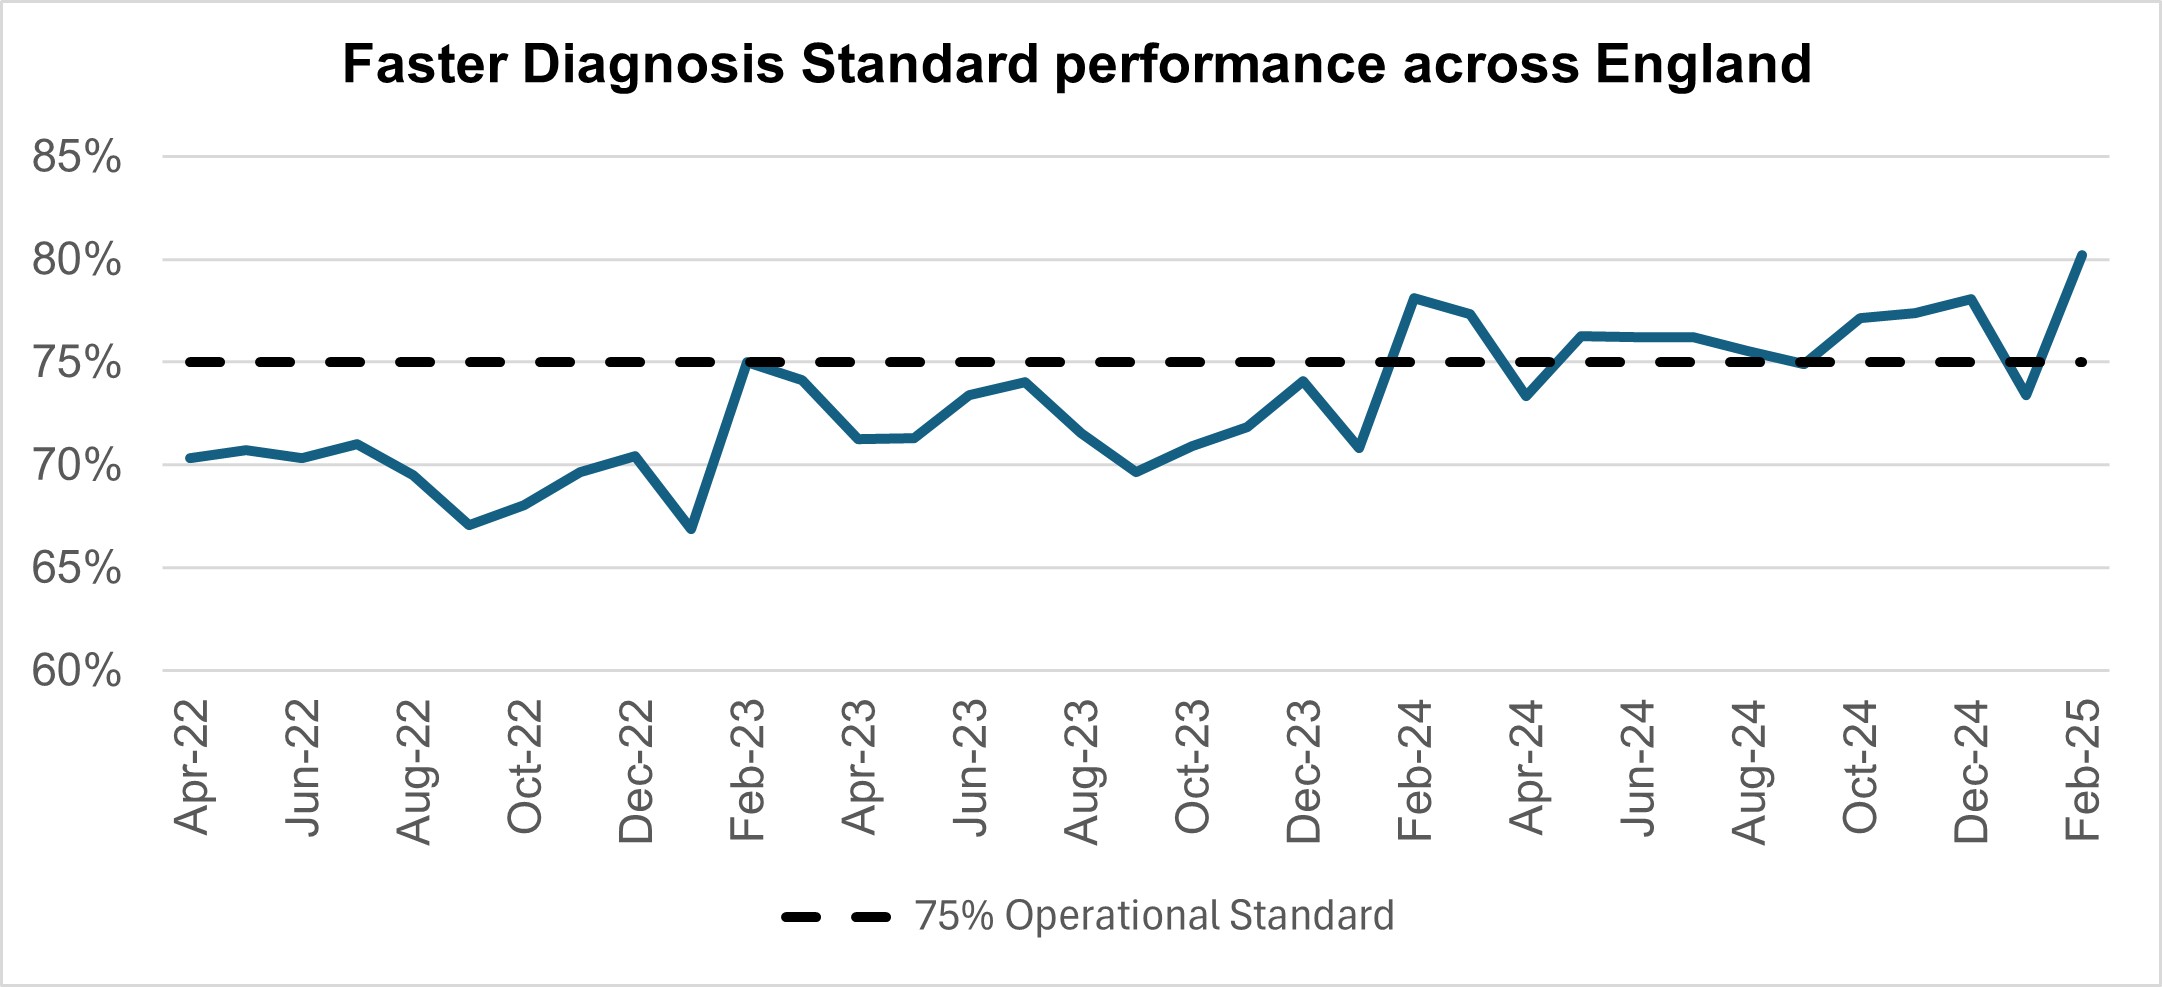
The NHS is working hard to keep up with this increase in demand. It has been accelerating the installation of new diagnostic capacity, much of it in Community Diagnostic Centres. Performance against the 28 day faster diagnosis standard to reduce the time between referral and diagnosis of cancer was 80.2% in February 2025. This is above the NHS constitutional standard of 75% and represents a 6.8 percentage point increase from January 2025, it conforms to seasonal improvements in performance that are commonly observed each February. Performance for February 2025 represents a 2.1 percentage point increase compared to the same point last year.
Faster diagnosis standard performances across England
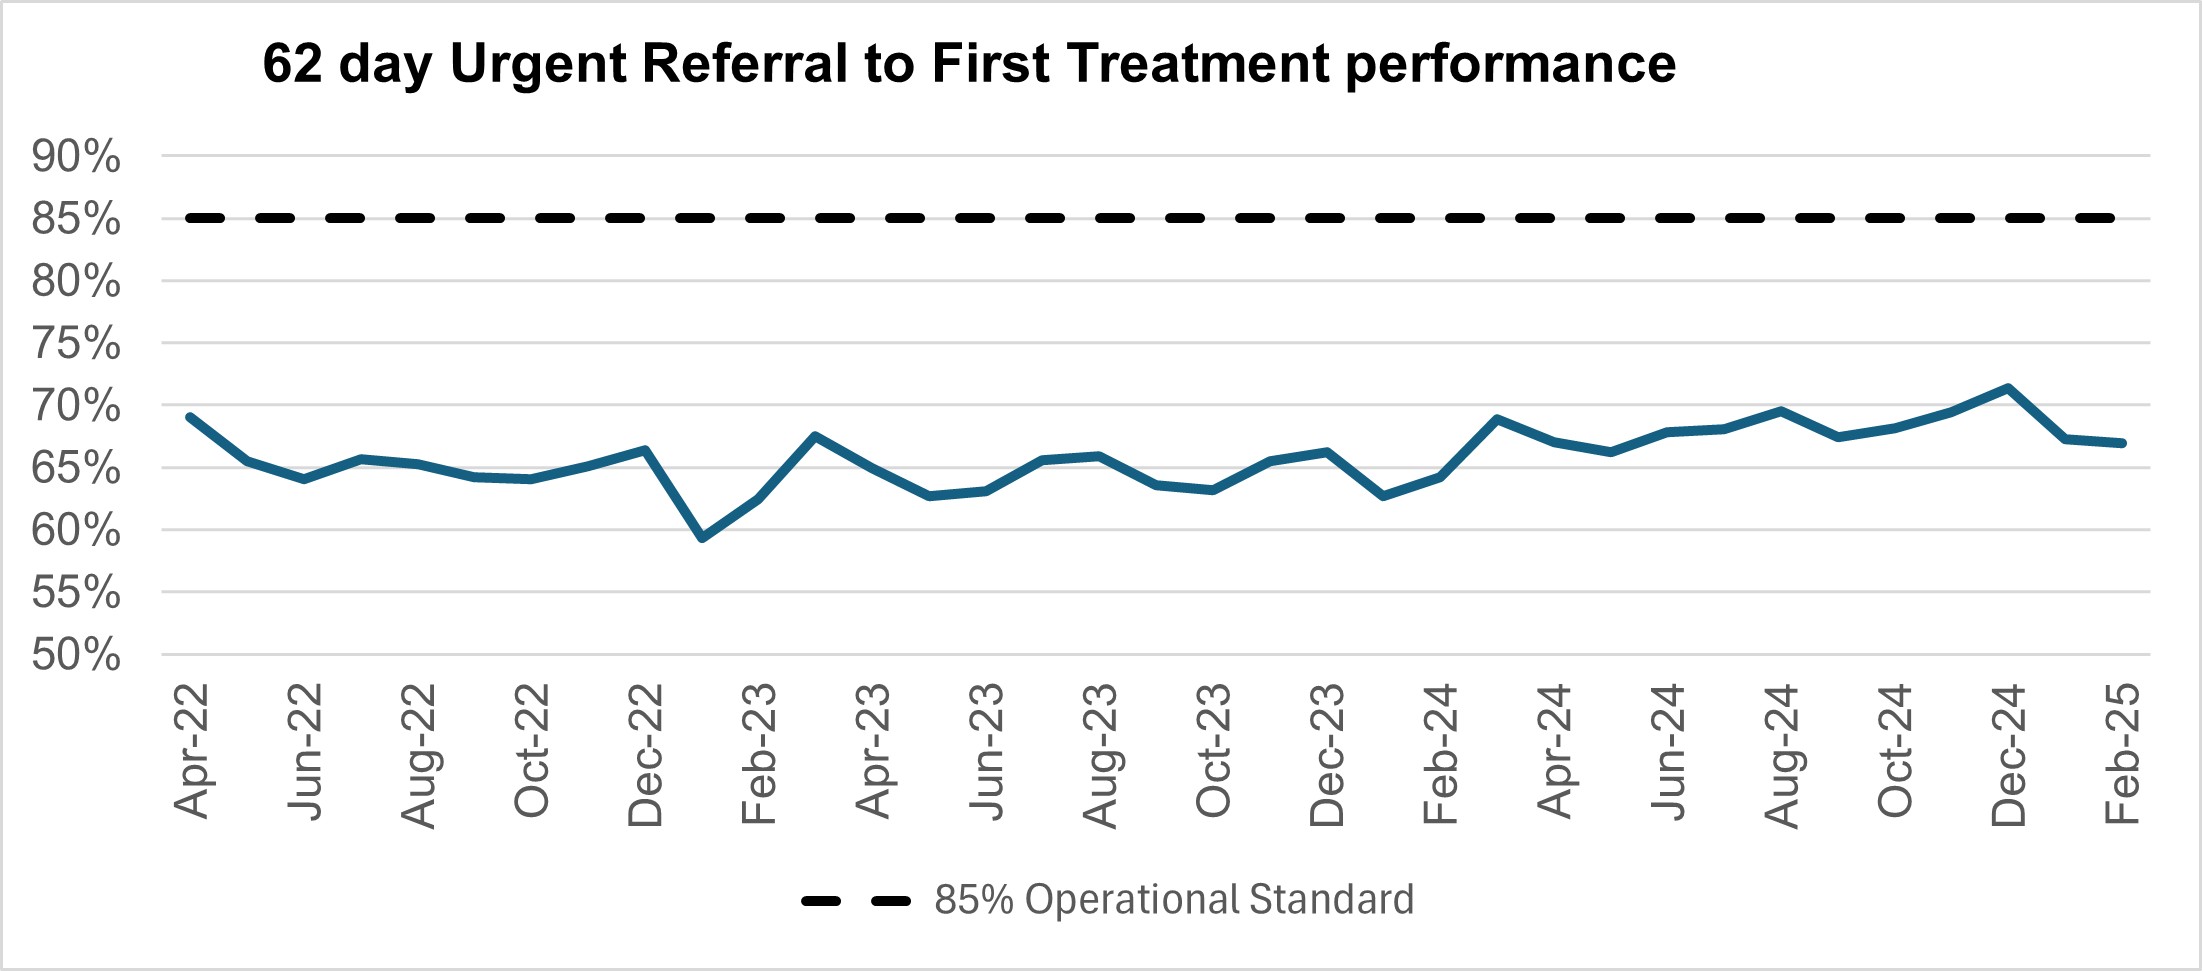
Performance against the 62 day Urgent Referral to First Treatment Standard to begin first definitive treatment of an urgent suspected cancer referral, breast symptomatic referral, urgent screening referral or a consultant upgrade was 67.0% in February 2025. This was 0.3 percentage points lower than January 2025. February’s 2025 performance was 2.8% higher than the same point last year, but still below where we want to see it. The NHS set the ambition to improve this to 70% by March 2025, as a first step in recovering performance to the NHS constitutional standard of 85%.
62 day urgent referral to first treatment performance
Mental health
The Individual Placement and Support (IPS) service is a well evidenced, National Institute for Health and Care Excellence (NICE) approved employment intervention. IPS is for individuals with severe mental illness (SMI) or complex mental health needs who want to gain or retain paid, competitive employment. The IPS Expansion programme aims to support an additional 140,000 to access IPS services by 2028/29.
In February 2025, 42,796 people were reported to have accessed an IPS service in the prior 12 months, which is an increase from 42,254 in January 2025. Through the 2023 Spring Budget and Autumn Statement IPS Expansion, a new baseline access trajectory was established of 30k, alongside annual expansion targets. The total access target for 2024/25 is 40,500 – this was achieved in November 2024 and monthly performance figures continue to increase.
To support the IPS Expansion programme, the national team commissioned IPS Grow (a VCSE organisation supporting on-the-ground delivery of IPS) to work with IPS services. IPS Grow provide hands-on support to services, including support with recruitment and retention of staff, increasing and diversifying referrals to IPS and improving data flow and quality from IPS services.