We want to hear from you. Help us understand your digital experience by taking part in our user research. Find out more now.

Executive summary
This briefing draws on official statistics published on the NHS England website.
75.2% of patients attending A&E were admitted, transferred or discharged within 4 hours, which is below the 95% standard. This is up from 74.6% in June 2024 and 74.0% in July 2023.
Ambulance services answered 821,928 calls to 999, or 26,514 per day, an increase of 6.2% compared to July 2023. There were 378,186 incidents where a patient was conveyed to A&E, 1.4% more than in July 2023. The average ambulance response time for category 2 calls was 33 minutes and 25 seconds which has improved from June 2024 but is longer than in July 2023.
As of the end of June, on the total waiting list there were 7.62 million waits for procedures and appointments and an estimated 4 million people waiting for care. The system experienced 4 days of industrial action. The number of patients waiting more than 65 weeks for treatment was 58,024 at the end of June.
Levels of urgent suspected cancer referrals have remained at high levels, with the 12,792 patients seen per working day in June 2024 a new record high.
In June, performance against the 62-day Urgent Referral To First Treatment Standard in cancer was 67.4%, which was 4.4% higher than at the same point last year, but still below where we want to see it. The NHS has set the ambition to improve this to 70% to March 2025, as a first step in recovering performance to the 85% standard.
In June 2024, 37,624 people were reported to have accessed an Individual Placement and Support Service for people with severe mental illness in the prior 12 months.
Urgent and emergency care
Urgent and emergency (UEC) care services saw demand fall in July.
The provisional figures published for July indicate that 8.7% of patients spent 12 hours from arrival in A&E. This is down from 9.5% last month.
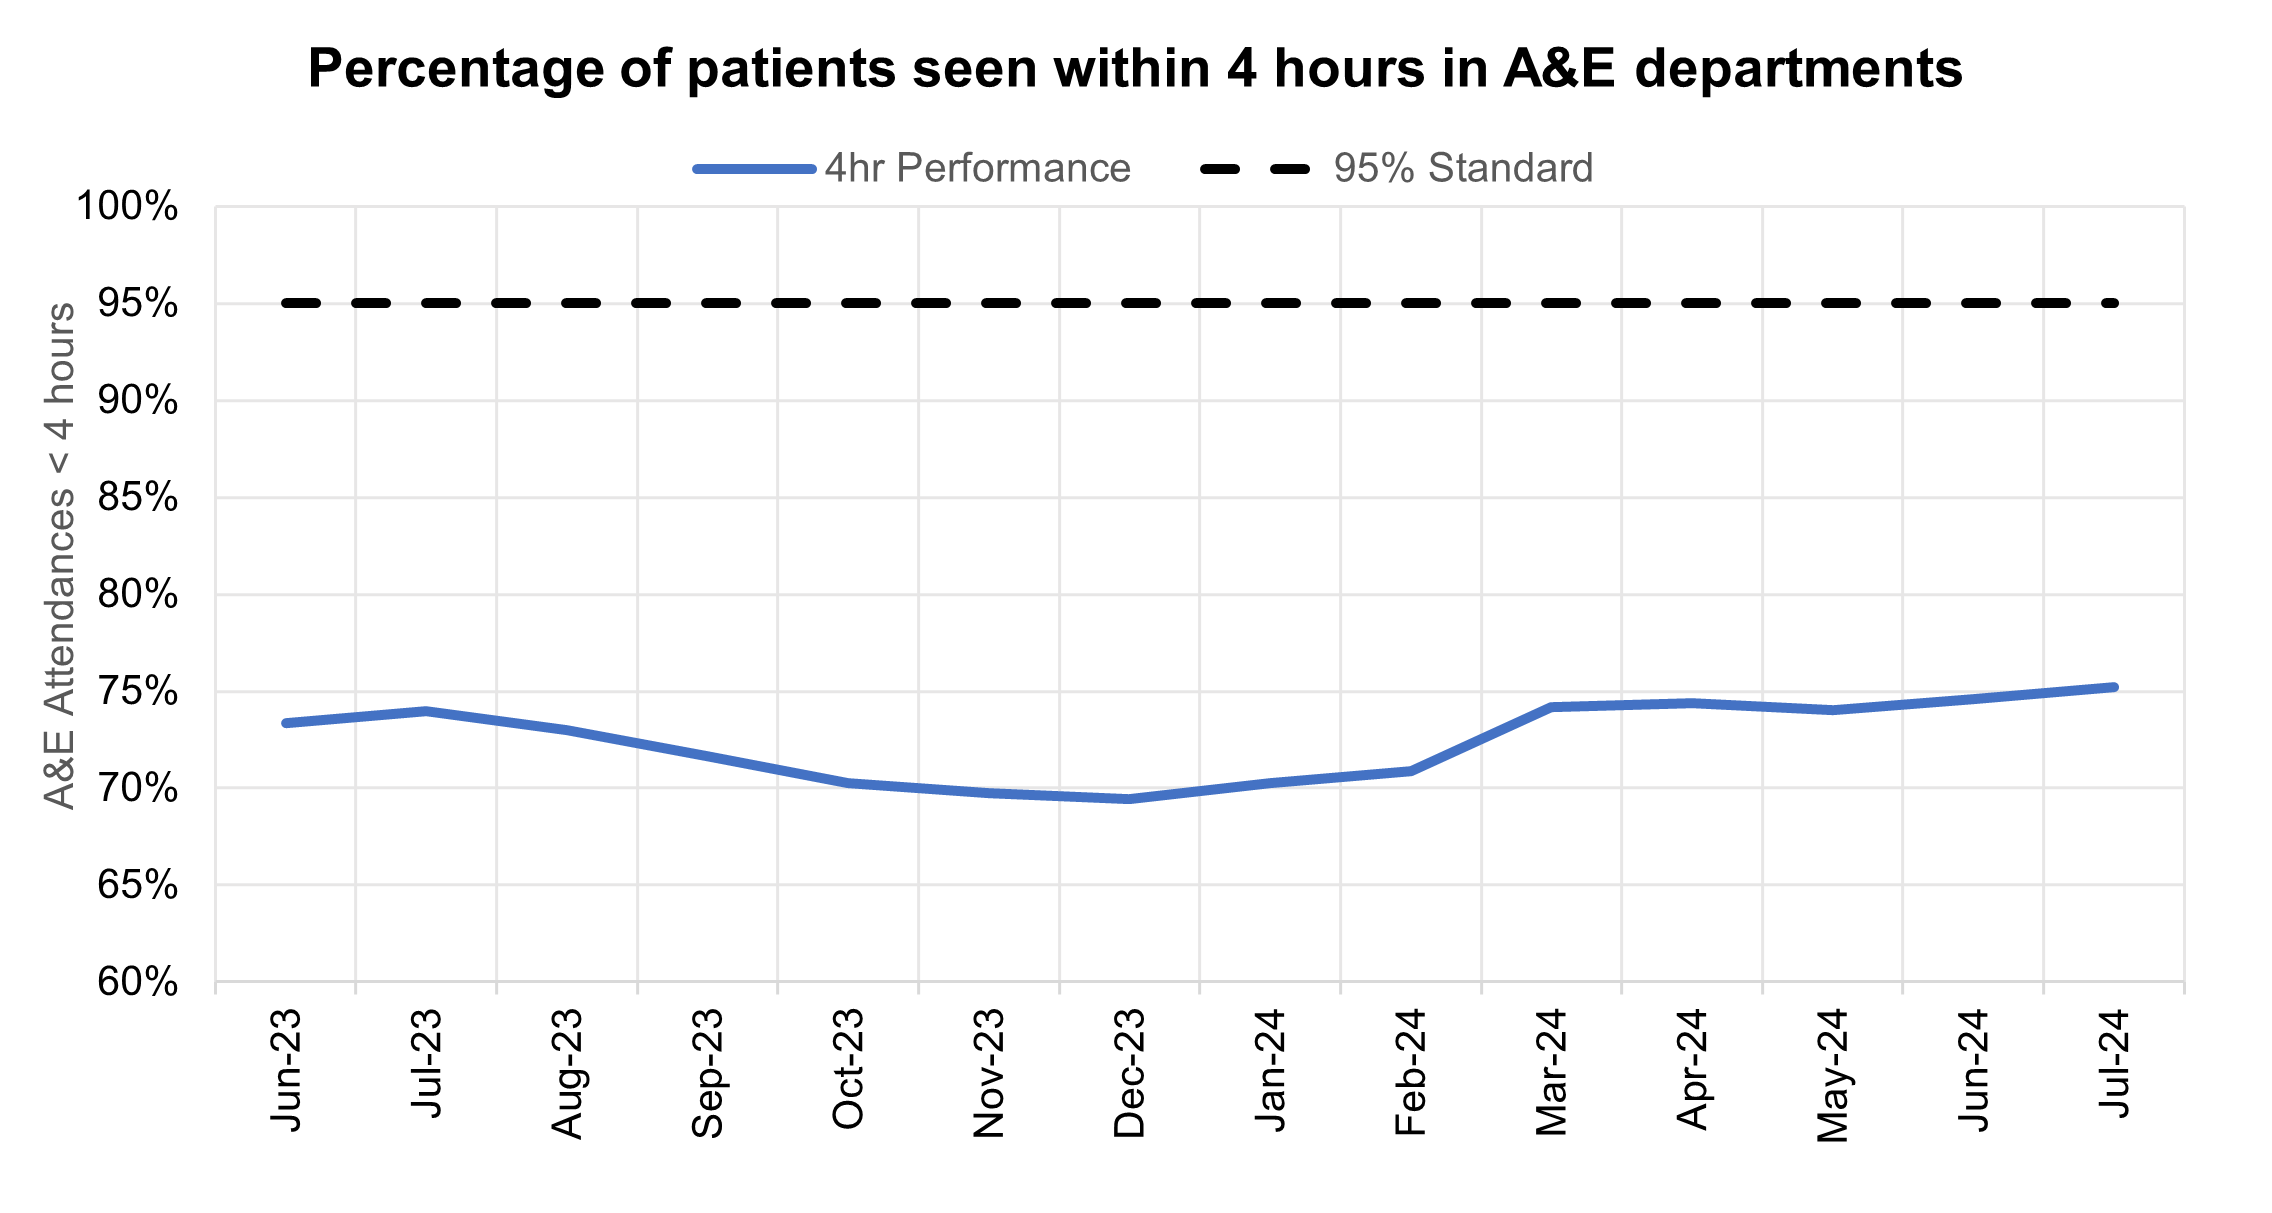
75.2% of patients attending A&E were admitted, transferred or discharged within 4 hours, which is below the 95% standard. This is up from 74.6% in June 2024 and 74.0% in July 2023.
There were a total of 2,321,294 attendances at A&E departments across England in July. The average daily attendances decreased slightly to 74,880, this is 2.1% lower than June’s daily average and 5.5% higher than July 2023.
Percentage of patients seen within four hours in A&E departments
Ambulance services answered 821,928 calls to 999, or 26,514 per day, an increase of 6.2% compared to July 2023. There were 378,186 incidents where a patient was conveyed to A&E, 1.4% more than in July 2023.
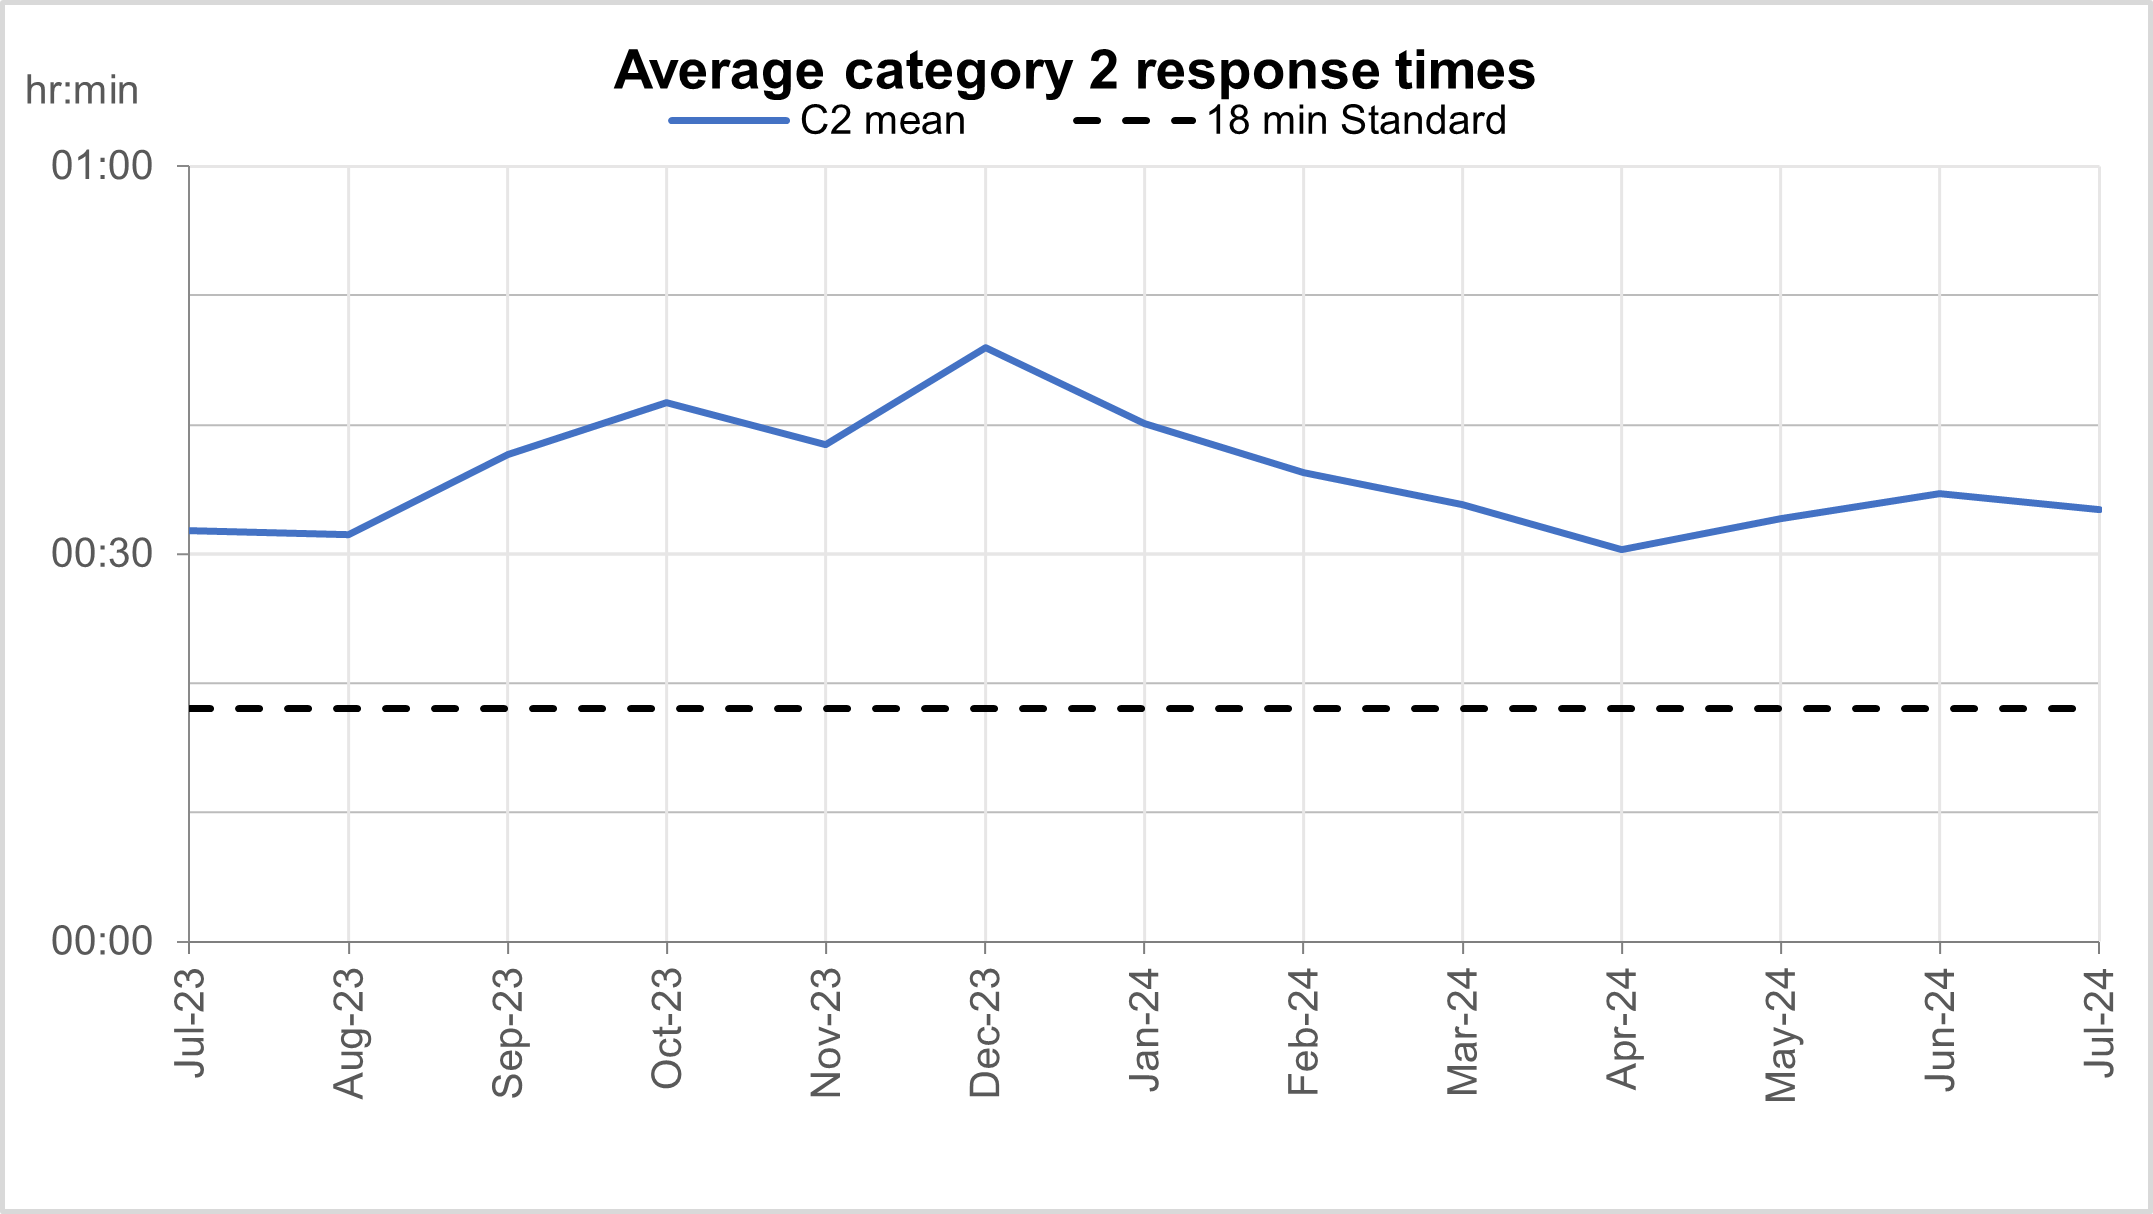
The average ambulance response time for category 2 calls was 33 minutes and 25 seconds which has improved from June 2024 but is longer than in July 2023.
Average category 2 response times by integrated care board have been published for the first time with data for 2023/24, and for 2024/25 up to the last Sunday in July 2024.
Average category 2 response times
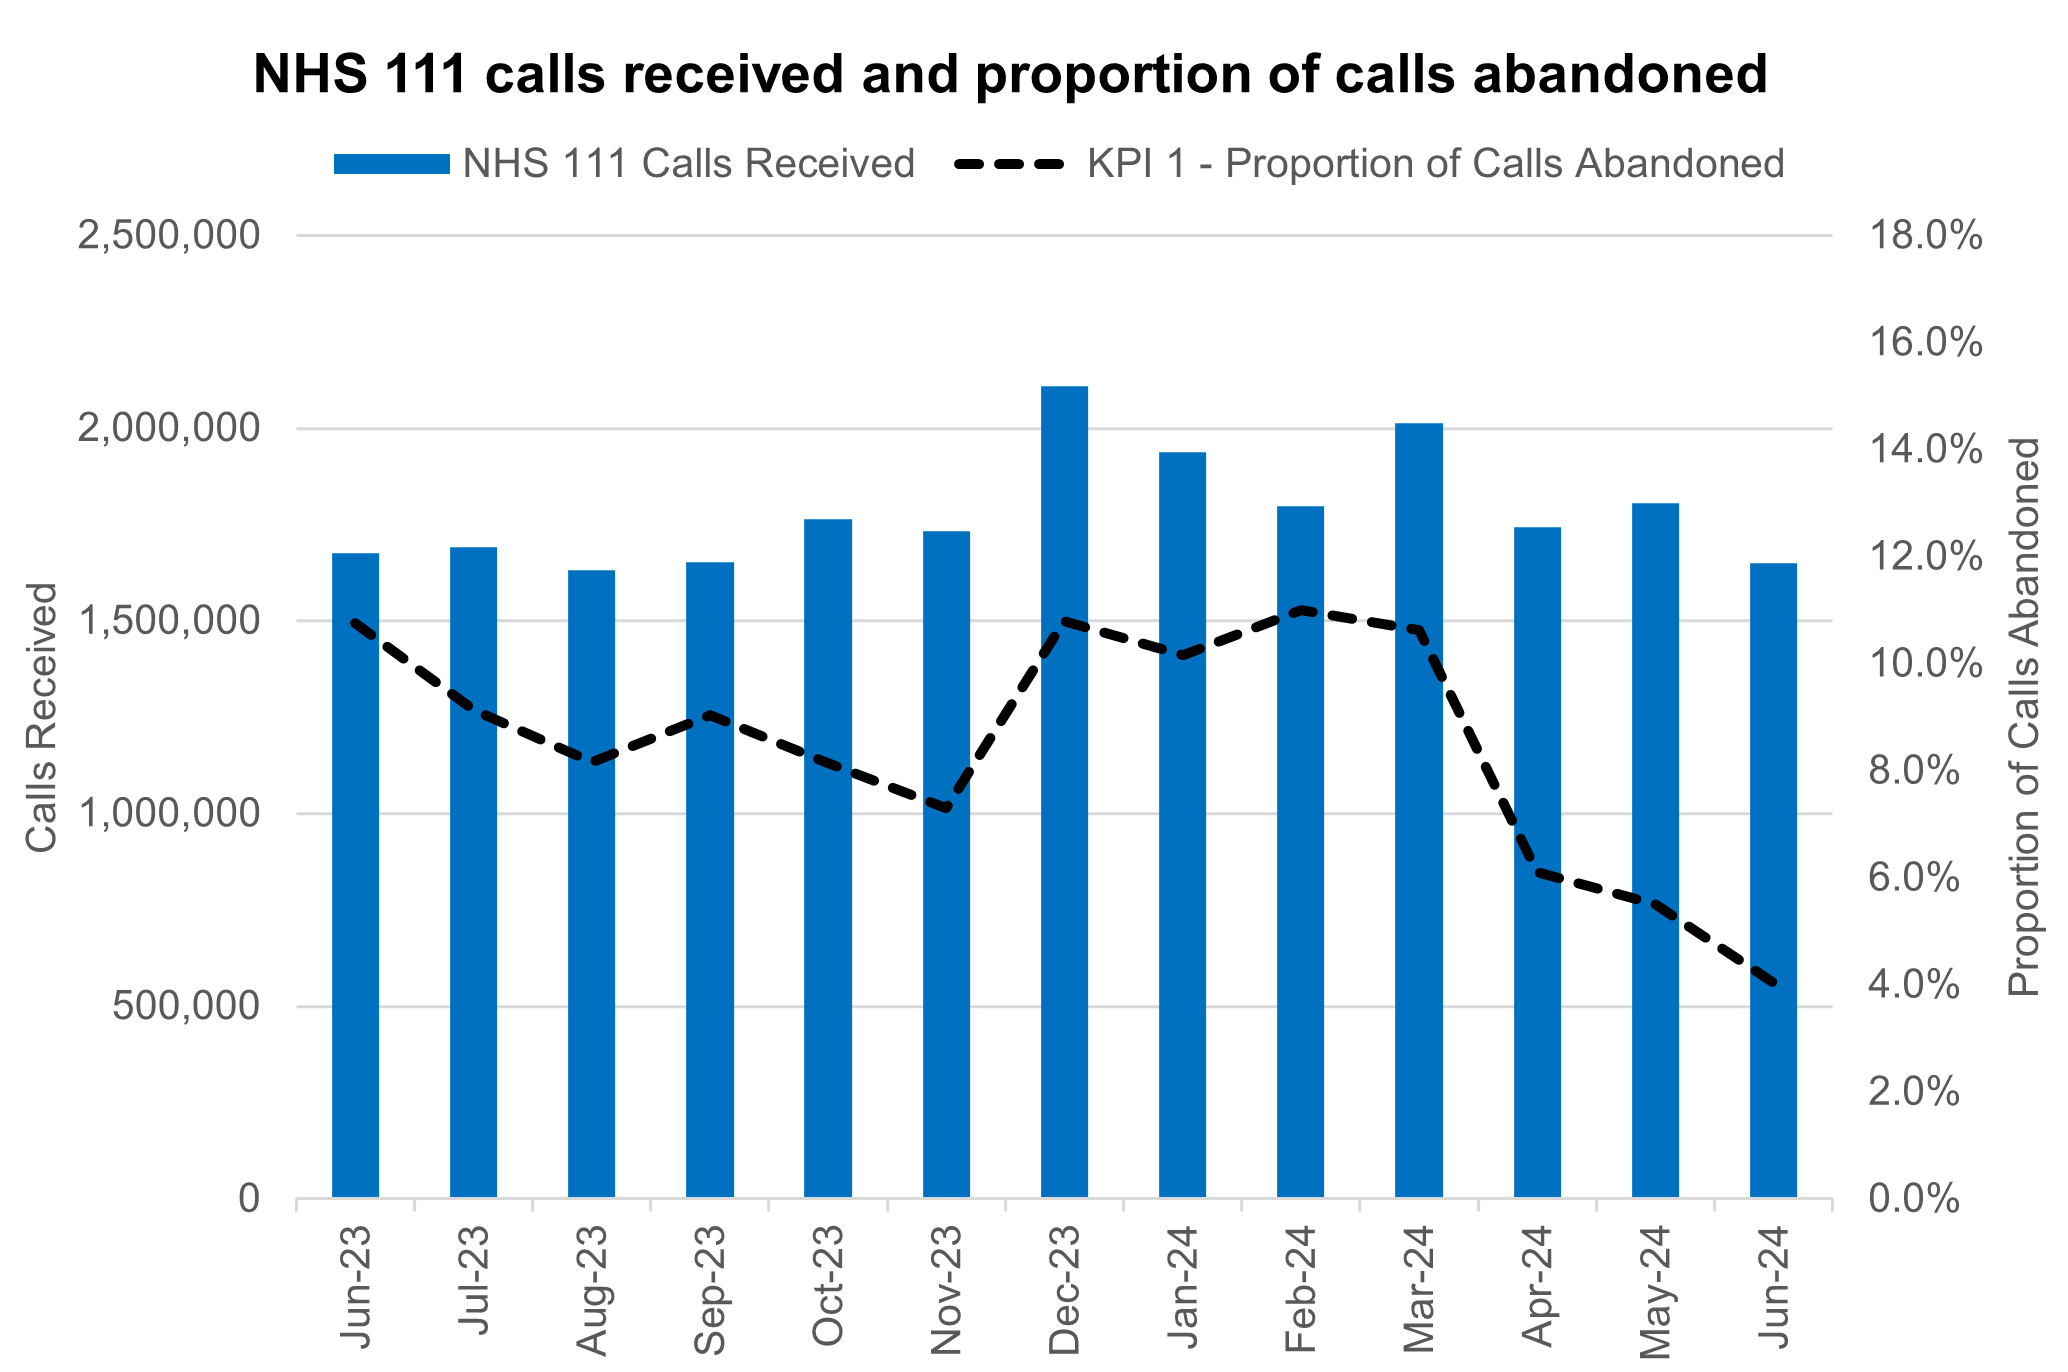
NHS 111 received 1.7 million calls (c. 55.0 thousand per day) in June. Demand was 1.5% down year on year and 8.6% below volumes received in May 2024.
The proportion of calls abandoned dropped 1.5% percentage points from the previous month (now at 4.0%) and the average speed to answer reduced by 29 seconds to 65.
NHS 111 calls received and proportion of calls abandoned
There has been a change in how the data is collected for the acute discharge situation report (sitrep). This is the second month of using the new data collection system and not all organisations have been able to submit, there will be a decrease in the data volumes for bed numbers.
Elective recovery
As of the end of June, on the total waiting list there were 7.62 million waits for procedures and appointments and an estimated 6.4 million people waiting for care. The system experienced 4 days of industrial action.
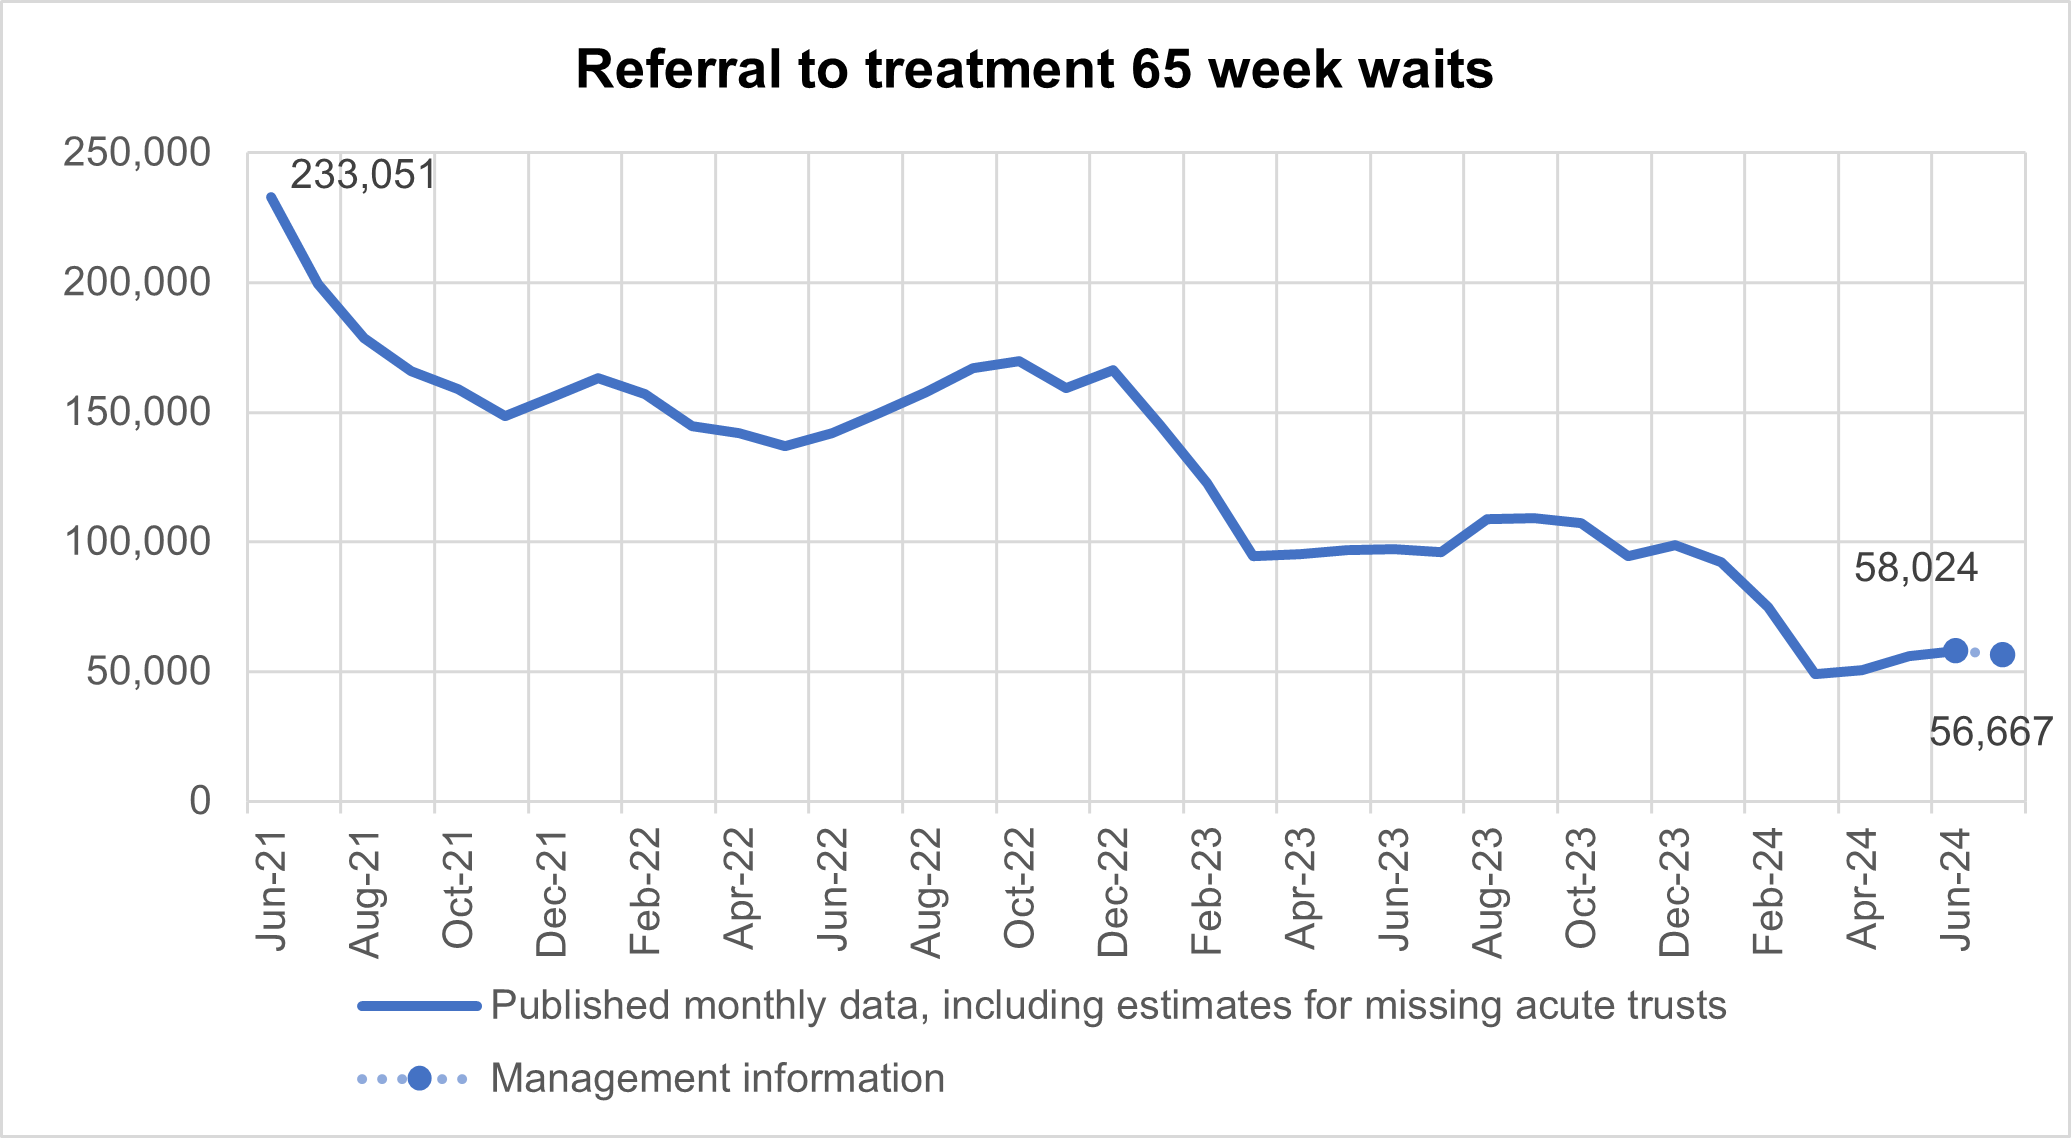
The number of patients waiting more than 65 weeks for treatment was 58,024 at the end of June, compared to 97,275 at the end of June 2023. Additional management data* suggests this number has decreased to 56,667 patients waiting more than 65 weeks for treatment as of the end of July.
Referral to treatment 65 week waits
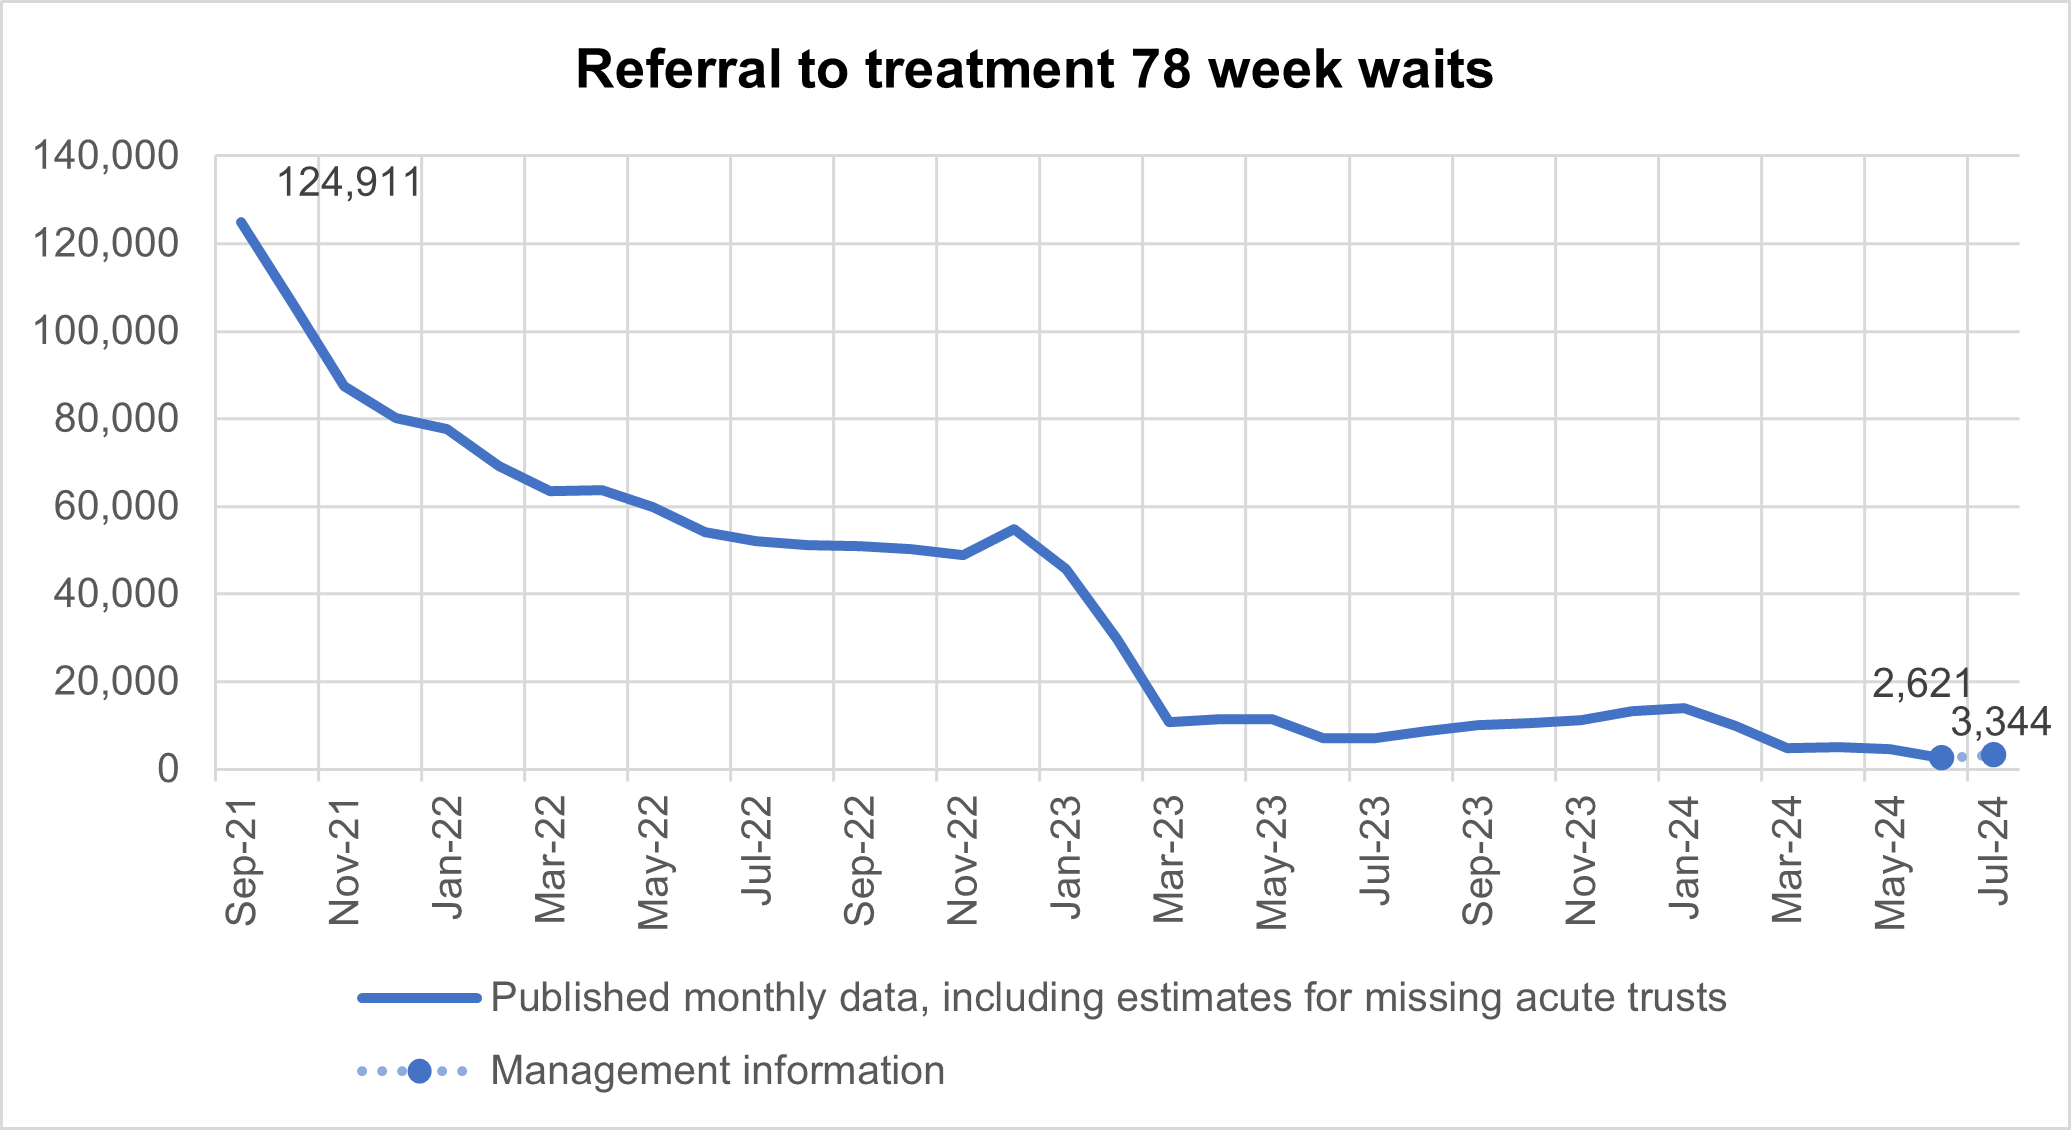
There has been a reduction in the longest waits for care, 2,621 patients were waiting more than 78 weeks for treatment at the end of June, compared to 7,177 at the end of June 2023 (down 63.5%). Additional management data* suggests 3,344 patients were waiting more than 78 weeks for treatment as of the end of July.
*Management information for the latest month is taken from the Waiting List Minimum Dataset which is subject to less validation than the published monthly figures and does not include estimates for missing providers. (134 out of 135 acute trusts submitted data for the latest month).
Referral to treatment 78 week waits
Patients are still experiencing waiting times of more than 104 weeks for treatment with 120 patients waiting for treatment at the end of June, compared to 314 at the end of June 2023.
Cancer
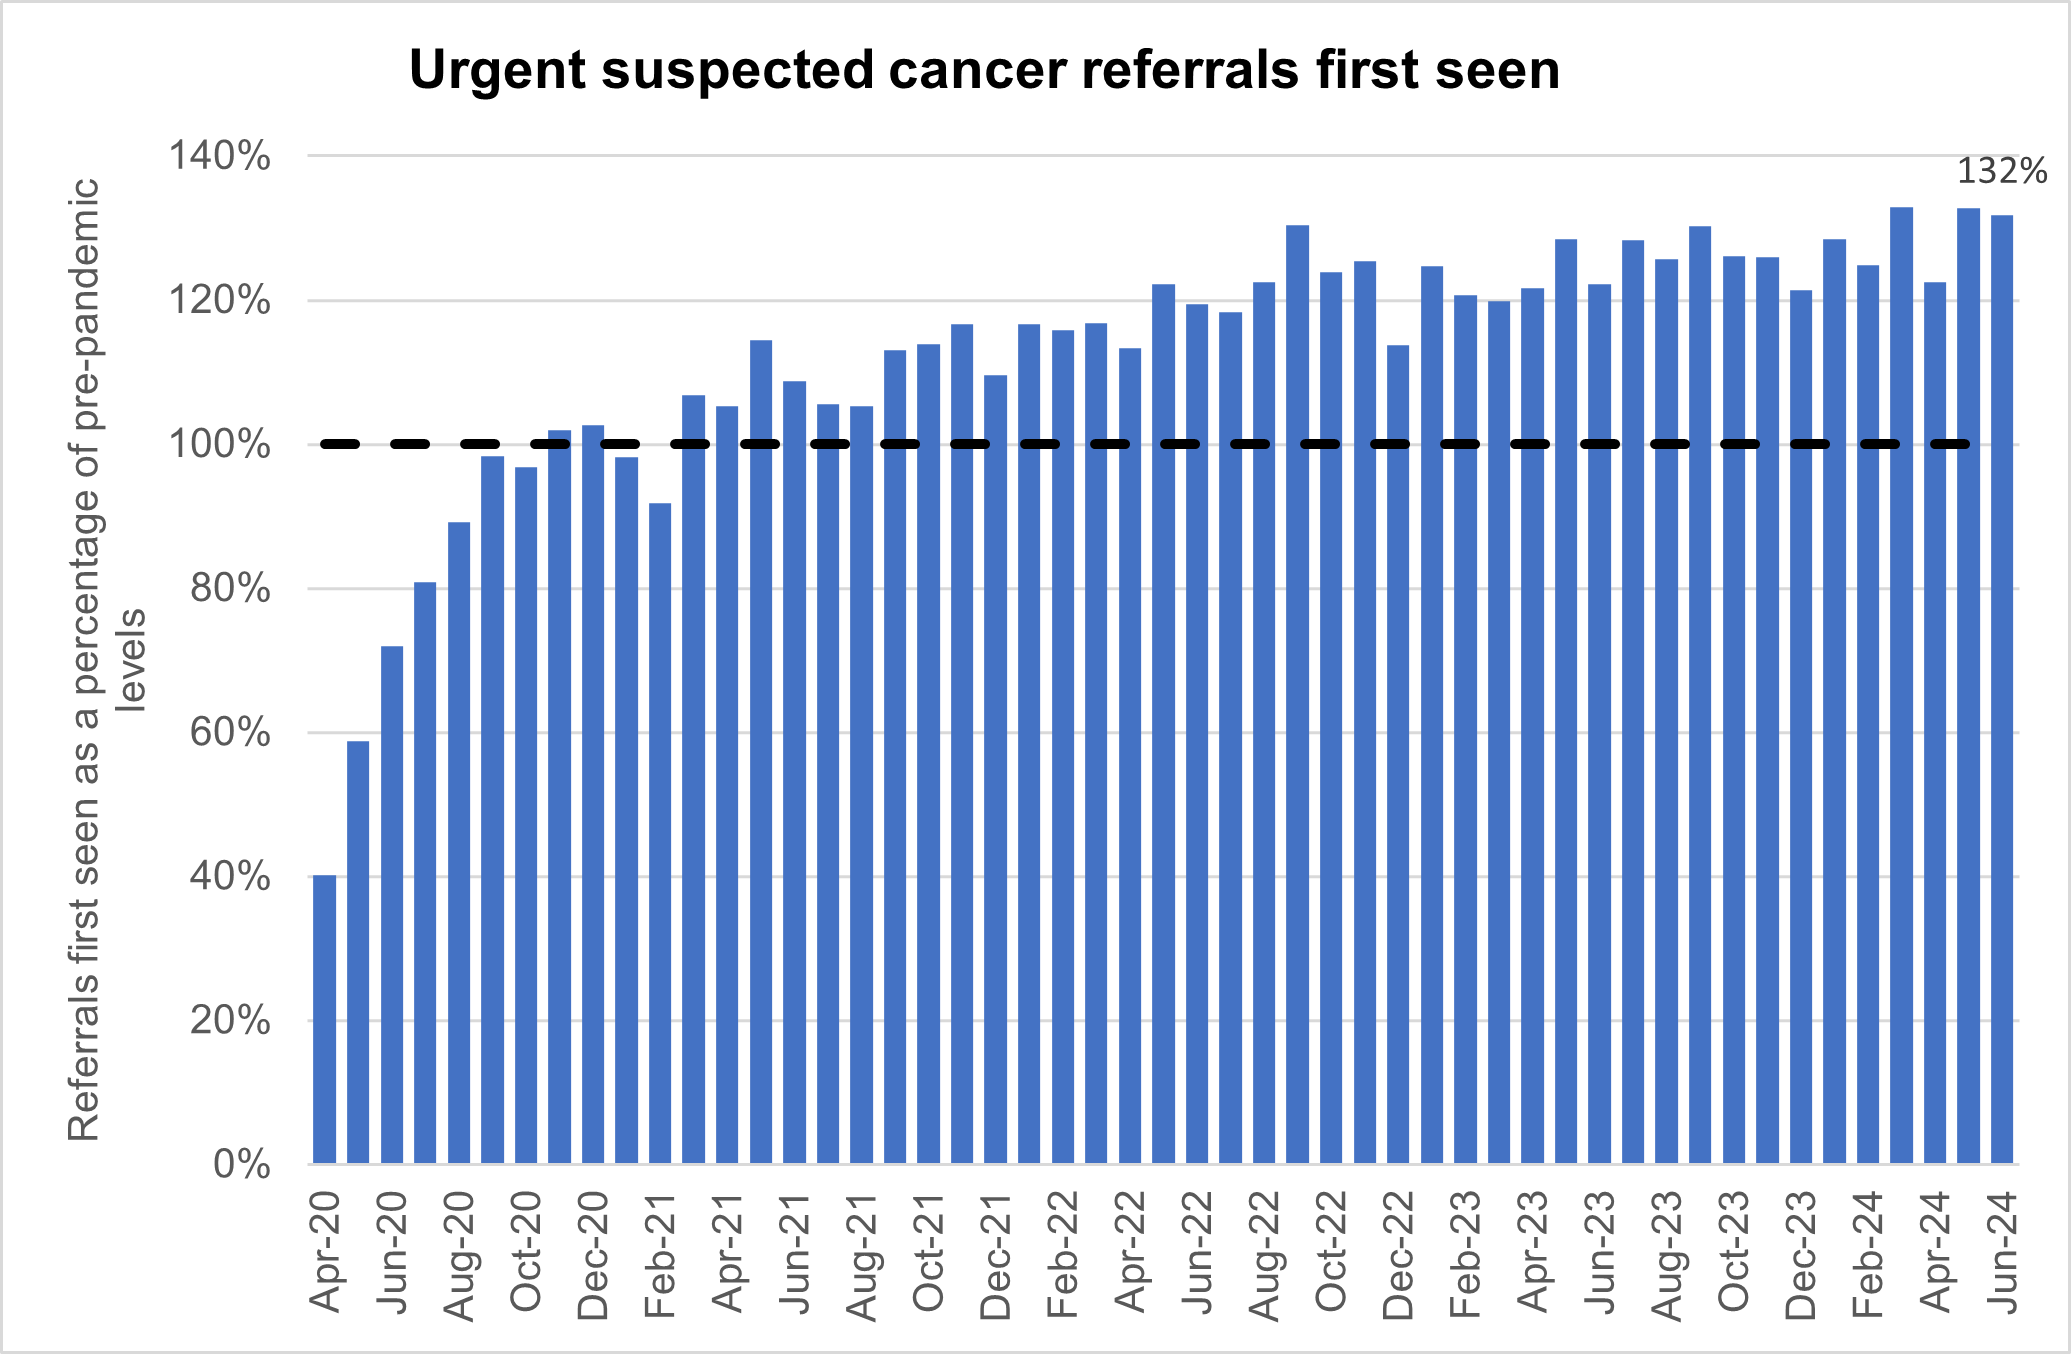
Levels of urgent suspected cancer referrals have remained at high levels, with the 12,792 patients seen per working day in June 2024, a new record high, exceeding the previous record of 12,695 patients seen per working day in May 2024. This is 32% more referrals than the NHS was seeing before the pandemic – the equivalent of 3,000 more patients per working day.
Treatment activity has also been at high levels with over 1,400 patients starting cancer treatment per working day, 16% above pre-pandemic levels.
Urgent suspected cancer referrals first seen
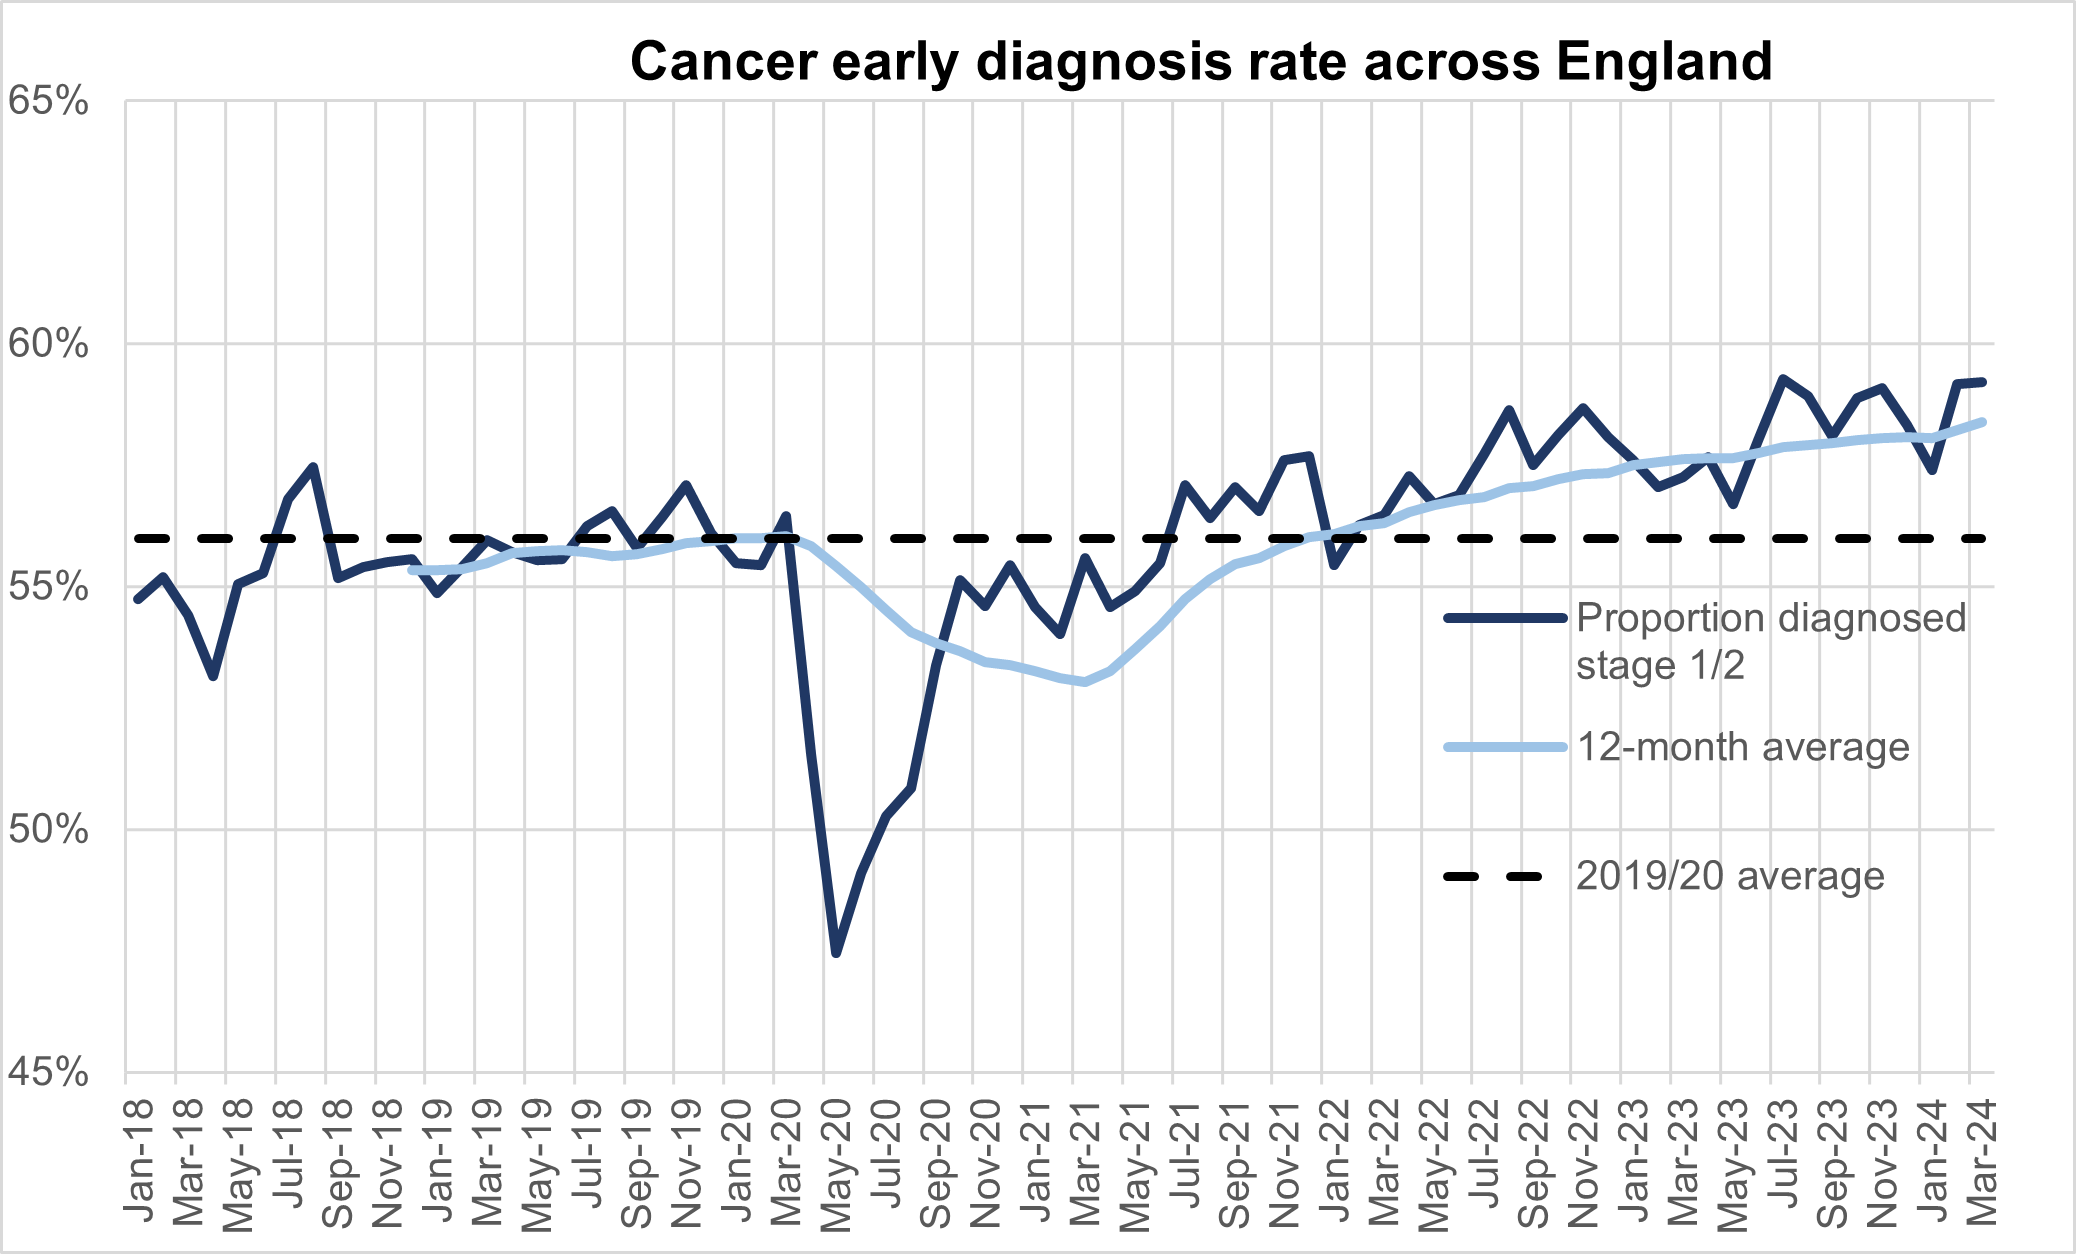
The increase in referrals has contributed to increases in early diagnosis, which are now about 2 percentage points higher than before the pandemic.
Cancer early diagnosis rate across England
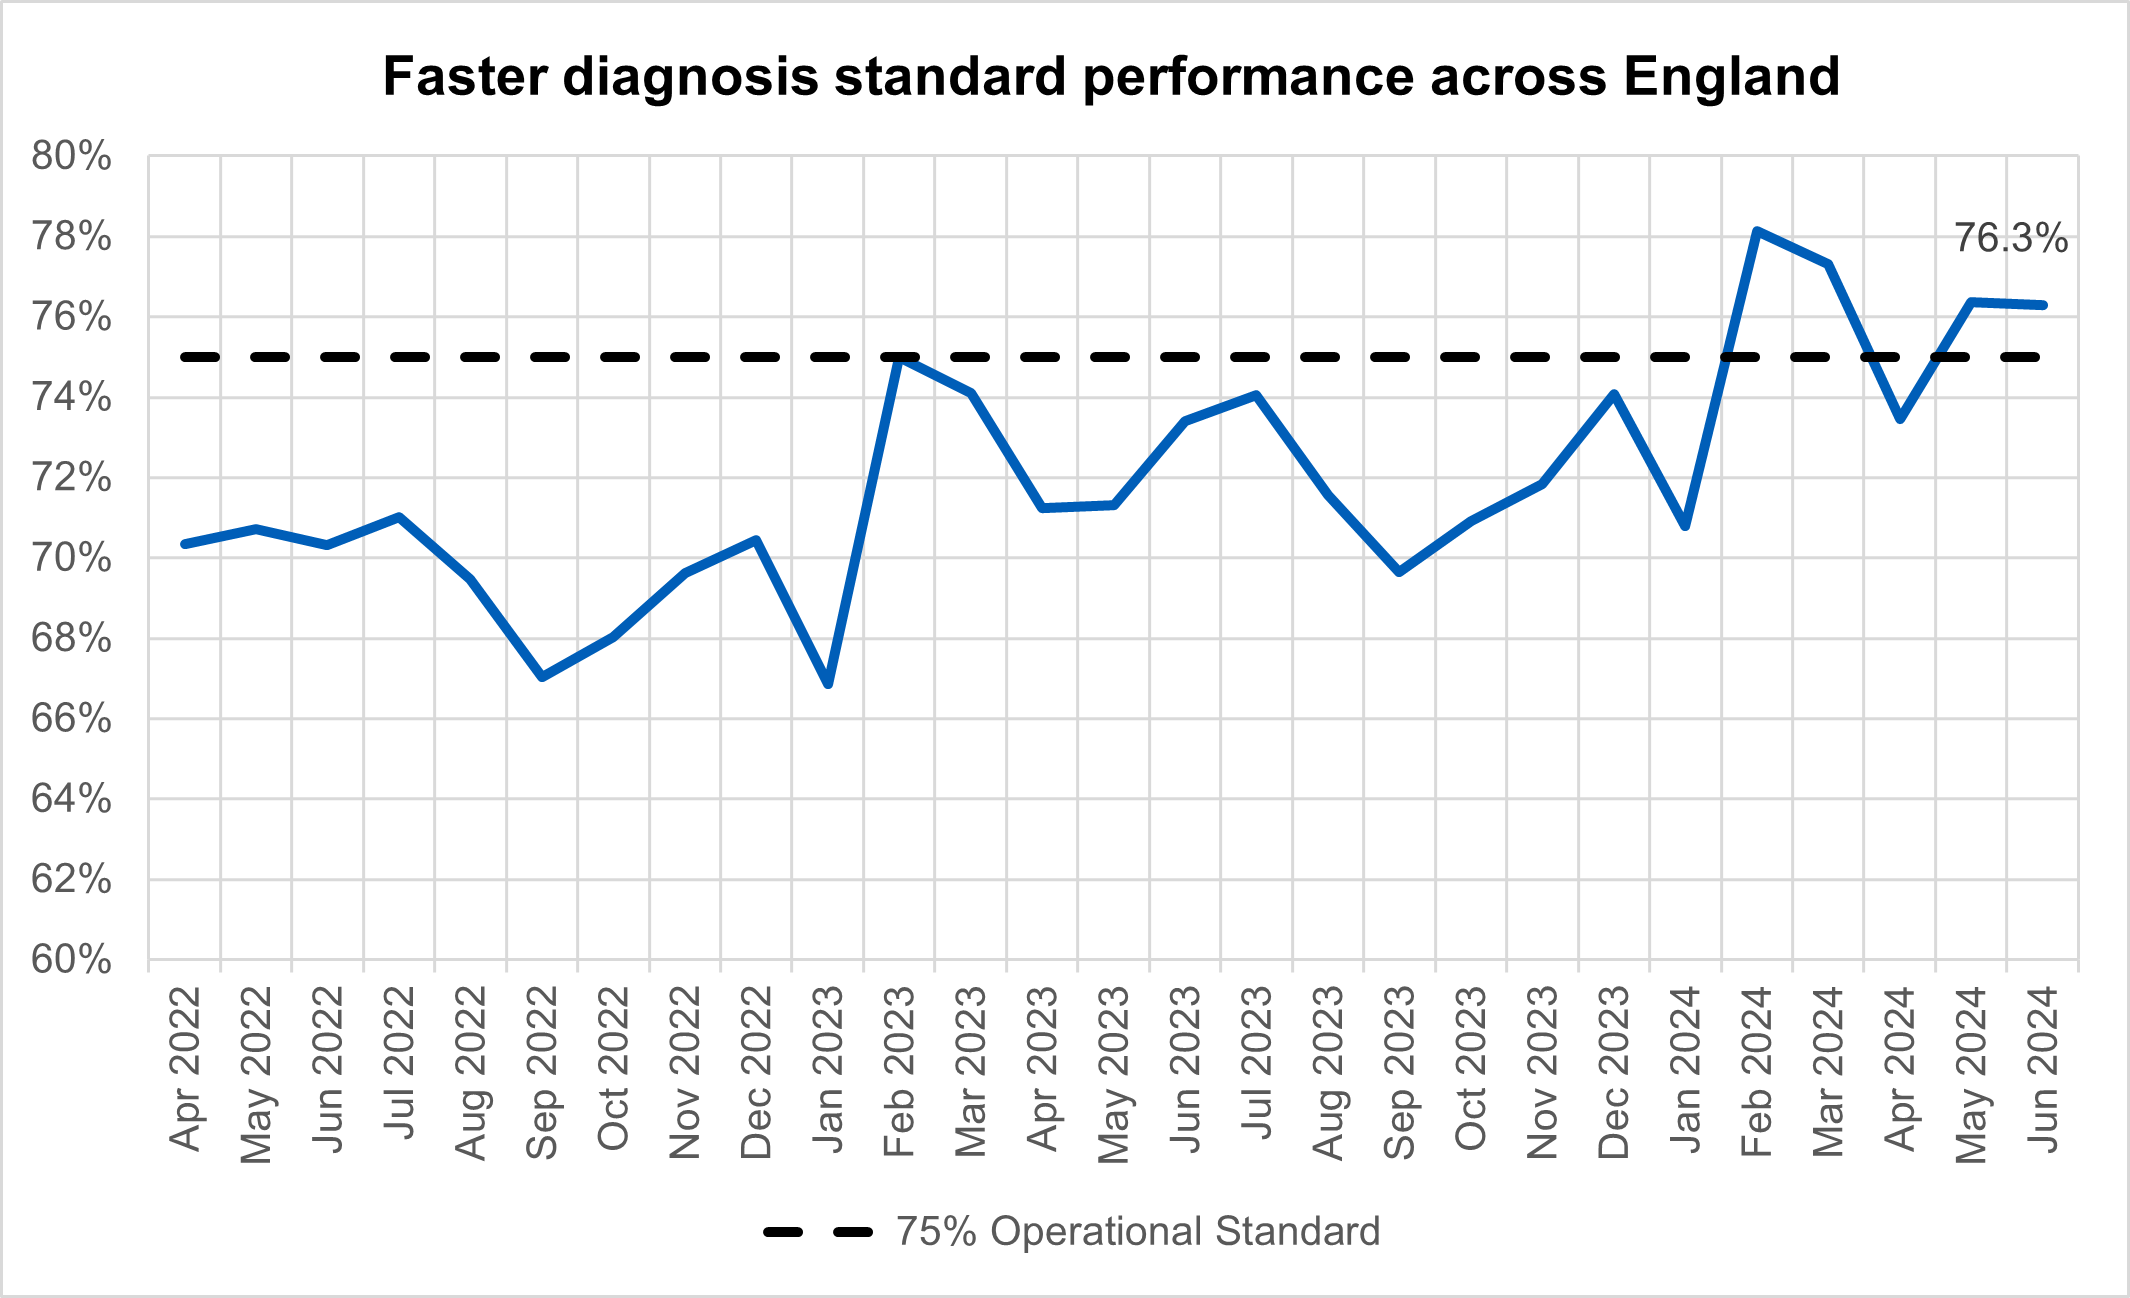
The NHS is working hard to keep up with this increase in demand. Performance against the Faster Diagnosis Standard in June was 76.3%, the fourth time in 5 months that the 75% standard was met (the NHS met the standard for first time ever in February). The NHS has announced that this standard will increase to 80% by March 2026.
Faster diagnosis standard performance across England
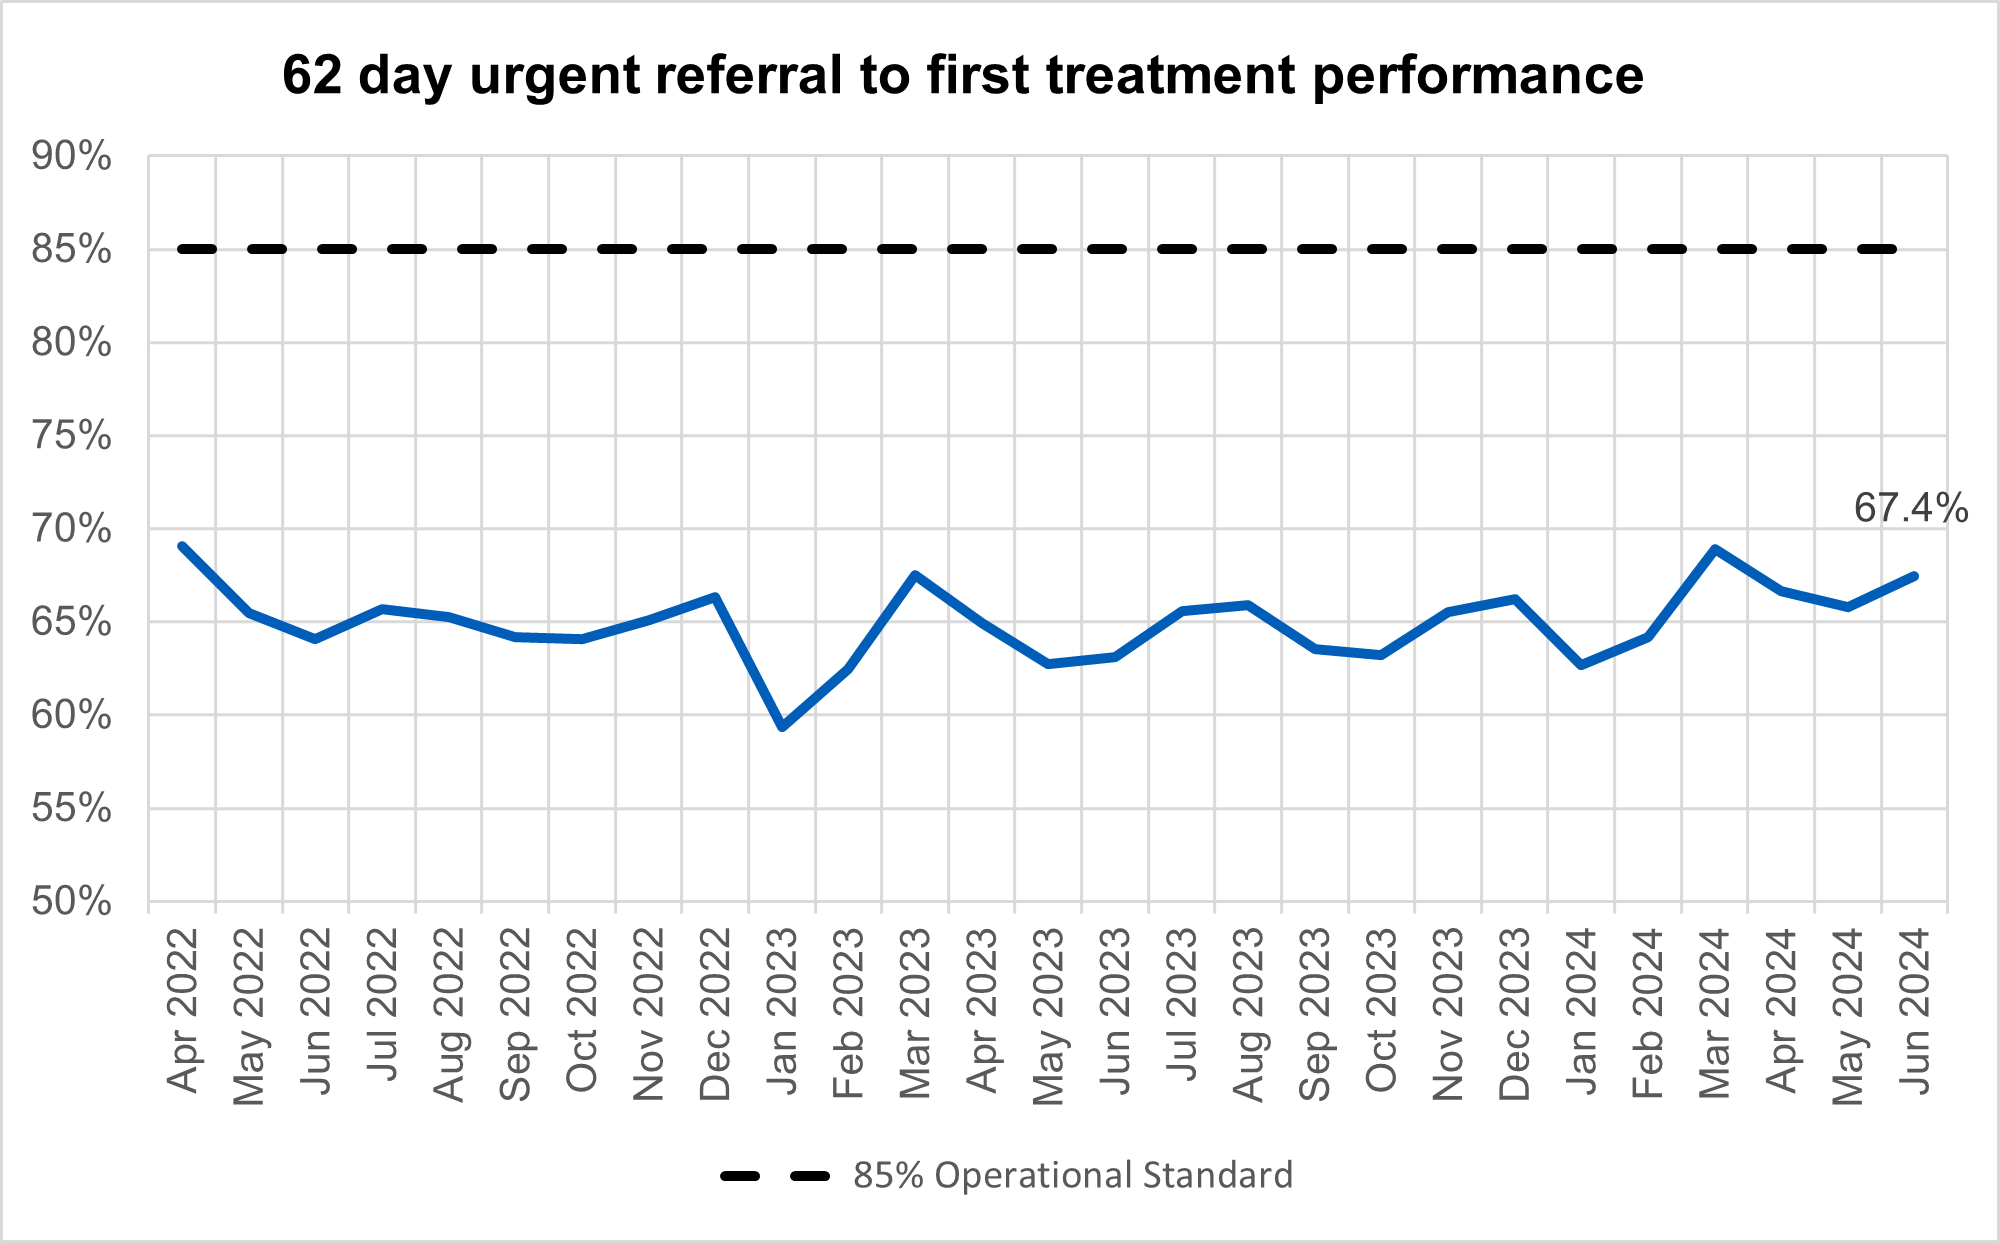
In June, performance against the 62-day Urgent Referral to First Treatment Standard, was 67.4% which was 4.4% higher than at the same point last year, but still well below where we want to see it. The NHS has set the ambition to improve this to 70% to March 2025, as a first step in recovering performance to the 85% standard.
62 day urgent referral to first treatment performance
Mental Health
In June 2024, 37,624 people were reported to have accessed an Individual Placement and Support (IPS) Service for people with severe mental illness (SMI) in the prior 12 months putting us on track to meet our 2024/25 target of 40,5000 by the end of the year. To further increase access, NHS England is working with IPS Grow (a voluntary, community and social enterprise organisation supporting on-the-ground delivery of IPS) to disseminate learnings from 5 pilot sites aiming to increase referrals from primary care referrals, as well as run programmes to increase recruitment and retention of staff.