We want to hear from you. Help us understand your digital experience by taking part in our user research. Find out more now.

Executive summary
This briefing draws on official statistics published here.
- 72.1% of patients at A&E departments were admitted, transferred or discharged within four hours, which is below the NHS constitutional standard of 95%. This is a deterioration from 73.0% in October, but an improvement from 69.8% in November 2023.
- The average ambulance response time for category 2 calls was 42 minutes and 26 seconds. This has increased from 42 minutes and 15 seconds in October 2024 and 38 minutes and 30 seconds in November 2023.
- As of the end of October, on the total waiting list there were 54 million waits for procedures and appointments and an estimated 6.34 million people waiting for care.
- Waits of more than 65 weeks for elective treatment was 20,930 at the end of October, reduced compared to 107,291 at the end of October 2023 (down 80.5%) and 22,903 in September 2024 (down 8.6%).
- Urgent Suspected Cancer referrals have remained at high levels, with 11,943 referrals per working day in October 2024. This is 25% more referrals than the NHS was seeing before the pandemic – the equivalent of 2,300 more referrals per working day. Treatment activity was also at a record high level with nearly 1,400 patients starting cancer treatment per working day, 13% above pre-pandemic levels.
- Performance against the 28 day cancer faster diagnosis standard in October was 77.1%, which is above the NHS constitutional standard of 75% and represents a 6.2% improvement compared to the same point last year and a 2.2% improvement on September 2024.
- The NHS has seen consistent growth in demand for autism assessments since April 2019. In September 2024, there were 204,876 people with an open referral for ‘suspected autism’* which is a 20% (163,313) increase since September 2023. The NHS is delivering an ongoing and sustained increase in the number of suspected autism referrals closed per month. In the six months from April – Sept 2024 there were 50,4185 referrals closed, compared to 29,481 referrals closed in the 6 months April – Sept 2022.
*This is when the presenting condition or symptom for which the patient was referred to the service is recorded as being ‘suspected autism’.
Urgent and emergency care
Demand rose for urgent and emergency care (UEC) services in November. There were a total of 2,311,229 attendances at A&E departments across England in October. The average daily attendances increased to 77,040 across November, this is 1.4% higher than October’s daily average and 6.6% higher than November 2023.
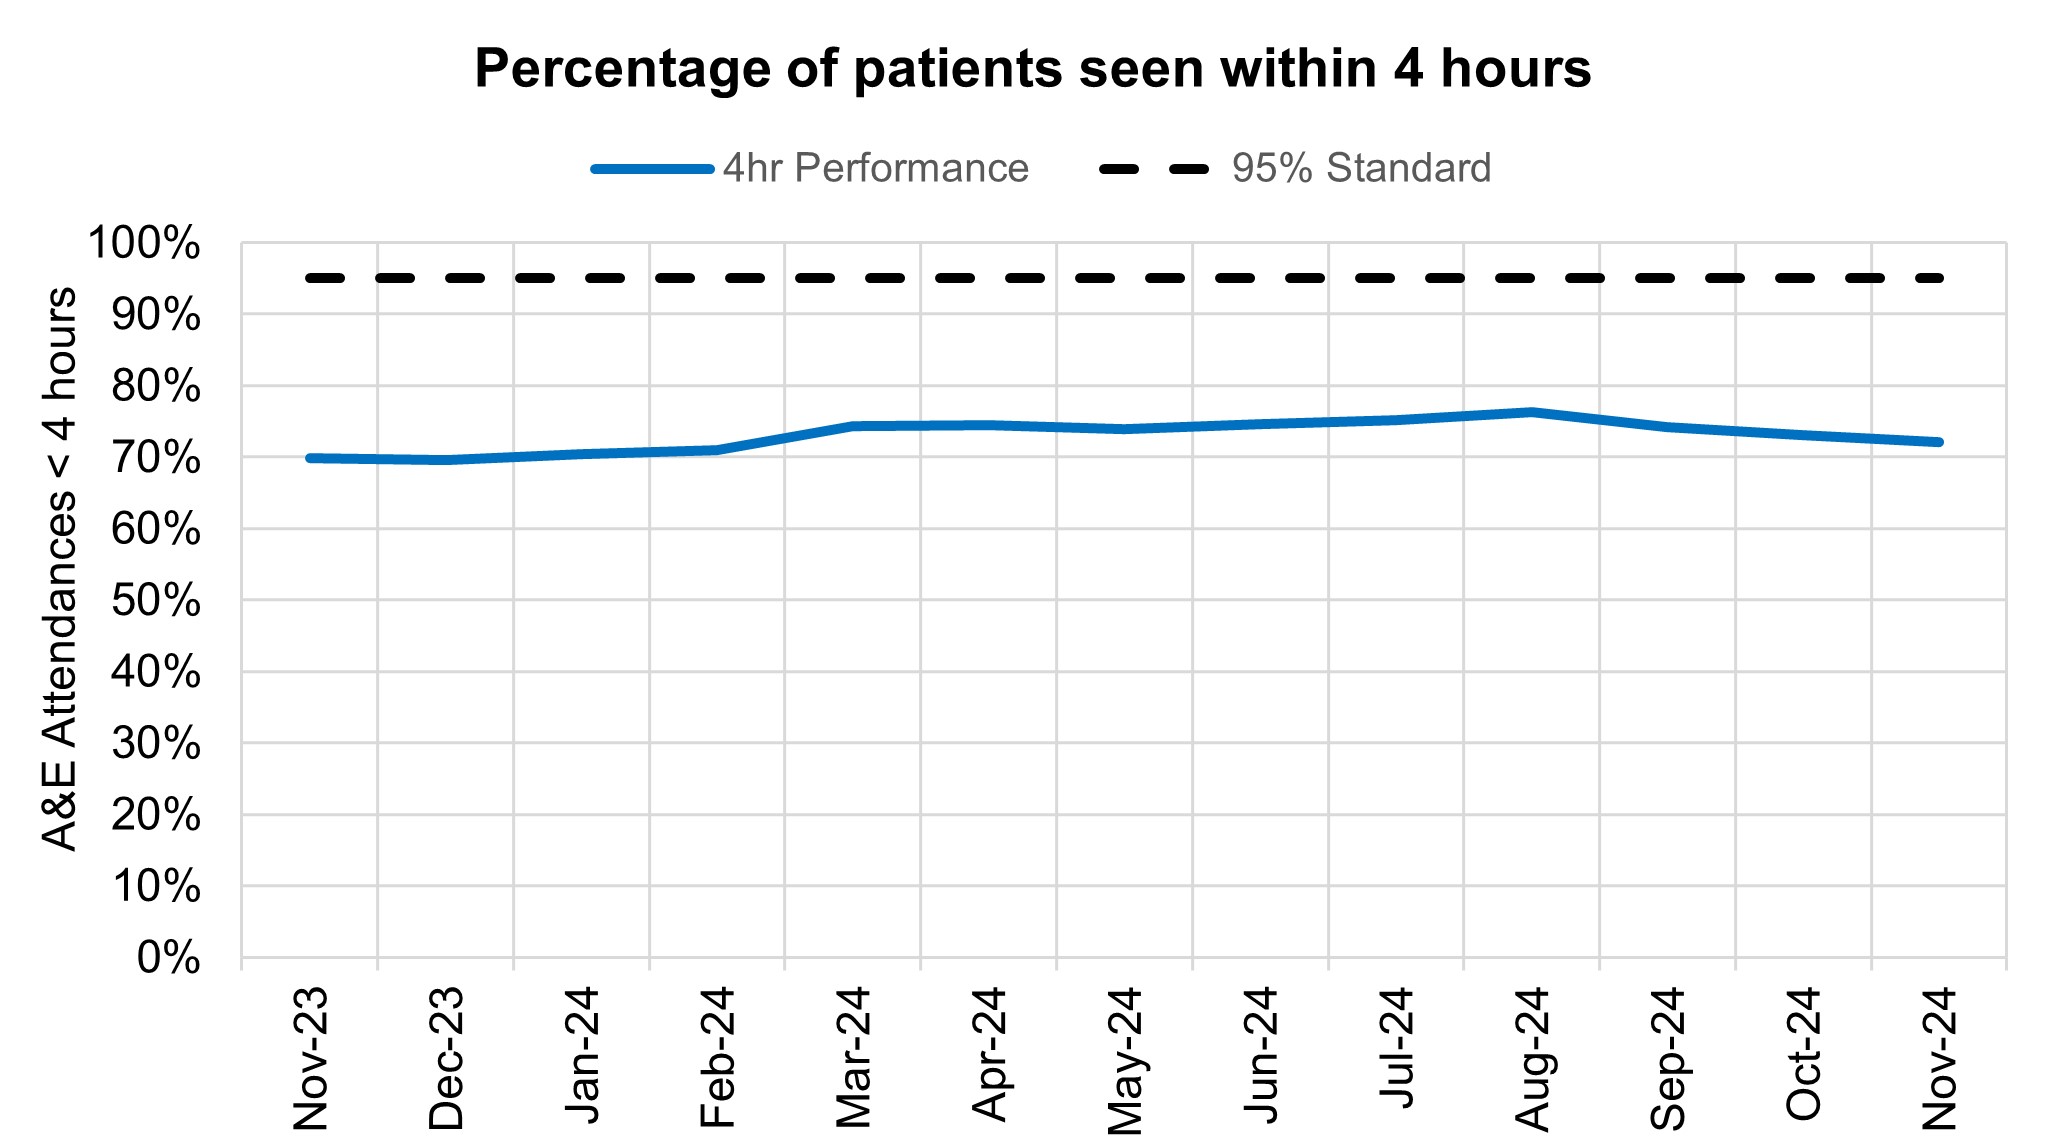
72.1% of patients were admitted, transferred or discharged within four hours, which is below the NHS constitutional standard of 95%. This is a deterioration from 73.0% in October, but an improvement from 69.8% in November 2023.
The provisional figures published for November indicate that 10.7% of patients attending a type 1 A&E department spent 12 hours from arrival in A&E compared with 11.2% last month.
Percentage of patients seen within 4 hours in A&E departments
Ambulance services answered 860,543 calls to 999, or 28,685 per day, an increase of 2% compared to October 2024 and 6% more than November 2023. There were 374,074 incidents where a patient was conveyed to A&E or 12,469 per day, 2% more than in October 2024 and a 2% increase from November 2023.
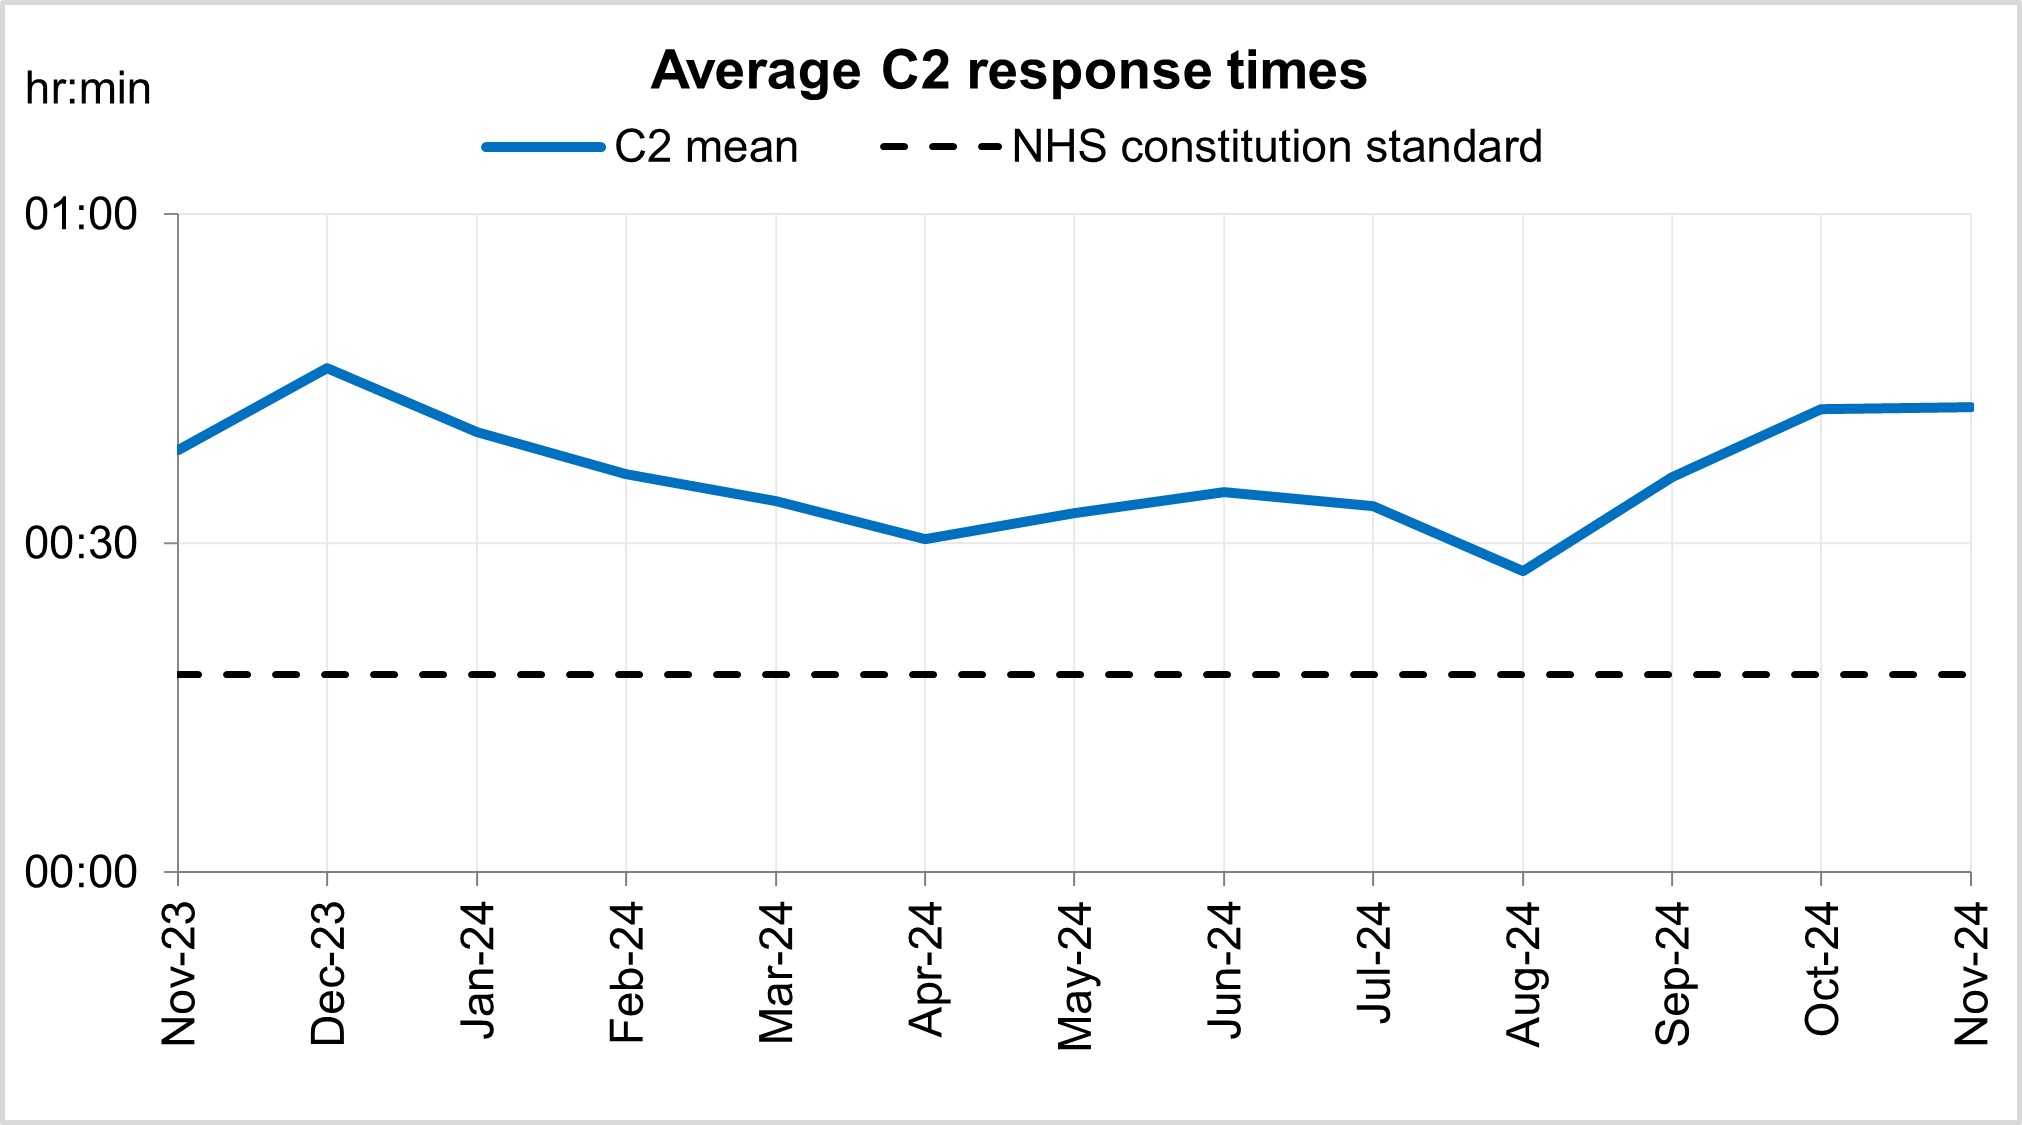
The average ambulance response time for category 2 calls was 42 minutes and 26 seconds. This has increased from 42 minutes and 15 seconds in October 2024 and 38 minutes and 30 seconds in November 2023. This is above the 30 minute target for the year and the NHS constitutional standard of 18 minutes.
Average C2 Response times
NHS 111 received 1.63 million calls (c. 52.8 thousand per day) in October 2024. Demand was 7.3% down year on year and 9.6% above volumes received in September 2024.
NHS 111 calls received and proportion of calls abandoned
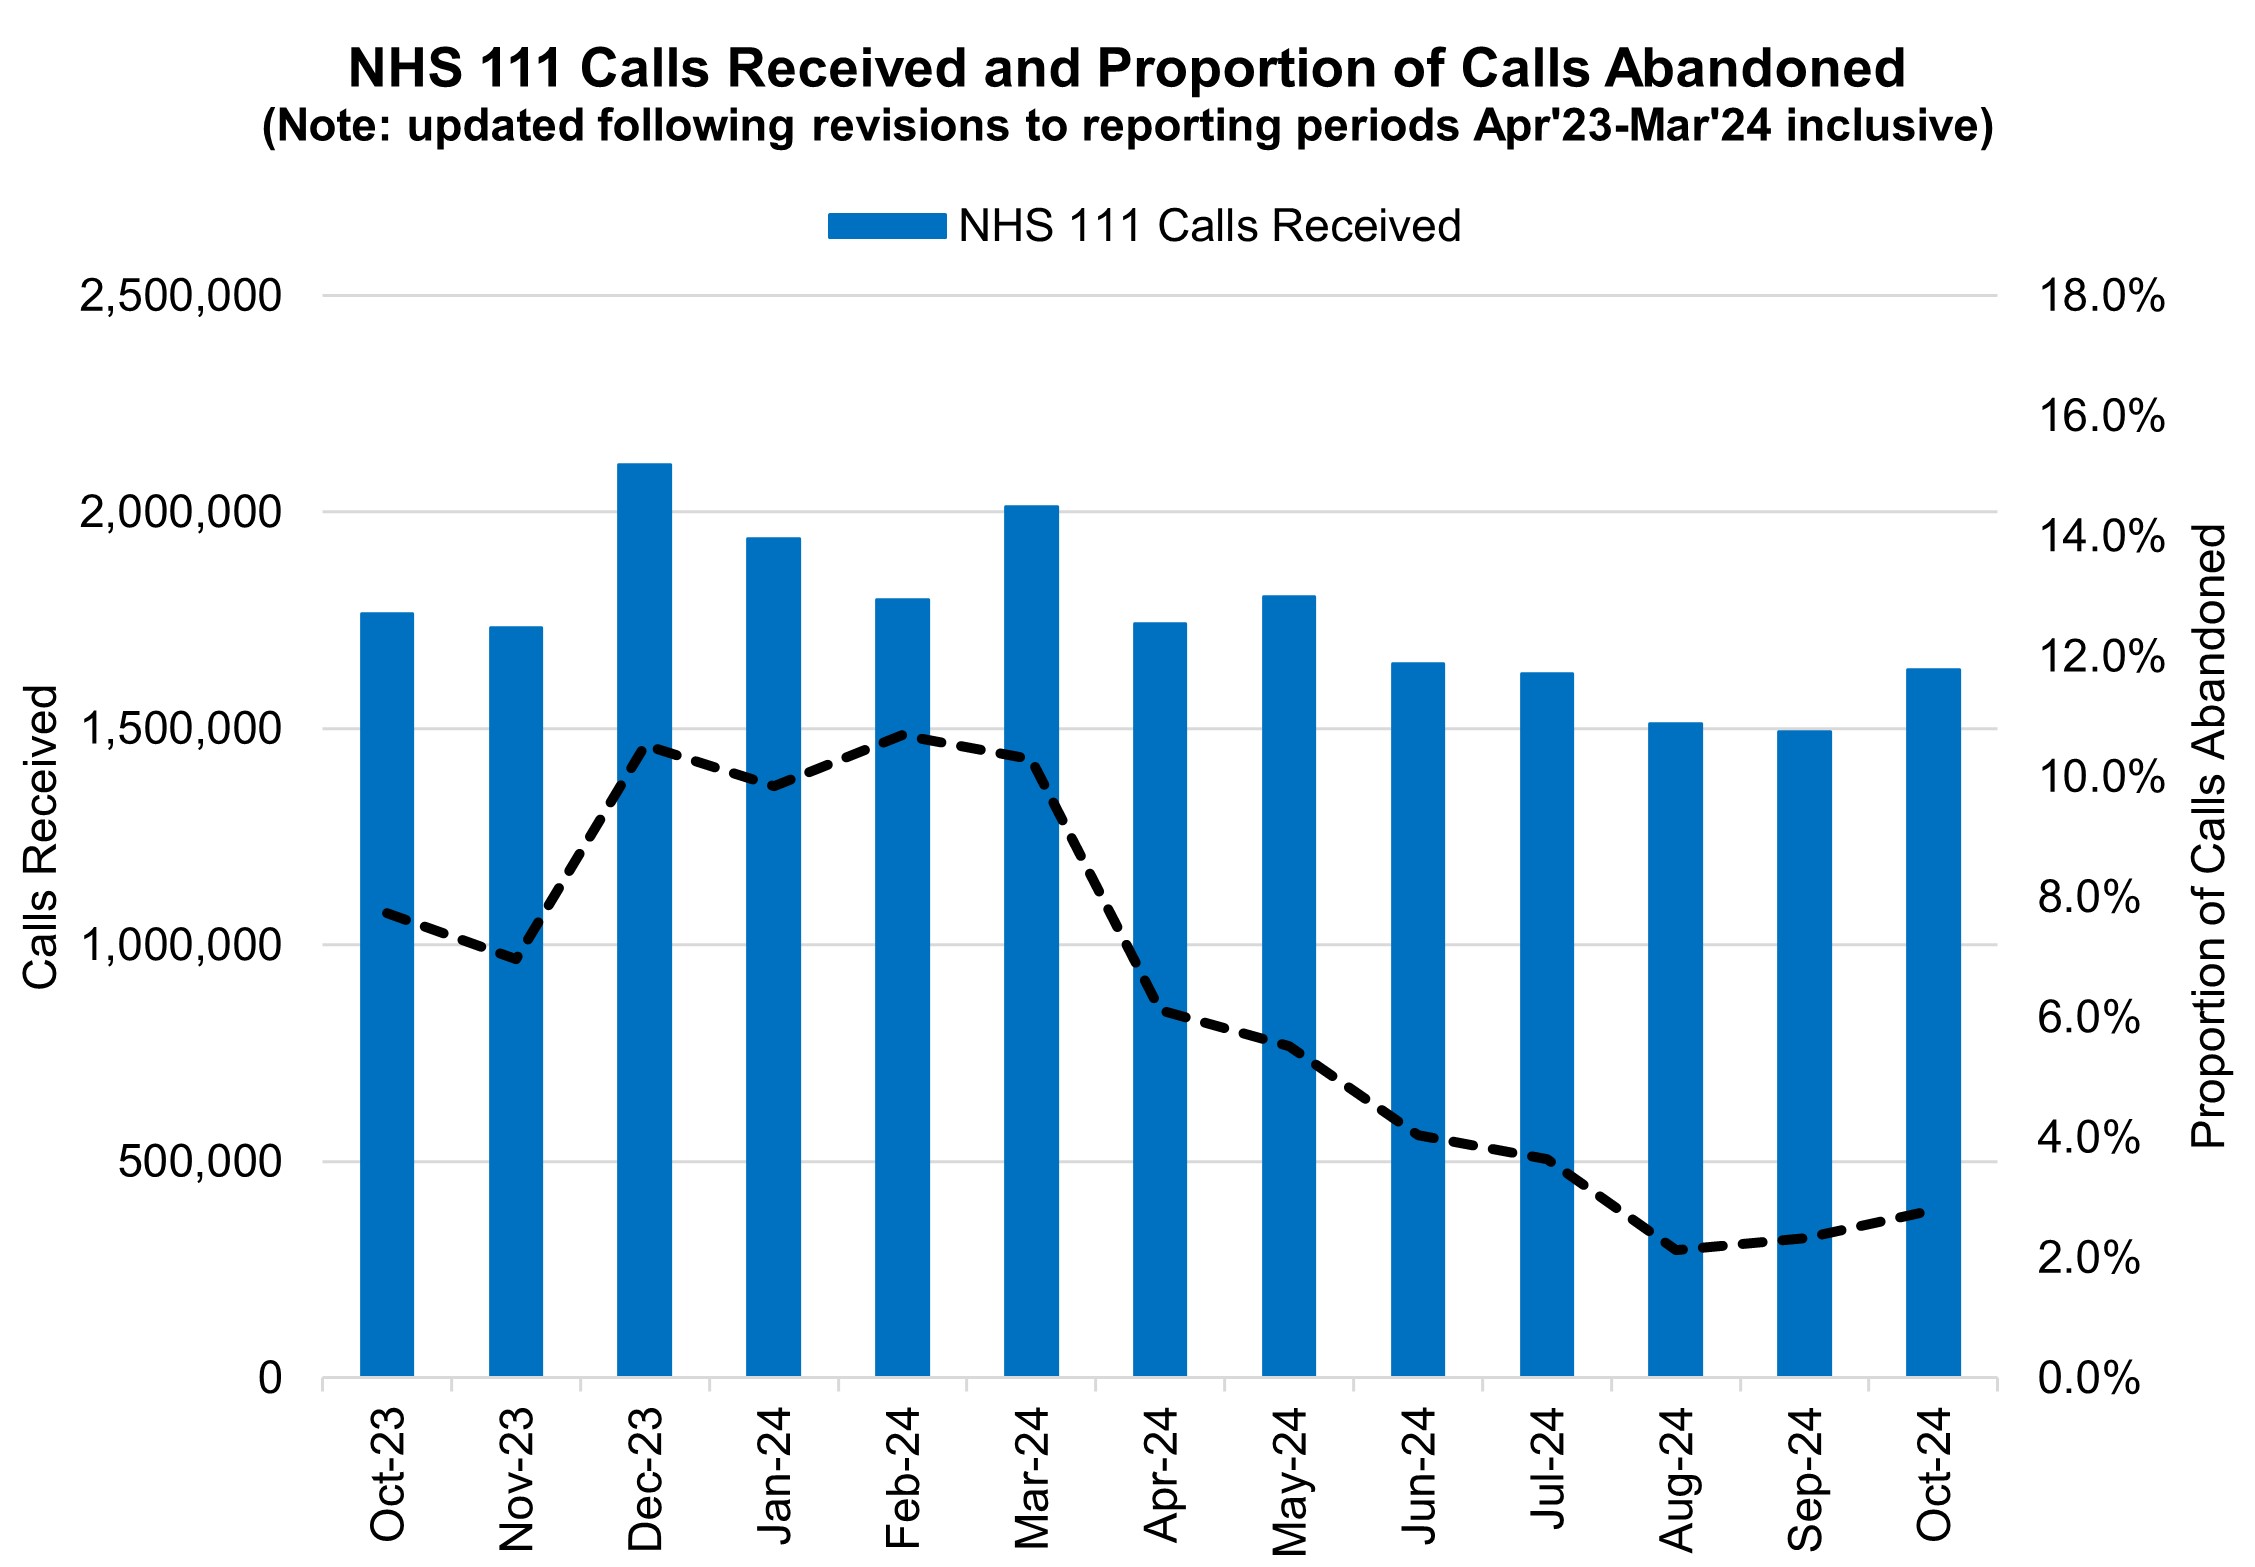
The proportion of calls abandoned increased 0.5% percentage points from the previous month (now at 2.8%) and the average speed to answer increased by 6 seconds to 47 seconds.
Elective recovery
As of the end of October, on the total waiting list there were 7.54 million waits for procedures and appointments and an estimated 6.34 million people waiting for care. The NHS constitution standard states that 92% of patients have a right to start consultant-led treatment within a maximum of 18 weeks from referral for non-urgent conditions.
Referral to treatment 52 week waits
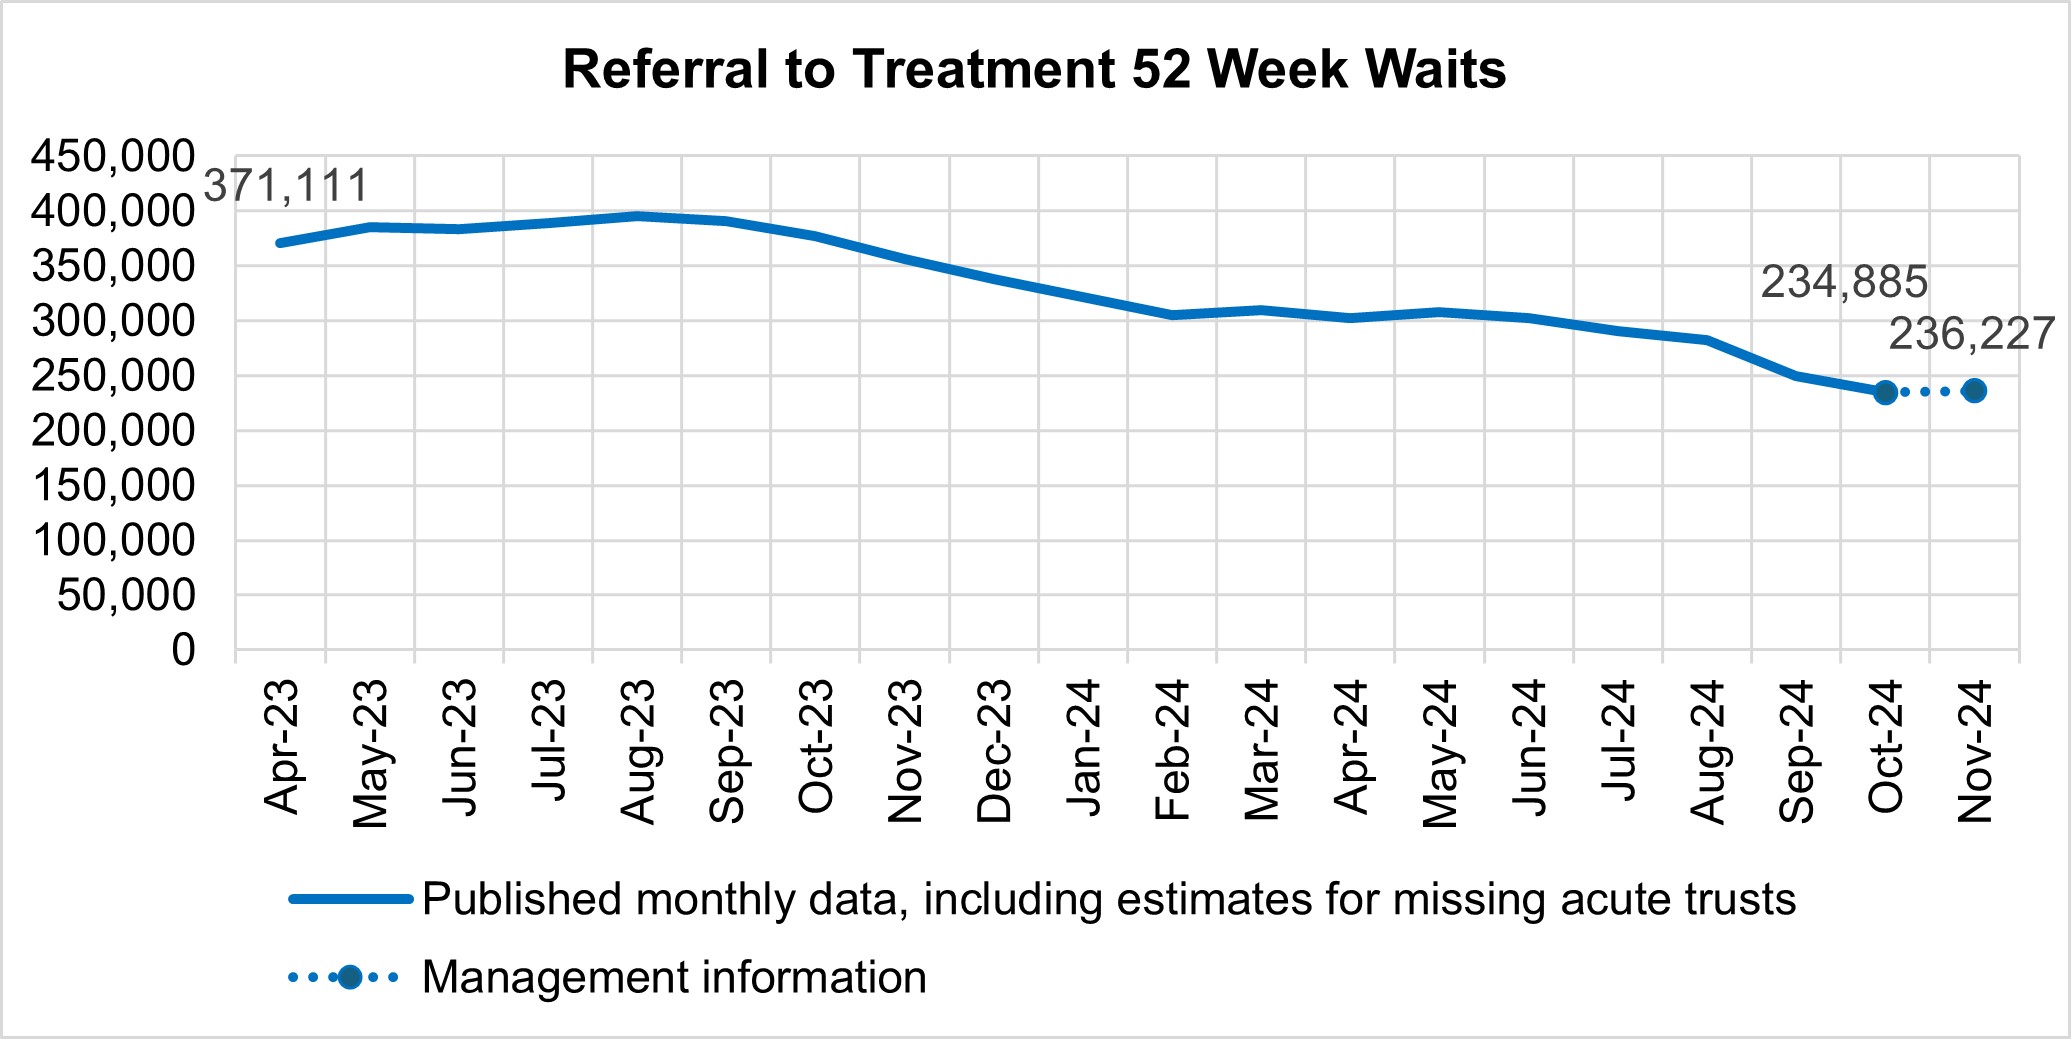
There were 234,885 waits of more than 52 weeks for treatment at the end of October, compared to 377,315 at the end of October 23 (down 37.7%) and 249,343 at the end of September 24 (down 5.8%). Additional management data* suggests there were 236,227 waits of more than 52 weeks as of the end of November.
*Management information for the latest month is taken from the Waiting List Minimum Dataset (WLMDS). Figures include data up to week ending 24 Nov 24. WLMDS data is subject to less validation than the published monthly figures. 134 of 135 acute trusts submitted data for week ending 24 Nov 24 – the figures for this latest week have been adjusted to include the latest available data for the missing acute trusts.
Referral to treatment 65 week waits
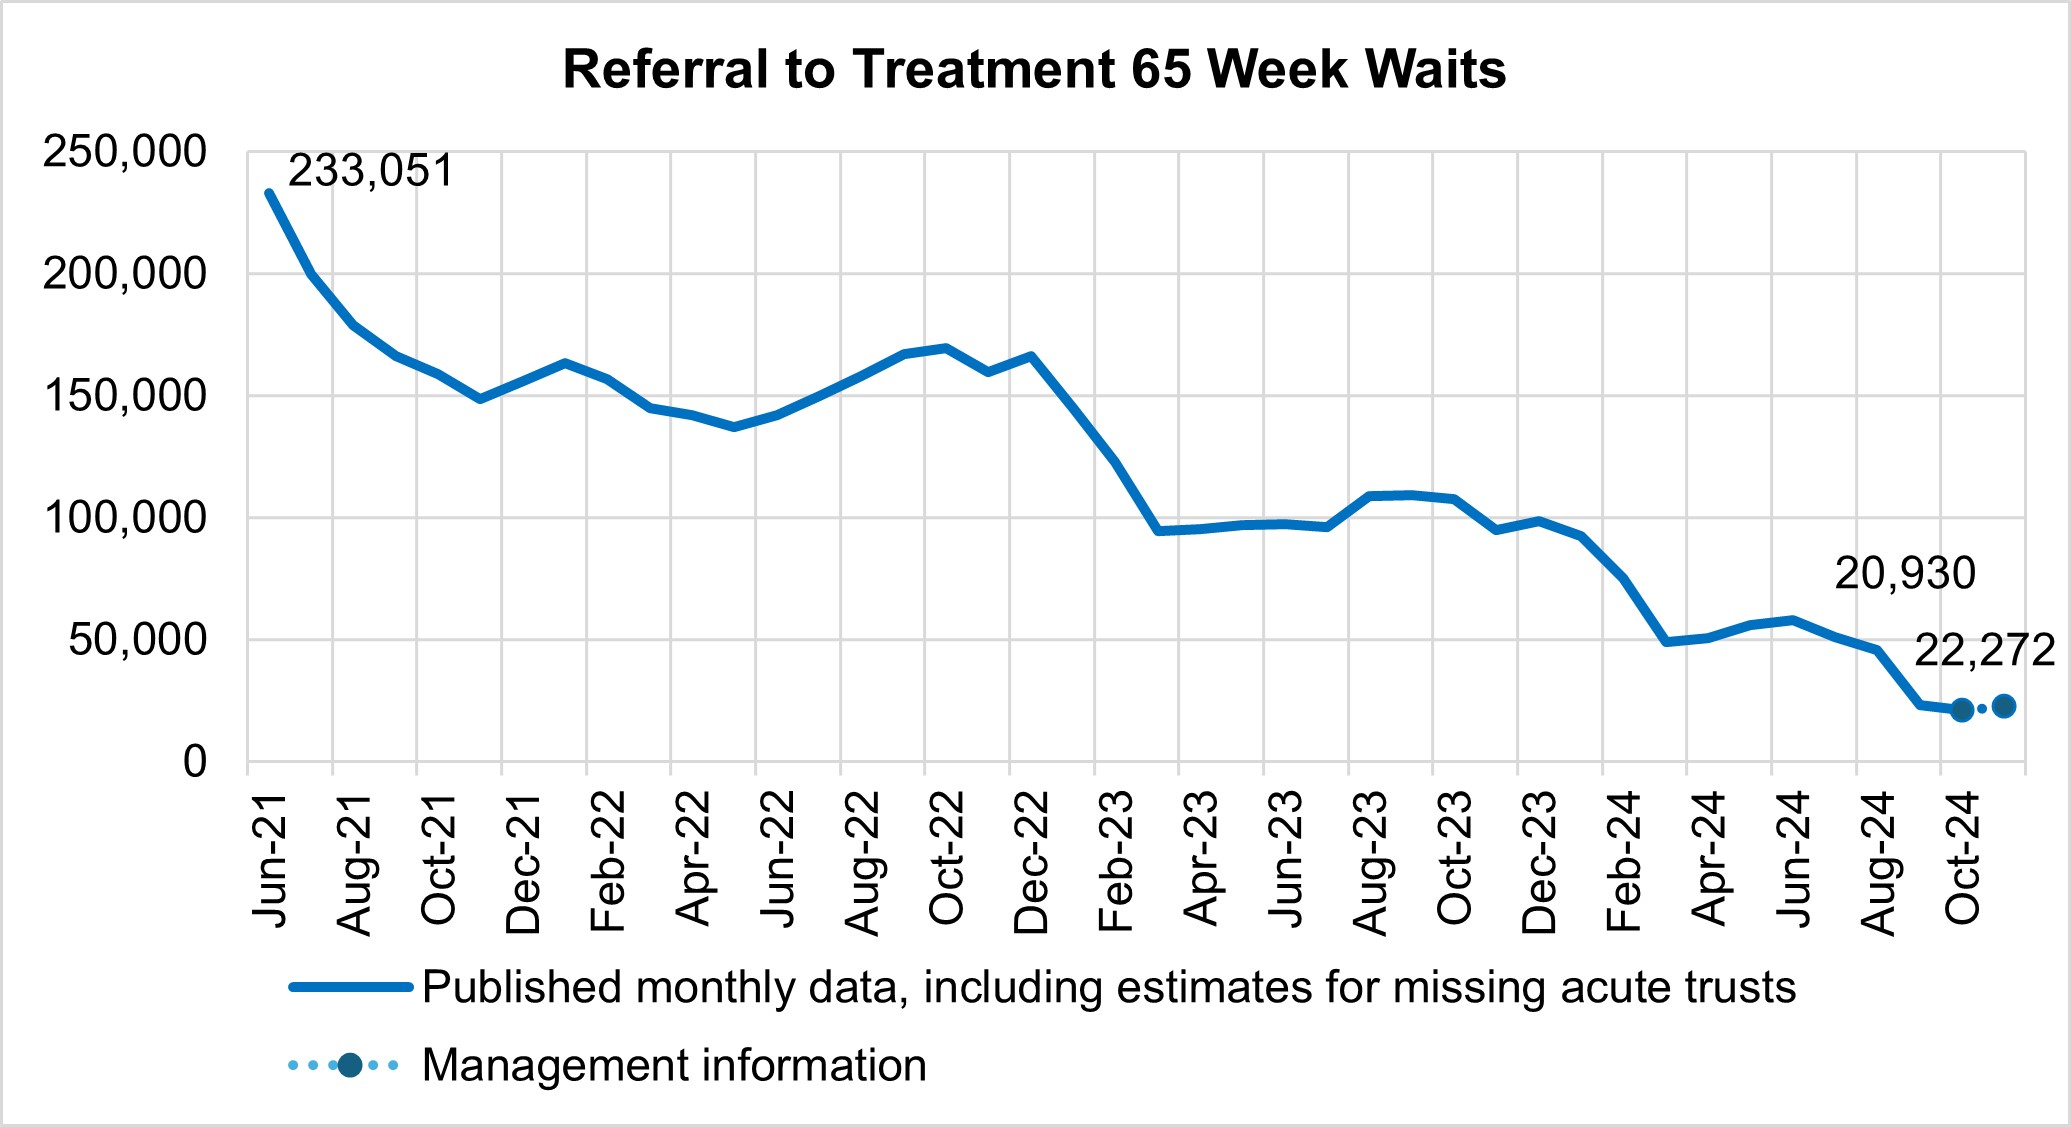
Waits of more than 65 weeks for treatment was 20,930 at the end of October, reduced compared to 107,291 at the end of October 2023 (down 80.5%) and 22,903 in September 2024 (down 8.6%). Additional management data suggests there were 22,272 waits of more than 65 weeks for treatment as of the end of November.
Referral to treatment 78 week waits
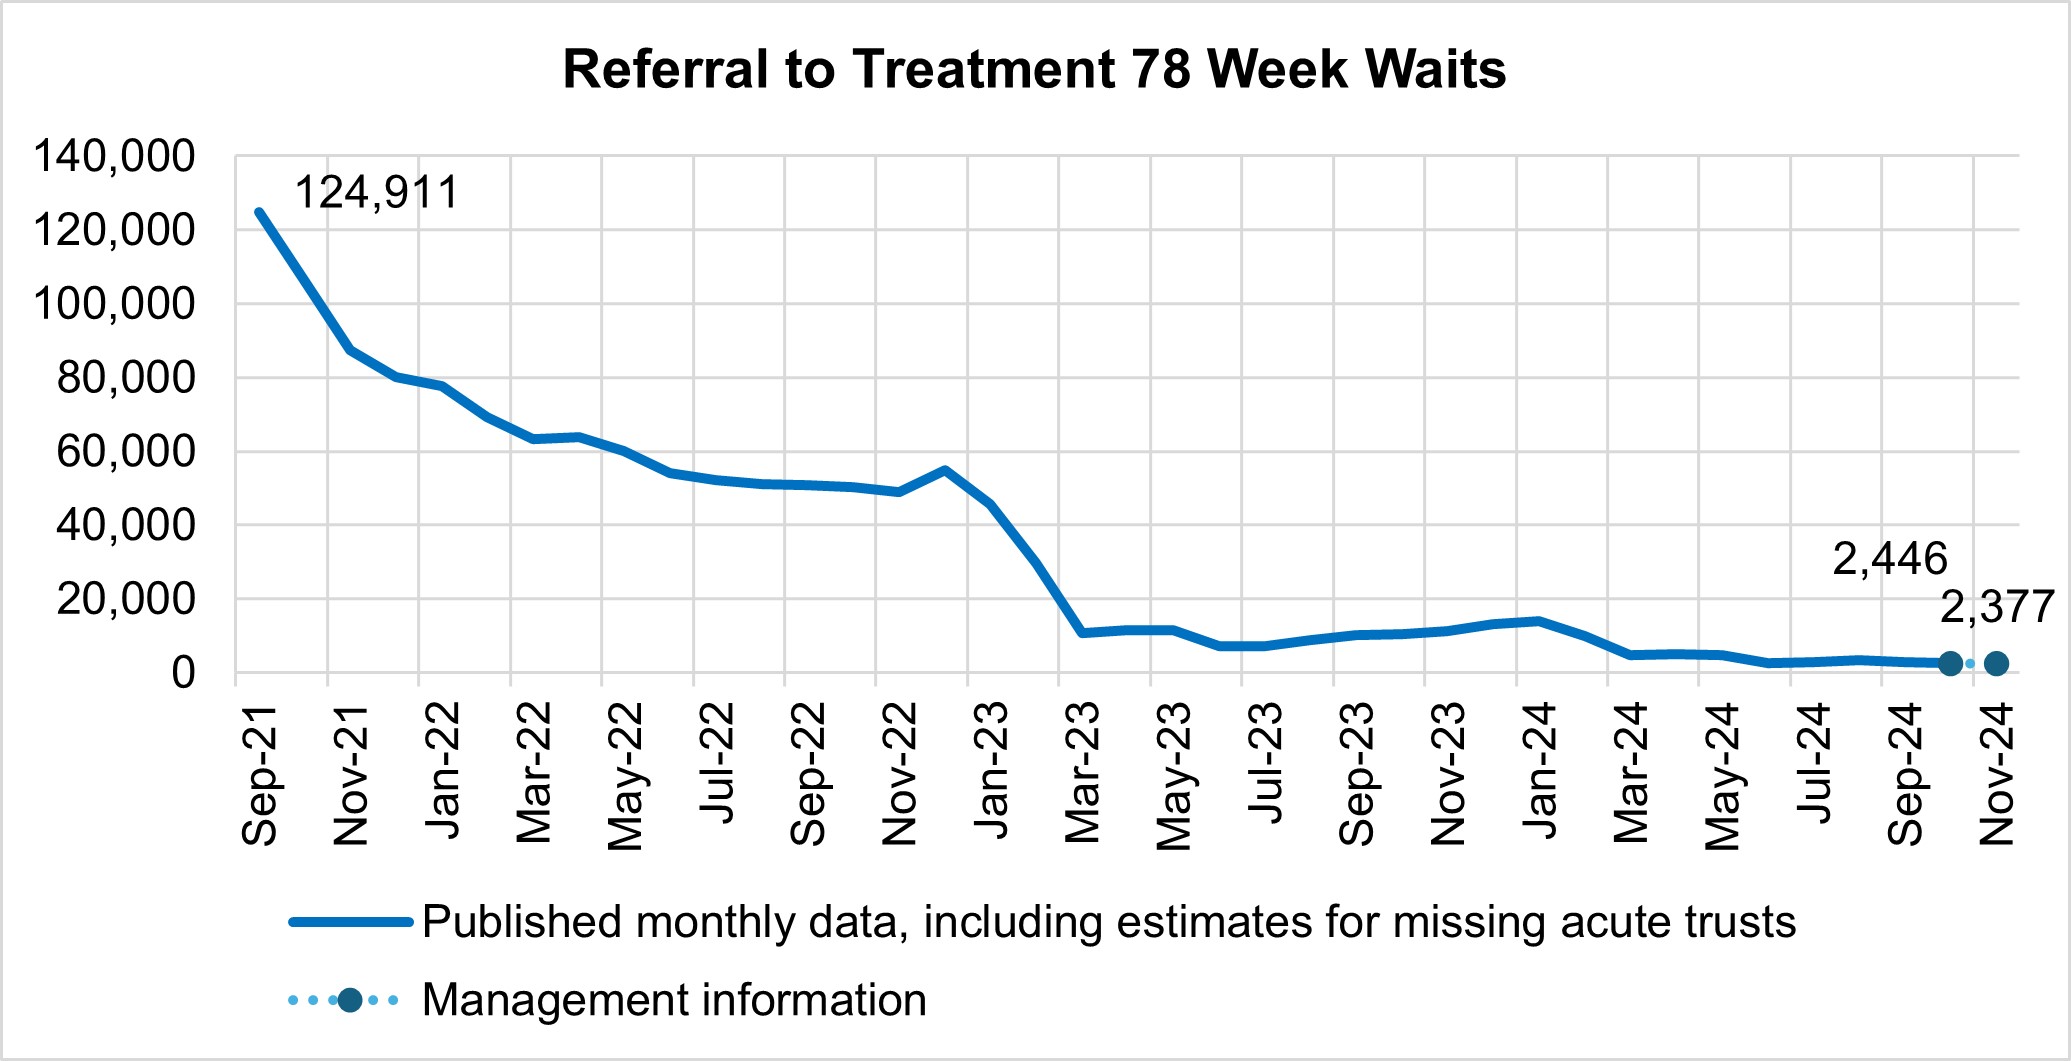
There has been a reduction in the longest waits for care, with 2,446 waits of more than 78 weeks for treatment at the end of October, compared to 10,508 at the end of October 23 (down 76.7%) and 2,703 in September 2024 (down 9.5%). Additional management data suggests there were 2,377 waits of more than 78 weeks for treatment as of the end of November.
Diagnostic 6 week waits
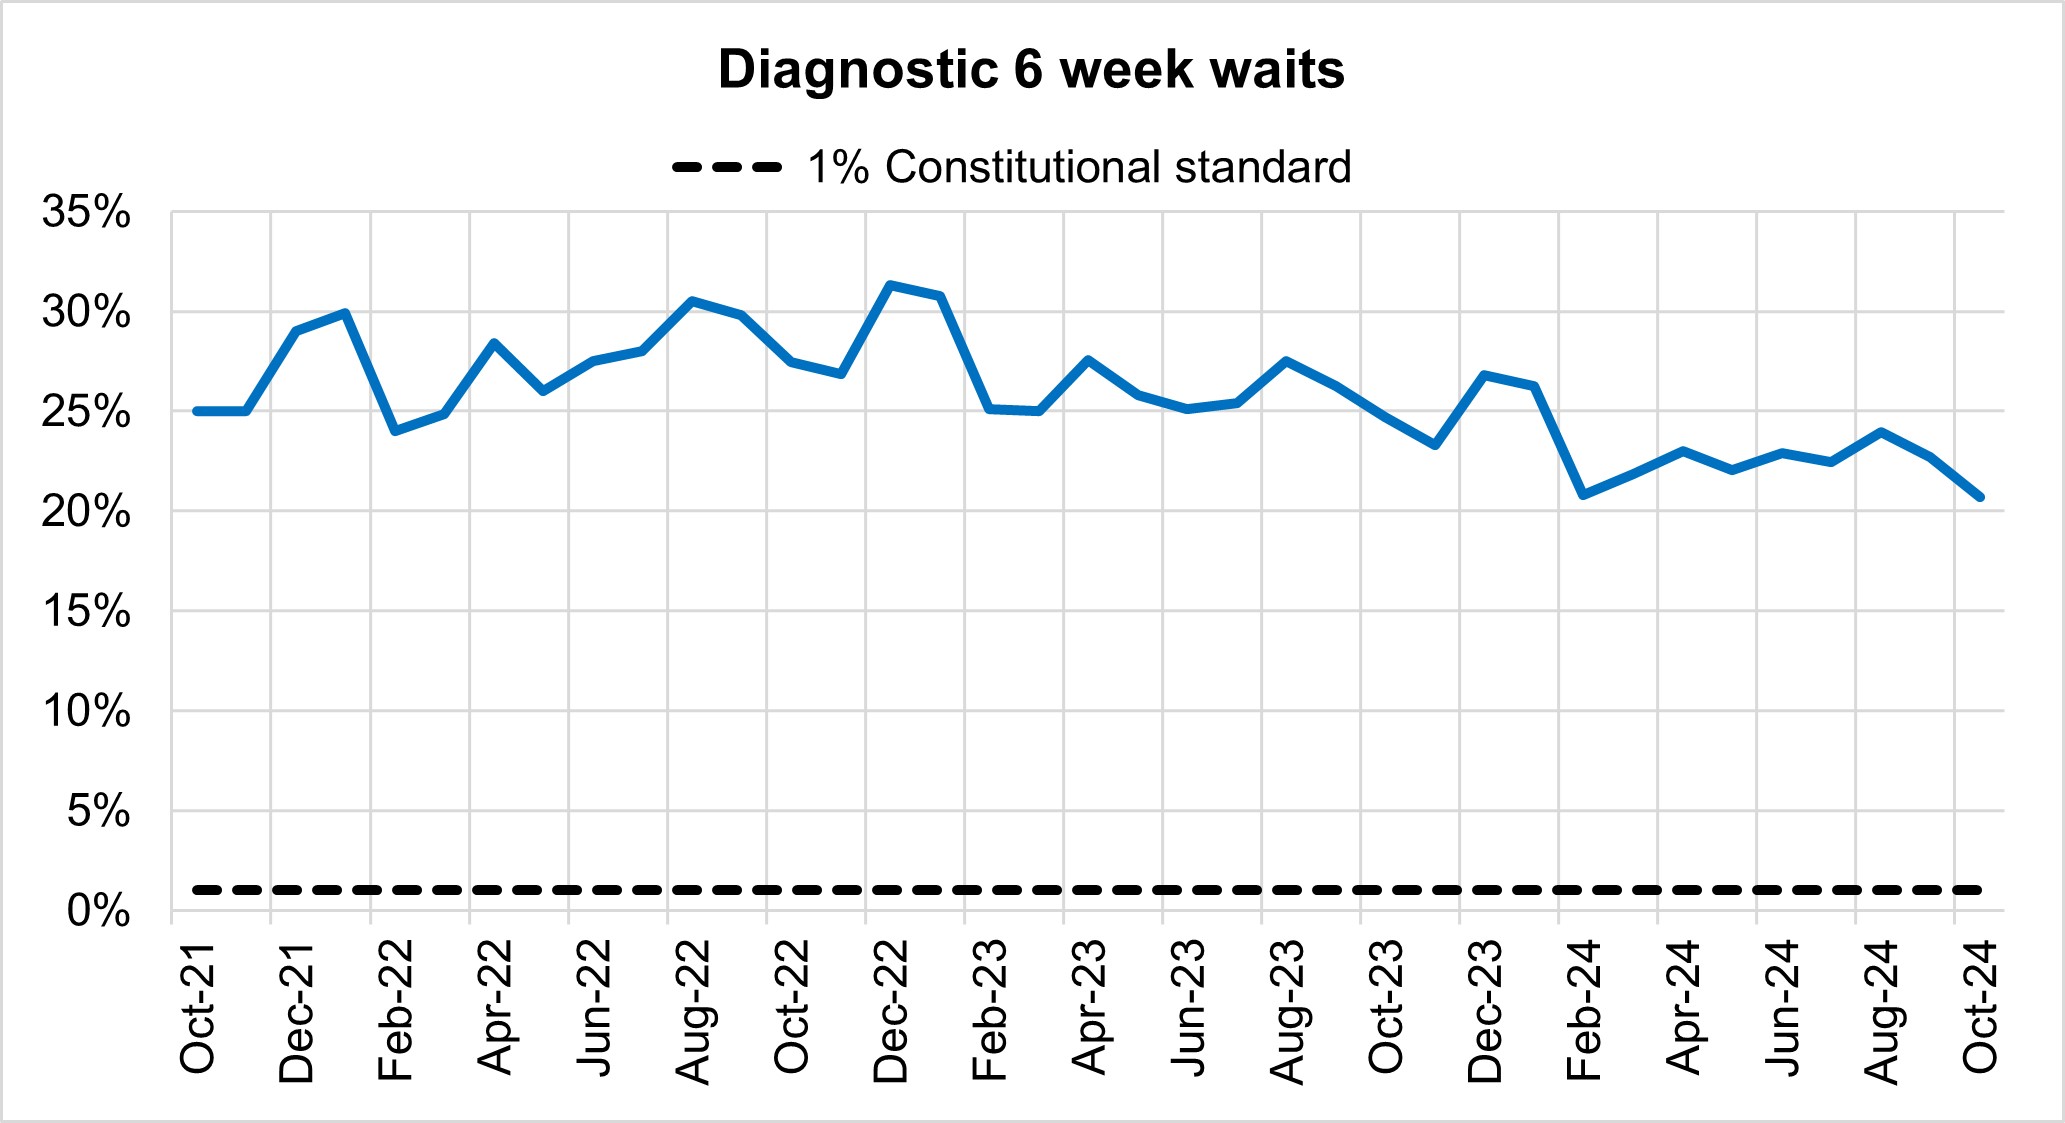
At the end of October, on the diagnostic waiting list there were 1.63 million waits, of which 337,227 had waited 6 weeks or more. The percentage of 6 week waits was 20.7%, down from 24.7% in October 2023. Progress is being made towards the interim recovery target of not more than 5% of the waiting list over 6 weeks and an increased percentage of diagnostic activity is supplied by Community Diagnostic Centres.
Cancer
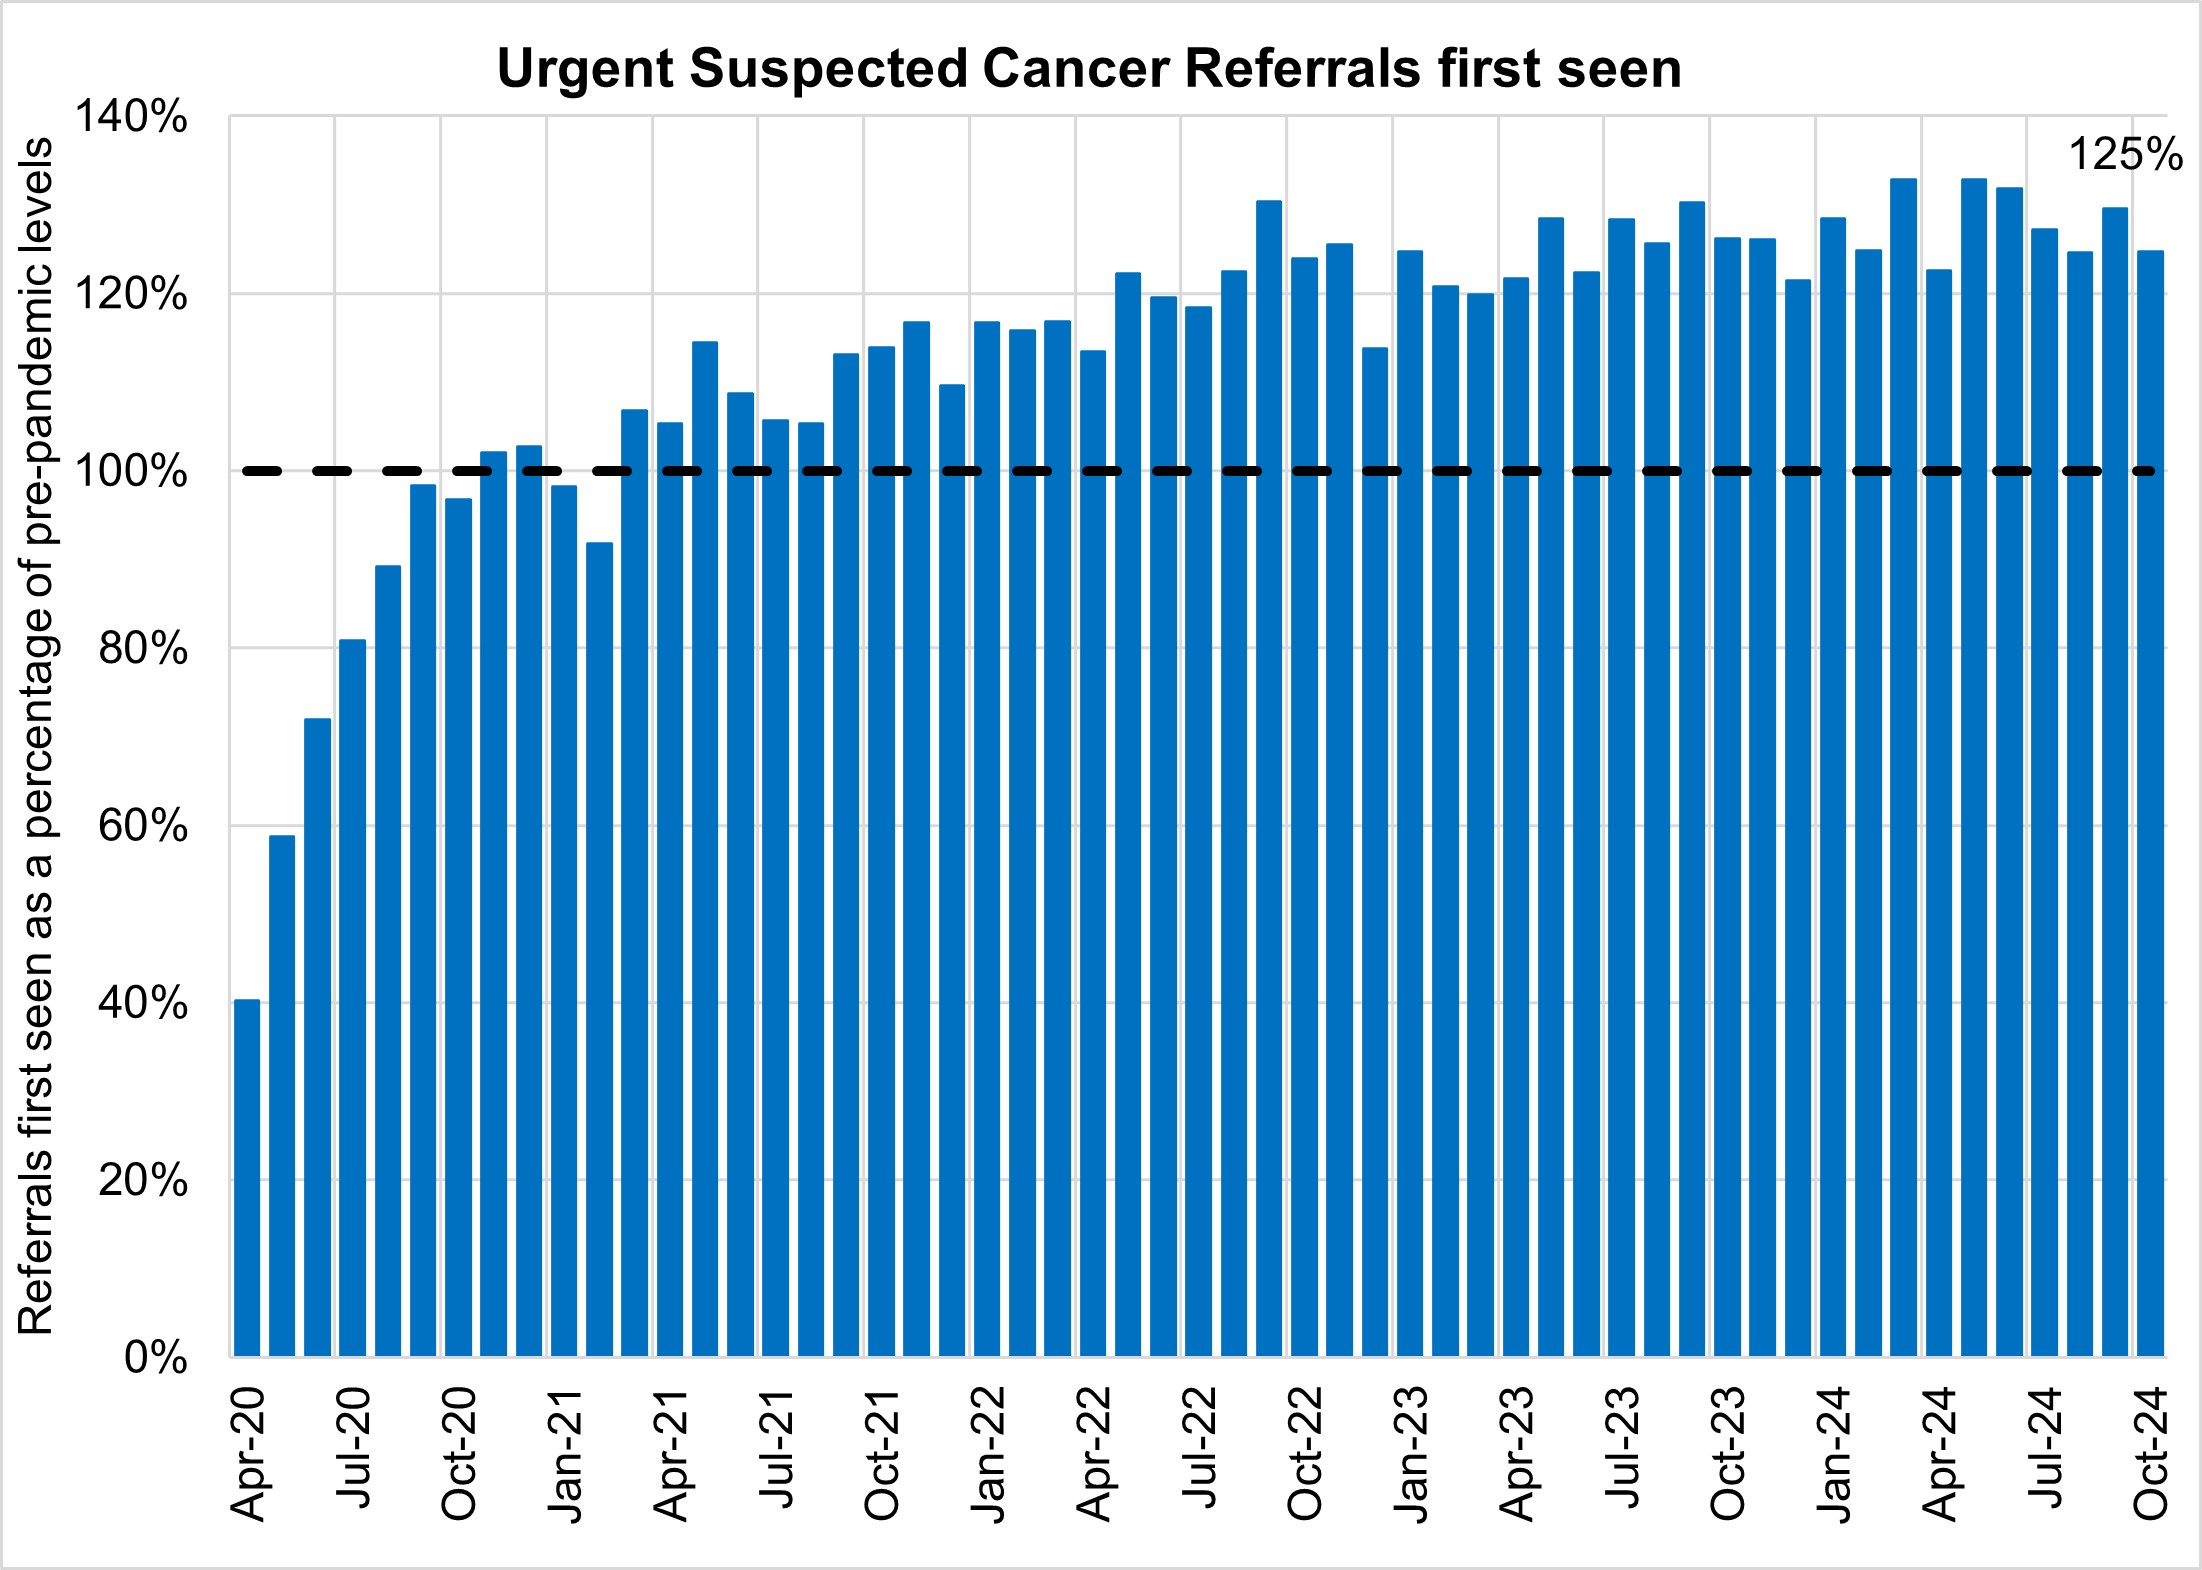
Urgent Suspected Cancer referrals have remained at high levels, with 11,943 referrals per working day in October 2024. This is 25% more referrals than the NHS was seeing before the pandemic – the equivalent of 2,300 more referrals per working day.
Treatment activity was also at a record high level with nearly 1,400 patients starting cancer treatment per working day, 13% above pre-pandemic levels.
Urgent suspected cancer referrals first seen
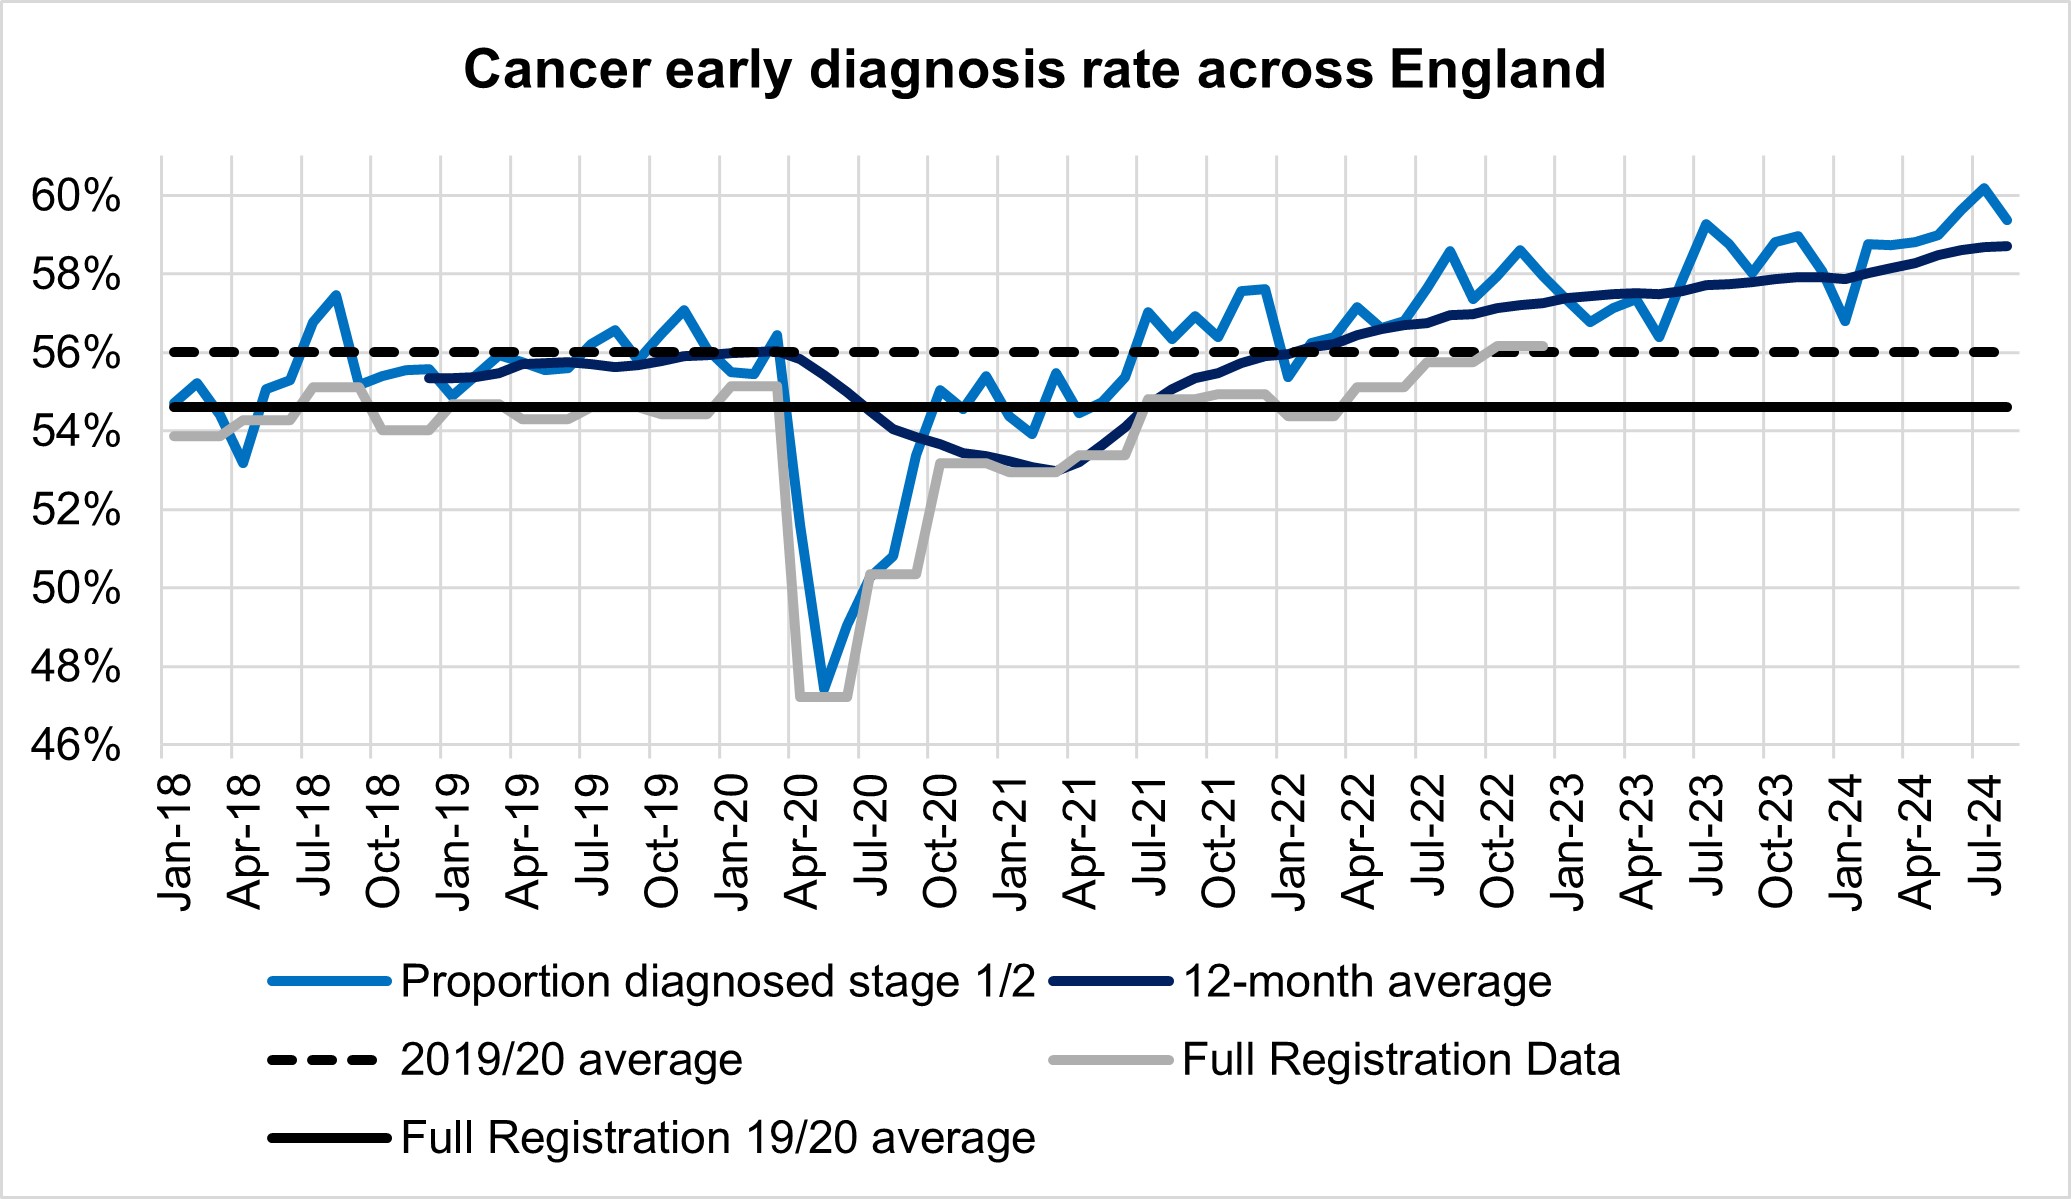
The increase in referrals has also contributed to increases in early diagnosis, which are now about 2 percentage points higher than before the pandemic. Cancer survival also continues to improve. In 2023, the Annals of Oncology published findings showing that cancer deaths are around 10% lower in the UK compared to five years ago.
Cancer early diagnosis rate across England
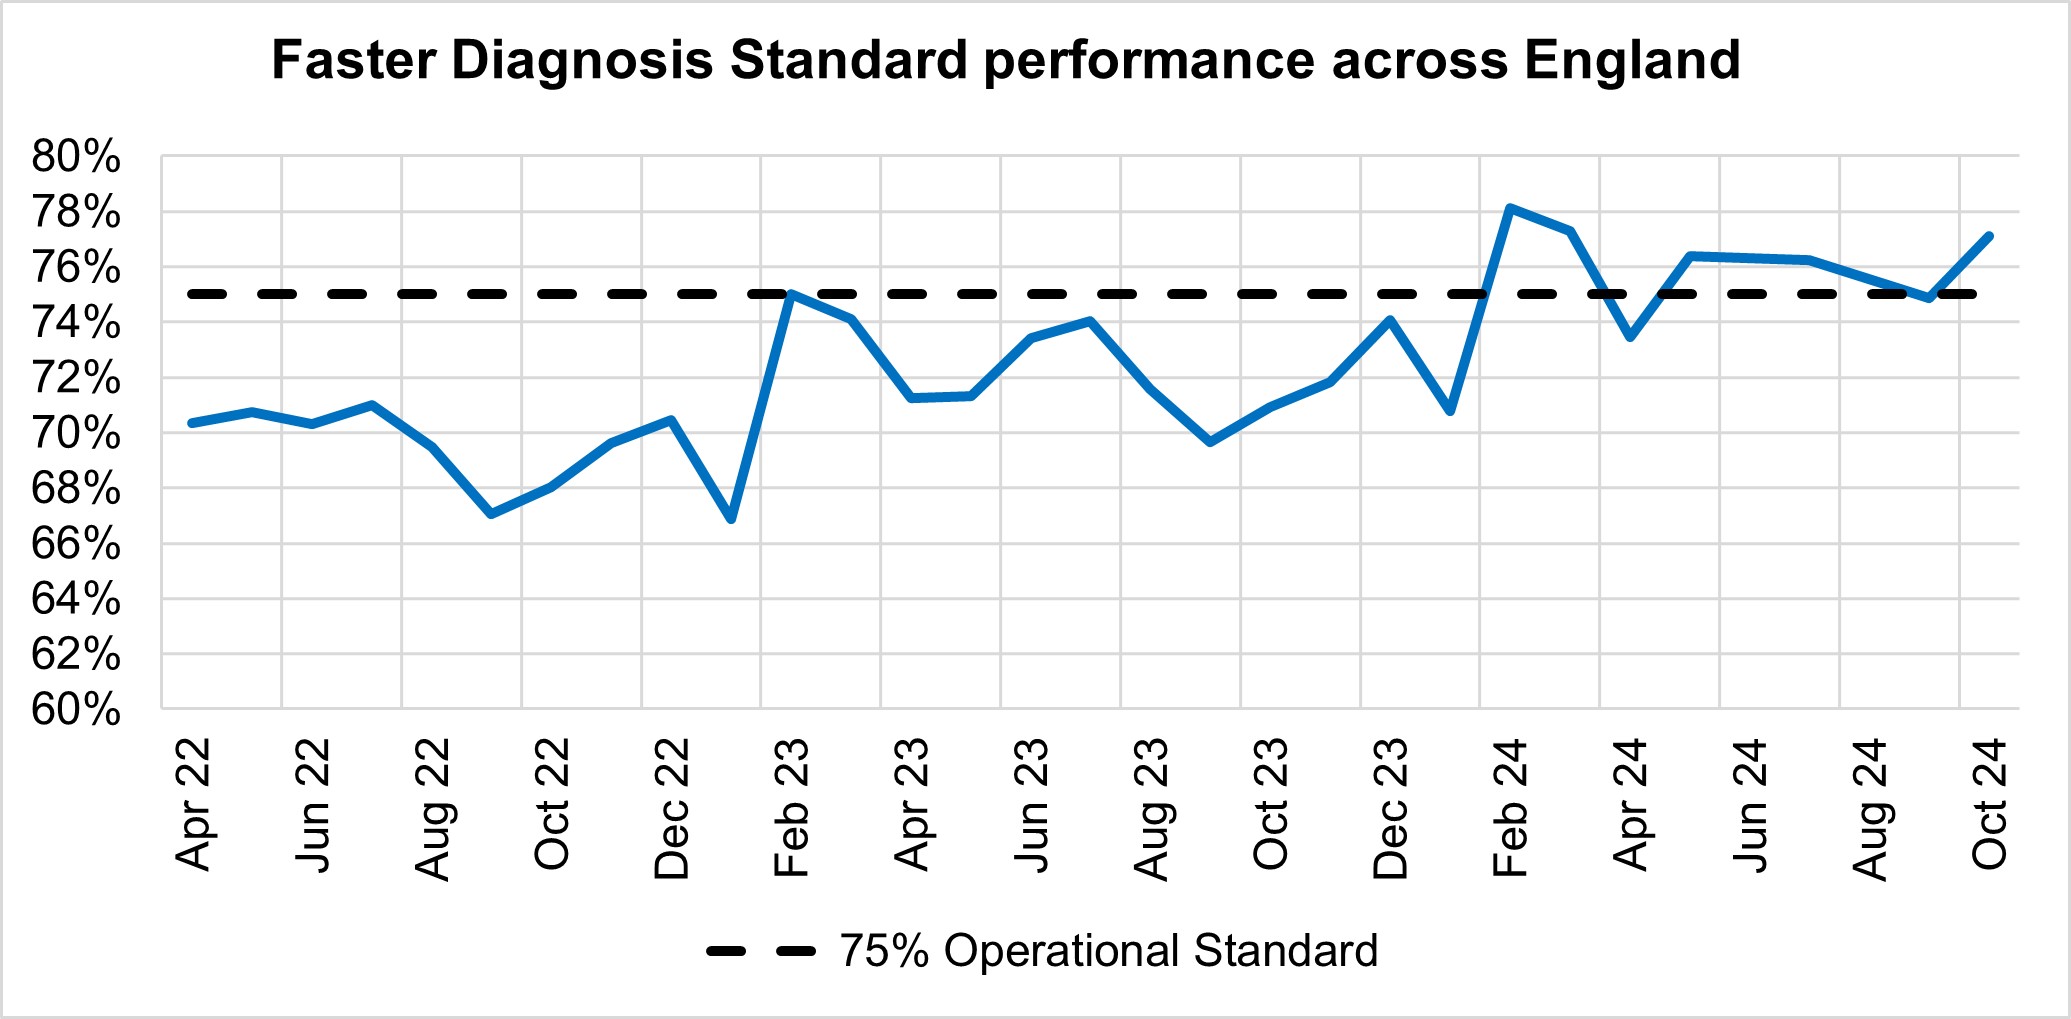
The NHS is working hard to keep up with this increase in demand. It has been accelerating the installation of new diagnostic capacity, much of it in Community Diagnostic Centres. Performance against the 28 day faster diagnosis standard in October was 77.1%, which is above the NHS constitutional standard of 75% and represents a 6.2% improvement compared to the same point last year and 2.2% improvement on September 2024.
Faster Diagnosis Standard performance across England
In October, performance against the 62 day Urgent Referral to First Treatment Standard was 68.2% which was 5.0% higher than at the same point last year, and 0.5% higher than September 2024, but still well below where we want to see it. The NHS has set the ambition to improve this to 70% by March 2025, as a first step in recovering performance to the NHS constitutional standard of 85%.
Autism
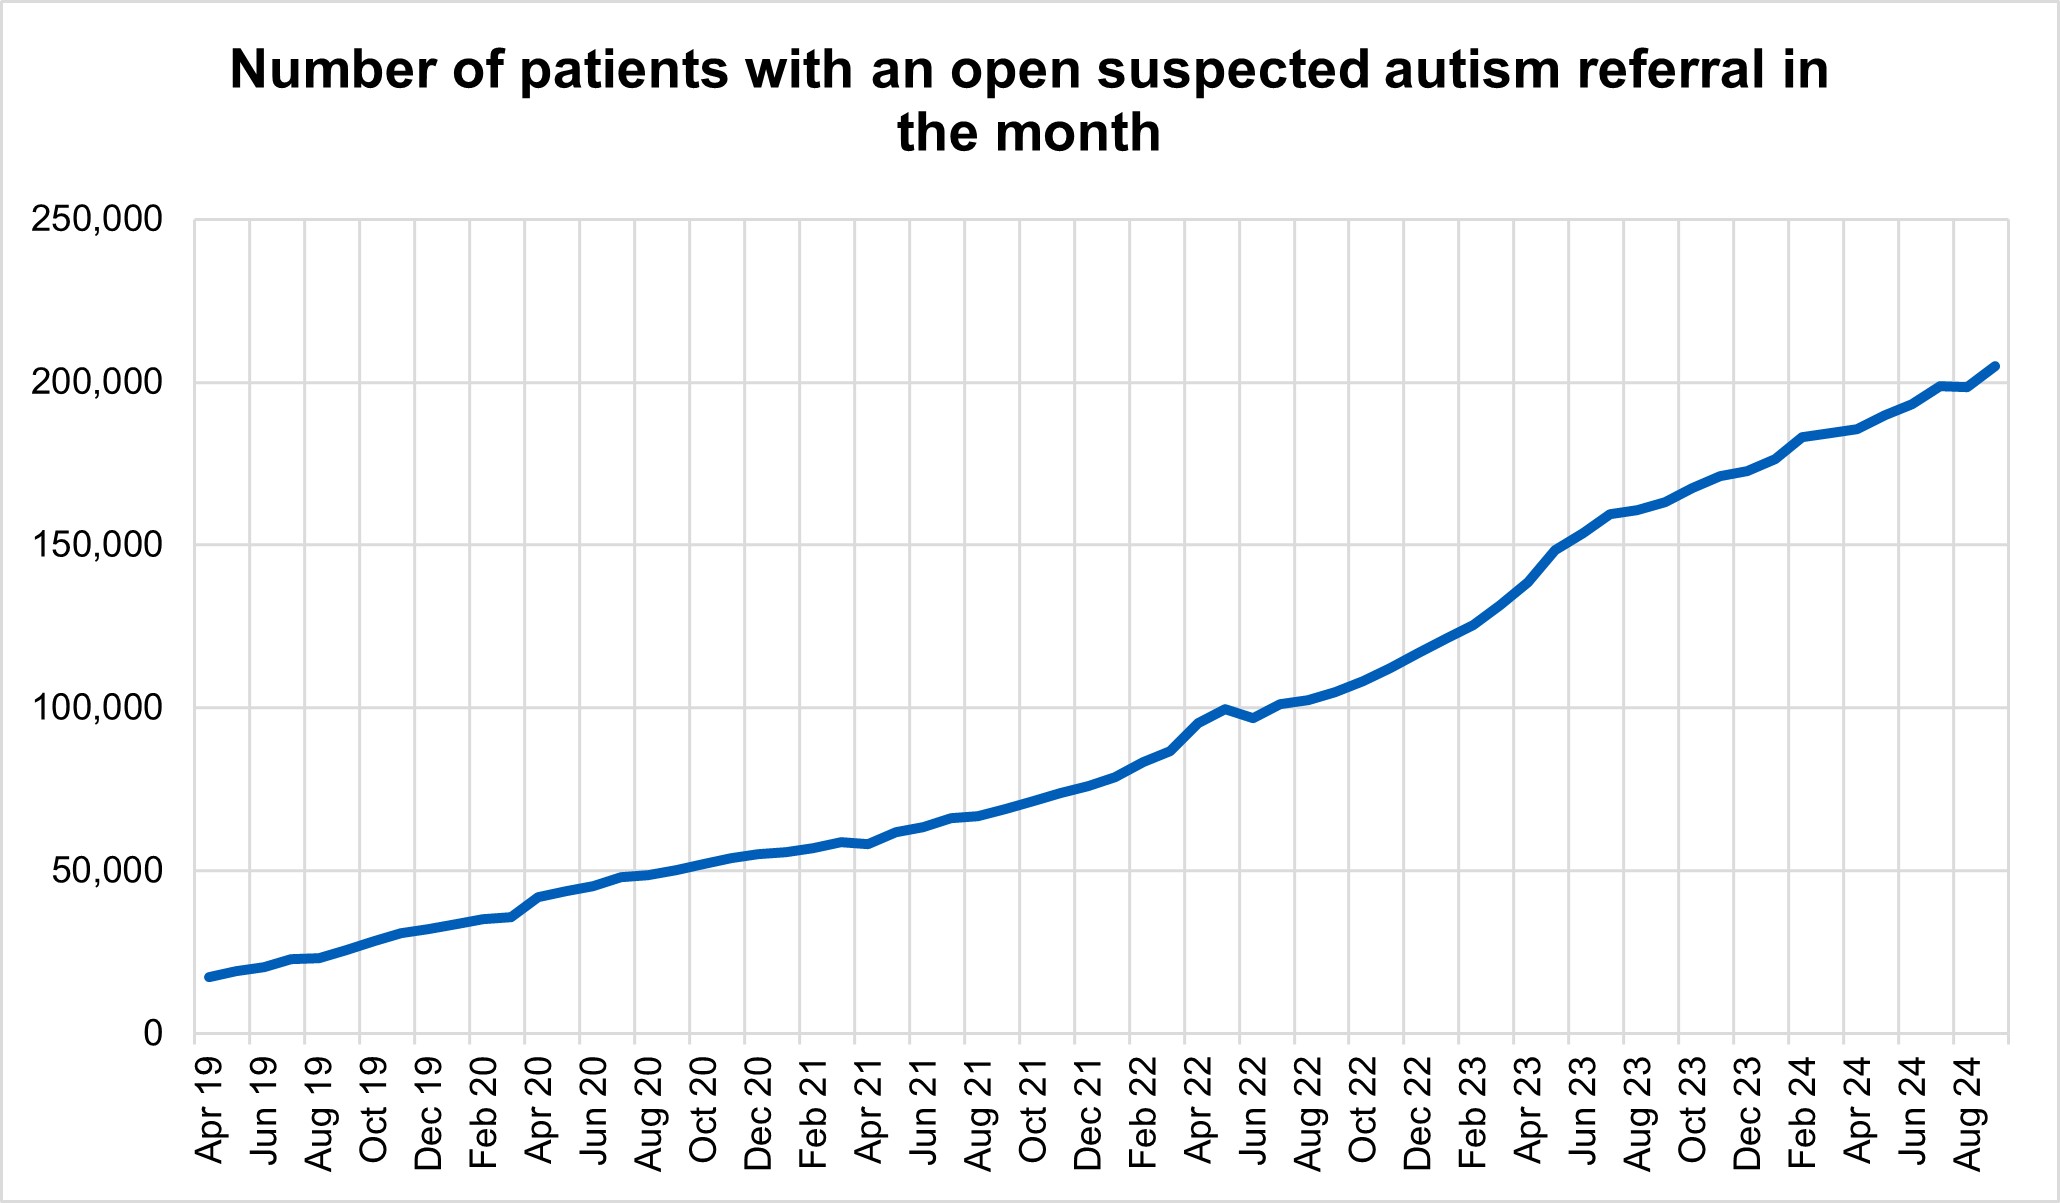
The NHS has seen consistent growth in demand for autism assessments since April 2019. In September 2024, there were 204,876 people with an open referral for ‘suspected autism’* which is a 20% (163,313) increase since September 2023. Of those people with an open referral, 89.4% (183,200) had a referral which had been open for 13 weeks or longer and 148,208 of these referrals had yet to begin an assessment.+
*This is when the presenting condition or symptom for which the patient was referred to the service is recorded as being ‘suspected autism’.
+When a person first attends a care contact is taken as a proxy for beginning an assessment within these statistics.
Number of patients with an open suspected autism referral in the month
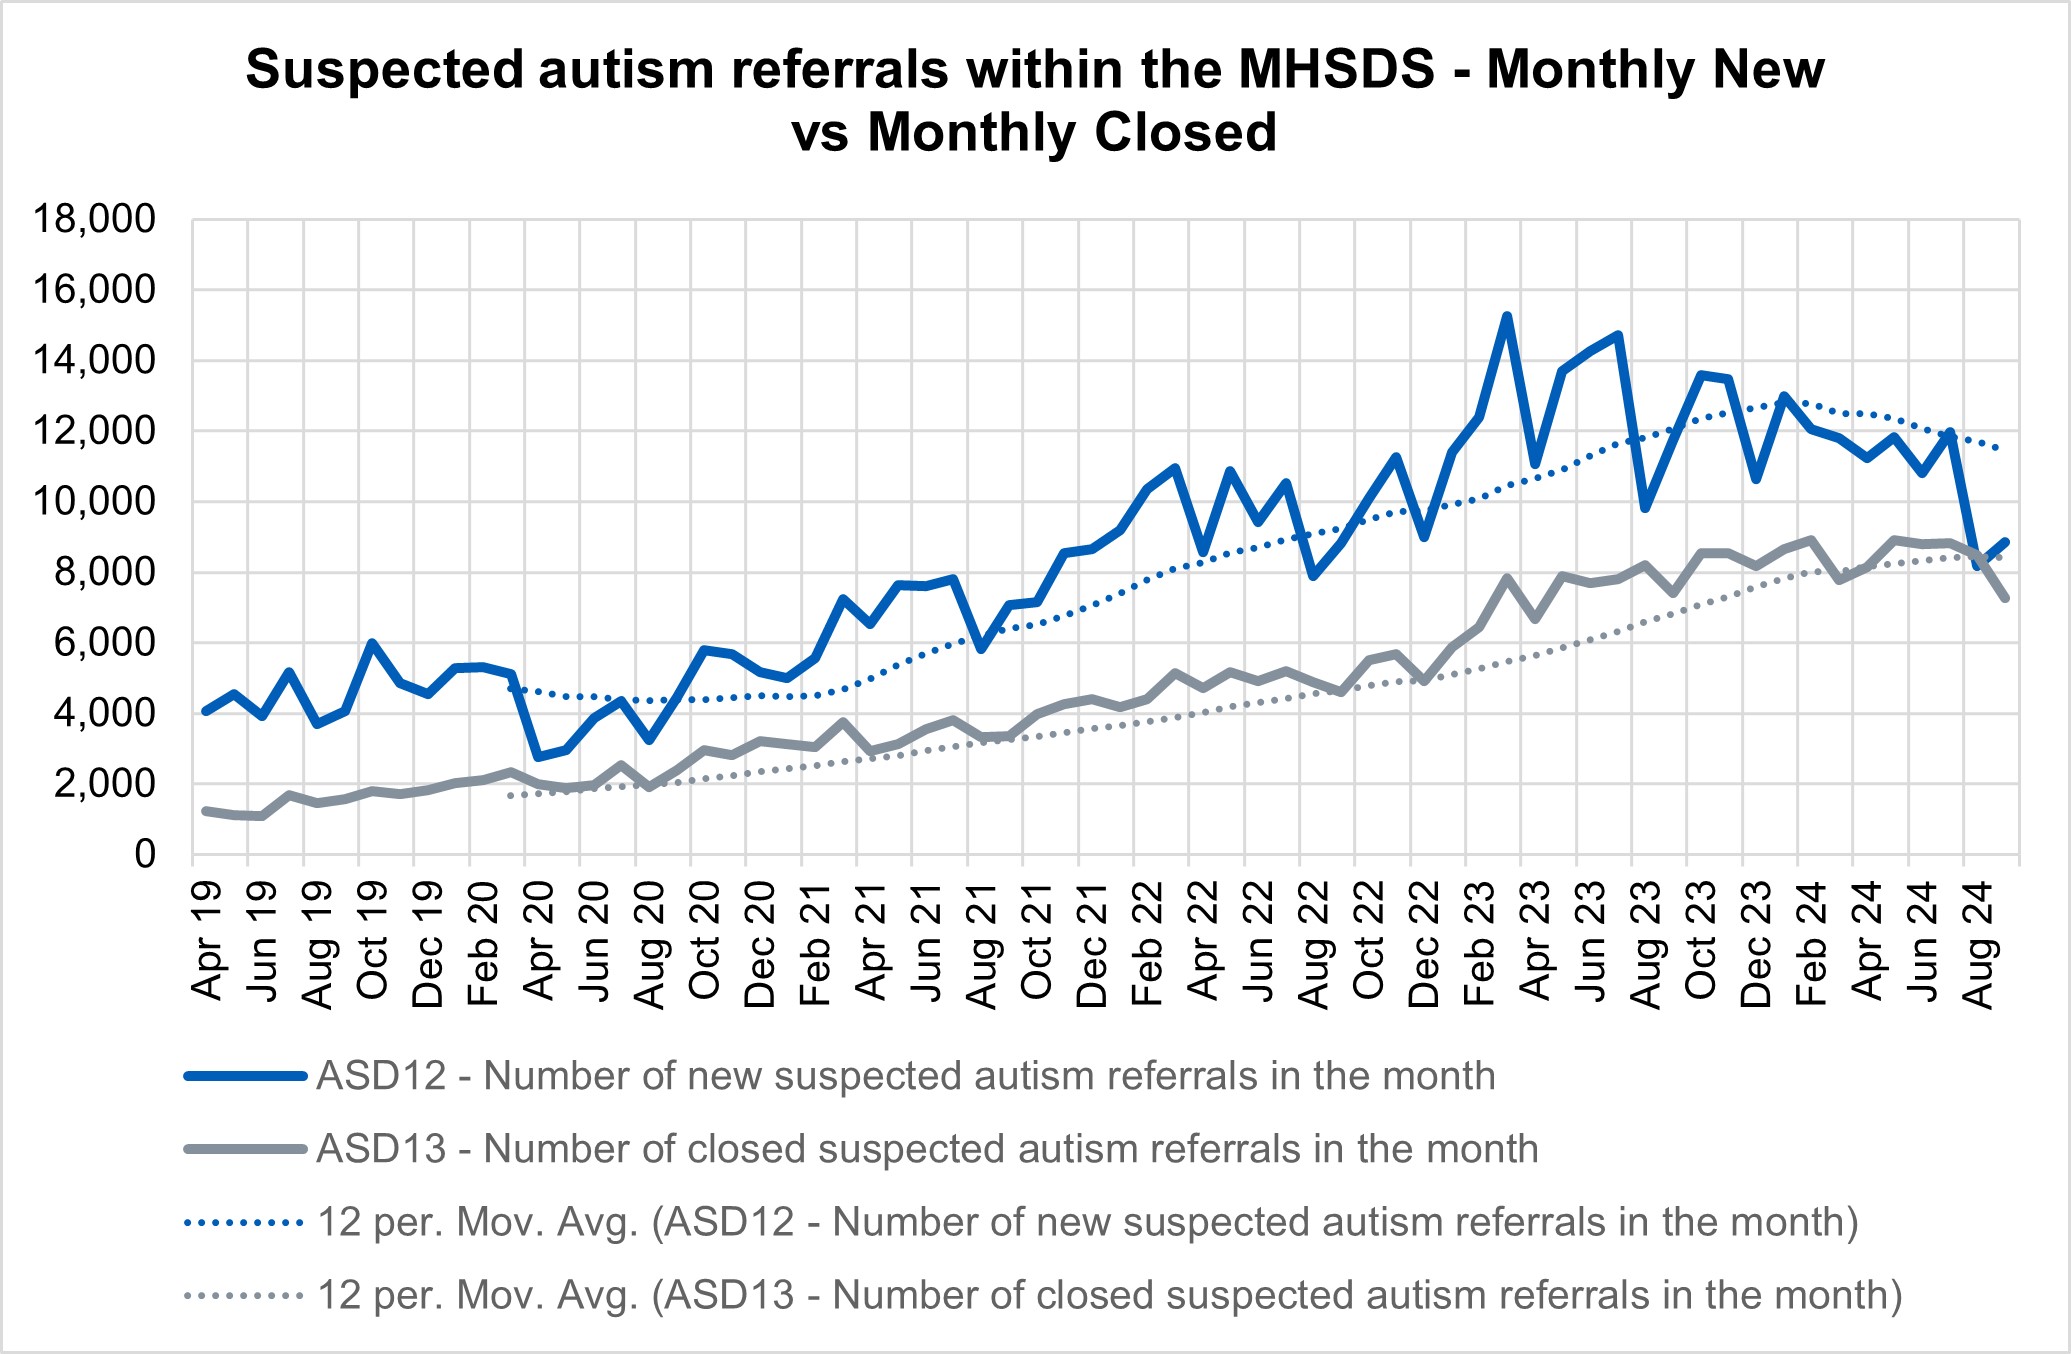
The general trend shows a narrowing of the gap between new referrals for suspected autism and closed referrals in the month. This is partly due to a reduction in the number of new suspected autism referrals per month since January 2024.
However, the NHS is also delivering an ongoing and sustained increase in the number of suspected autism referrals closed per month. In the six months from April -Sept 24 there were 50,4185 referrals closed, compared to 29,481 referrals closed in the 6 months April 22-Sept 22.
Suspected autism referrals within the MHSDS – monthly new vs monthly closed
The NHS is making sustained progress on the number of autism referral closures. However, the level of demand for assessment is still high and significant continued resources will be required for the NHS to clear the backlog of open referrals and reduce waiting times.