
Executive summary
This briefing draws on official statistics published here.
- There was a total of 2,218,130 attendances at A&E departments across England in January. The average daily attendances decreased to 71,553, this is 5.4% lower than December’s daily average and 0.6% lower than January 2023.
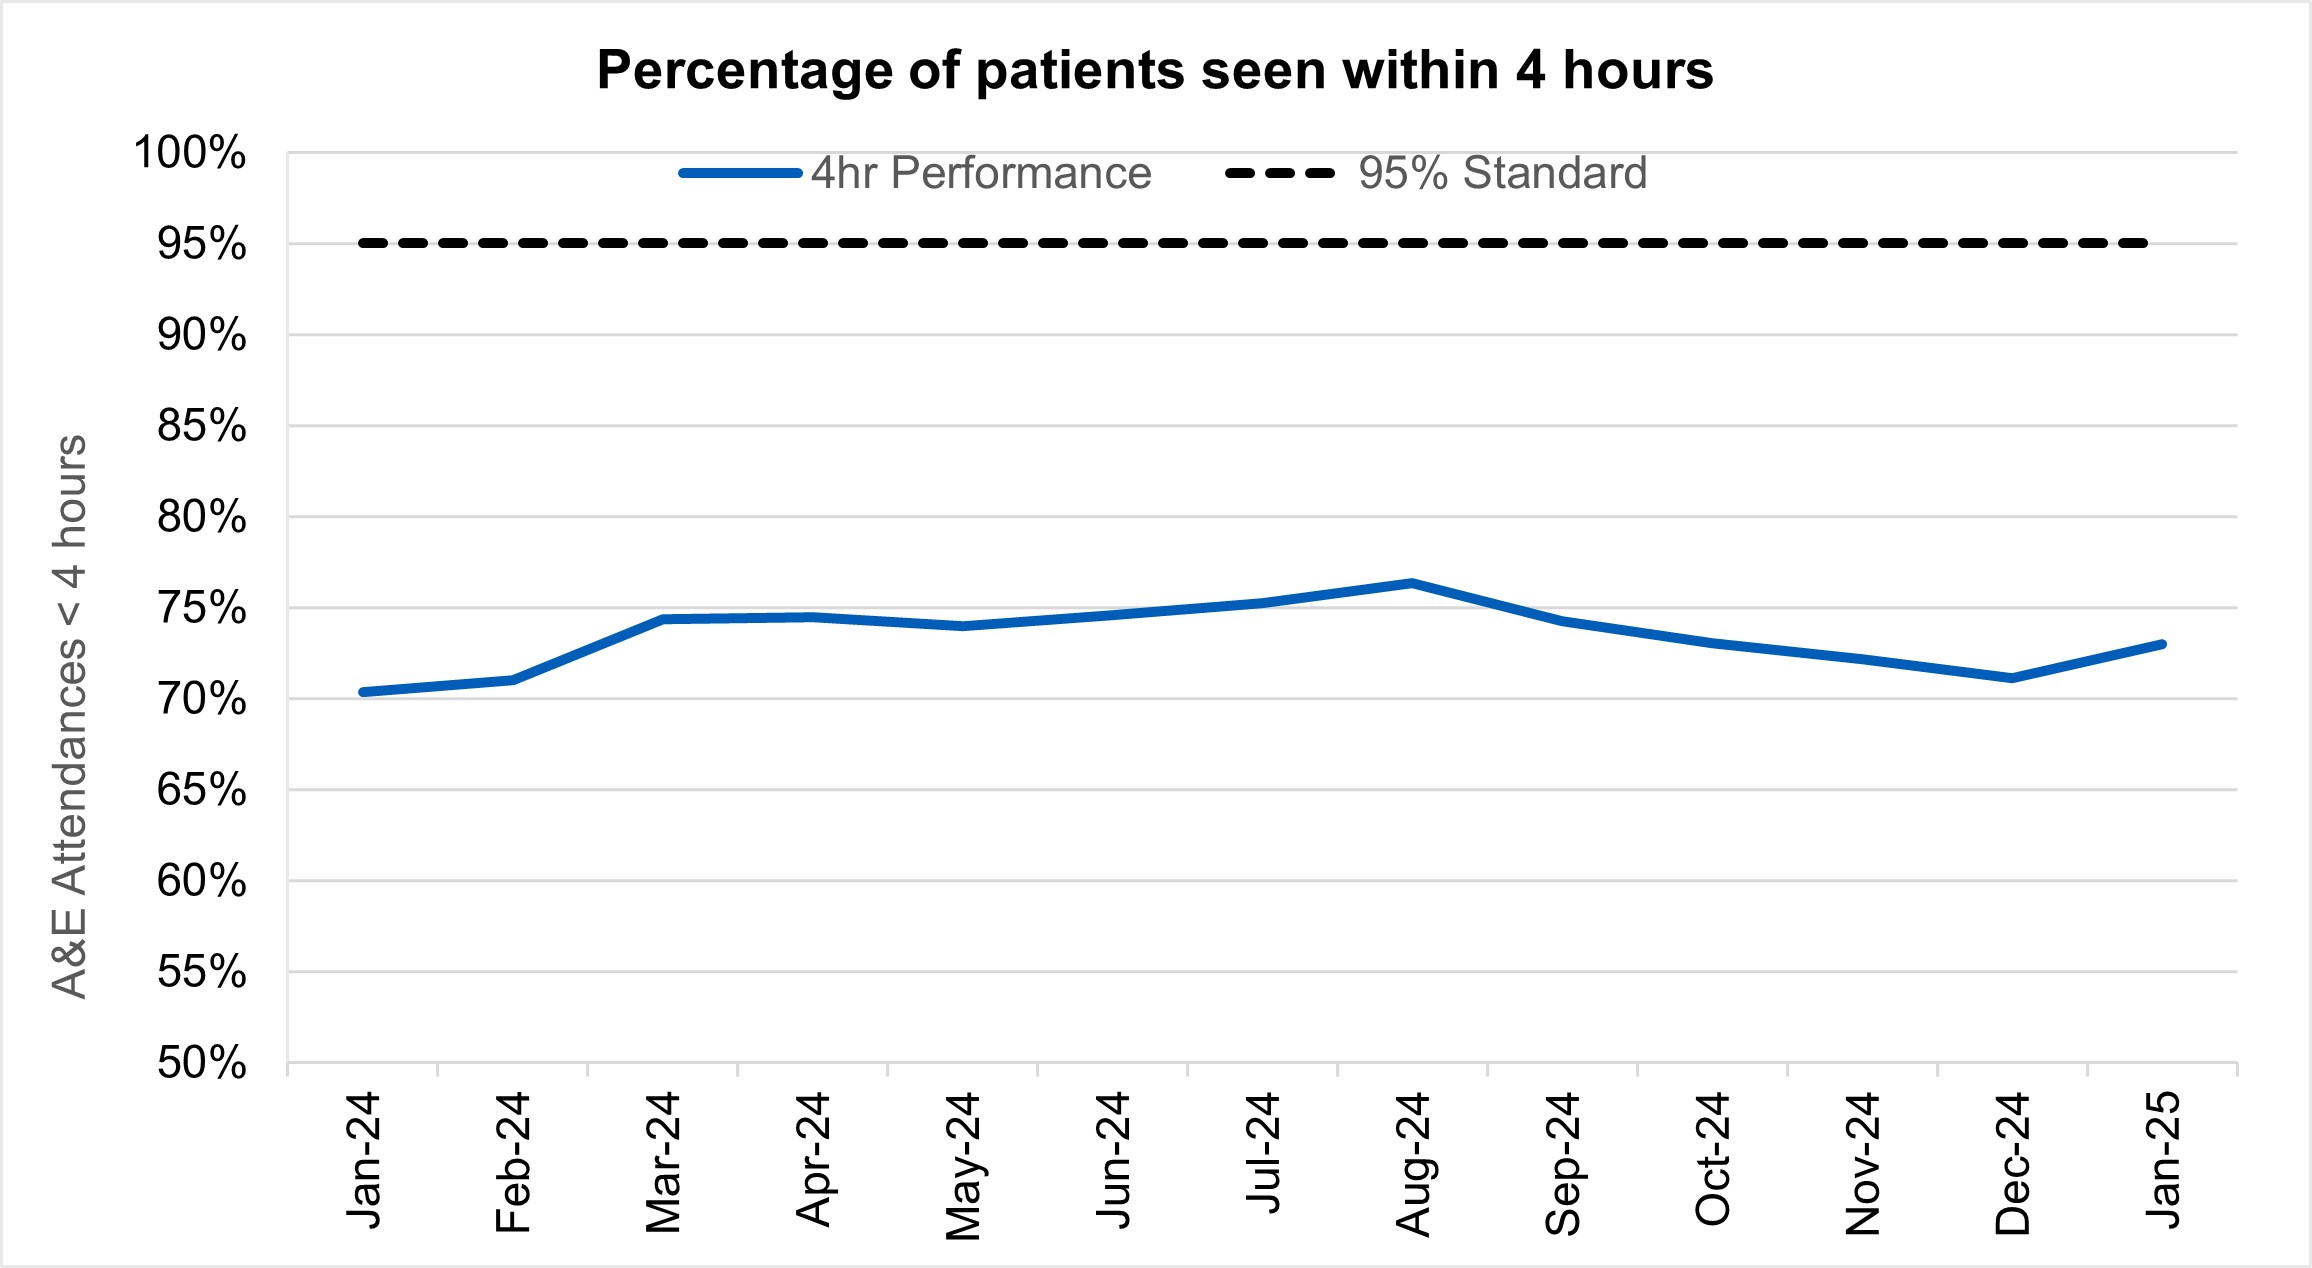
- 73.0% of patients were admitted, transferred or discharged within four hours. This is an improvement from 71.1% in December, and an improvement from 70.4% in January 2024, but below the NHS constitutional standard of 95%.
- NHS staff delivered a record 18 million treatments in 2024, as the waiting list fell in December for the fourth month in a row.
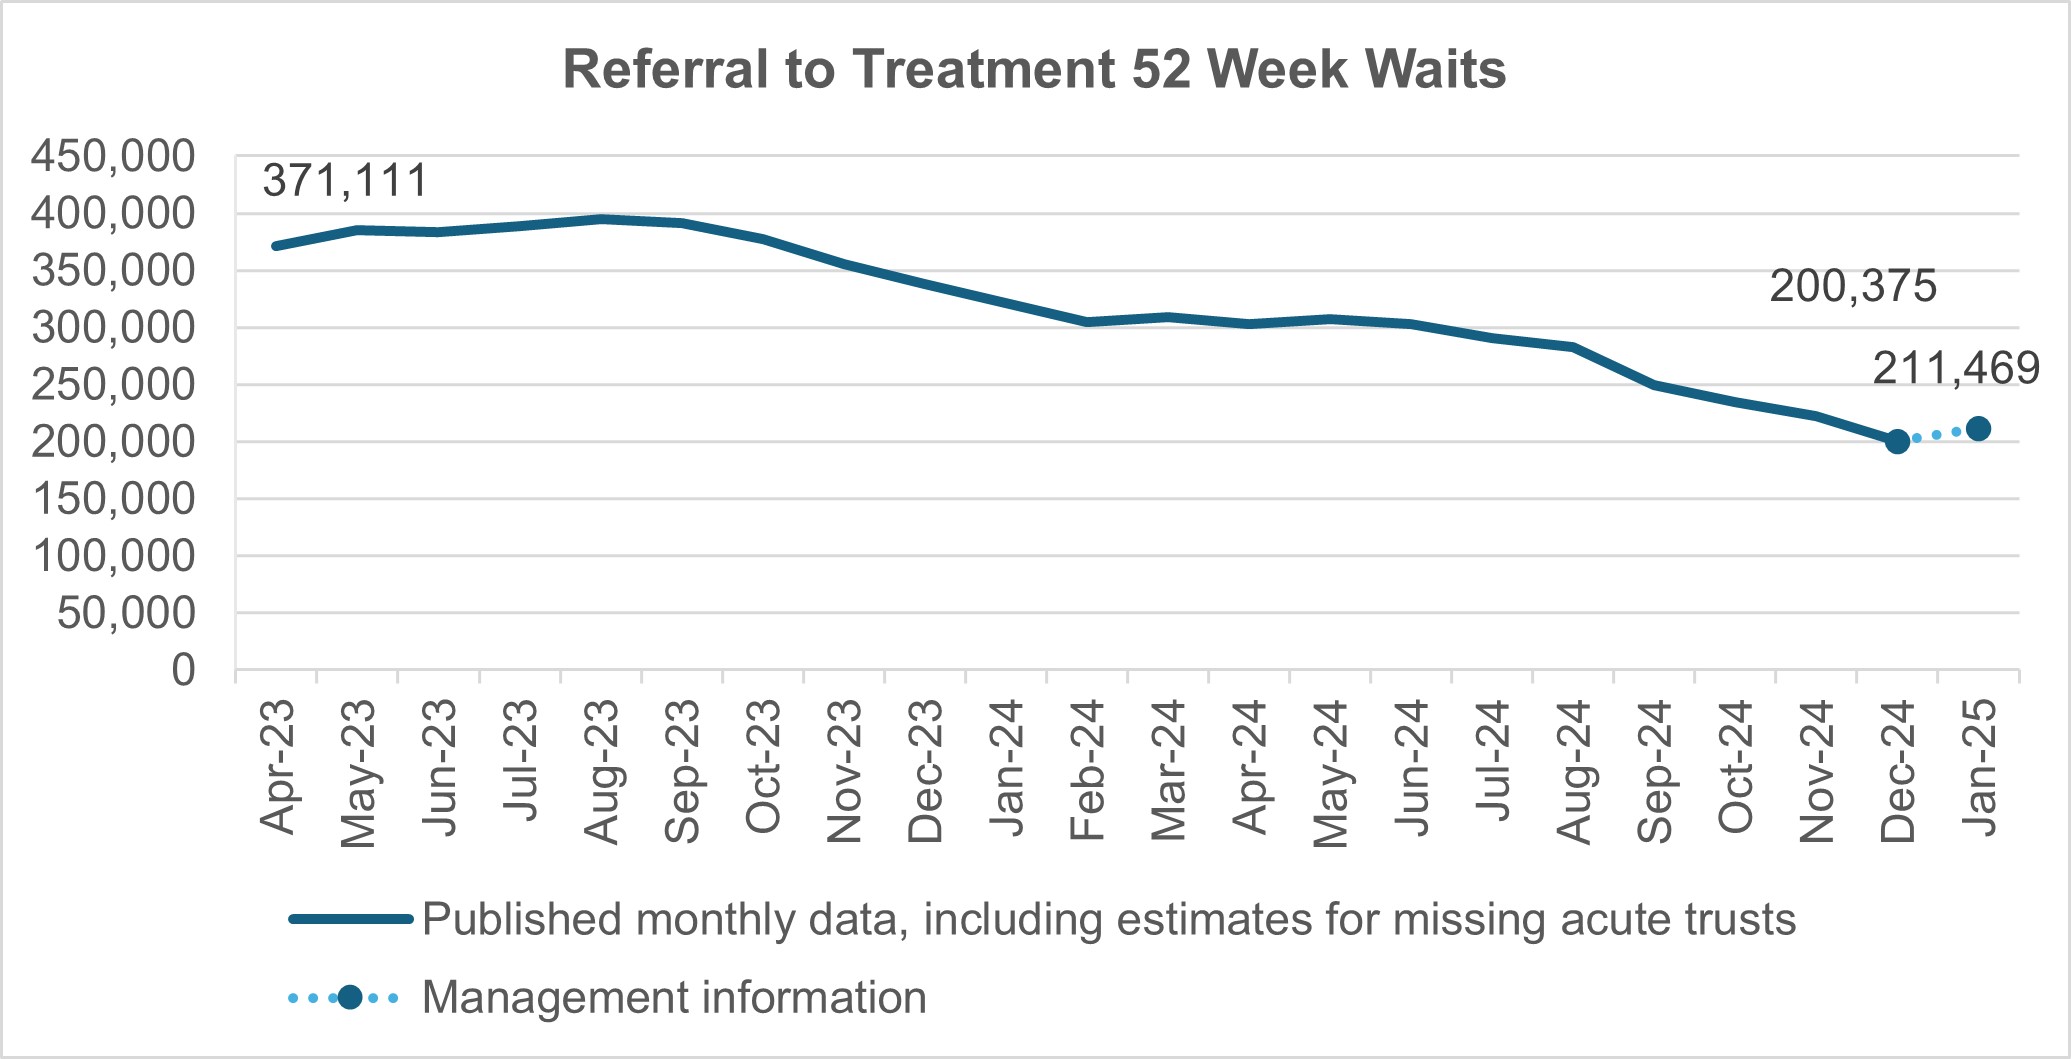
- There were 200,375 waits of more than 52 weeks for treatment at the end of December, compared to 338,070 at the end of December 23 (down 40.7%) and 221,889 at the end of November 24 (down 9.7%).
- Waits of more than 65 weeks for treatment was 15,568 at the end of December, reduced compared to 98,567 at the end of December 2023 (down 84.2%) and 16,904 in November 2024 (down 7.9%).
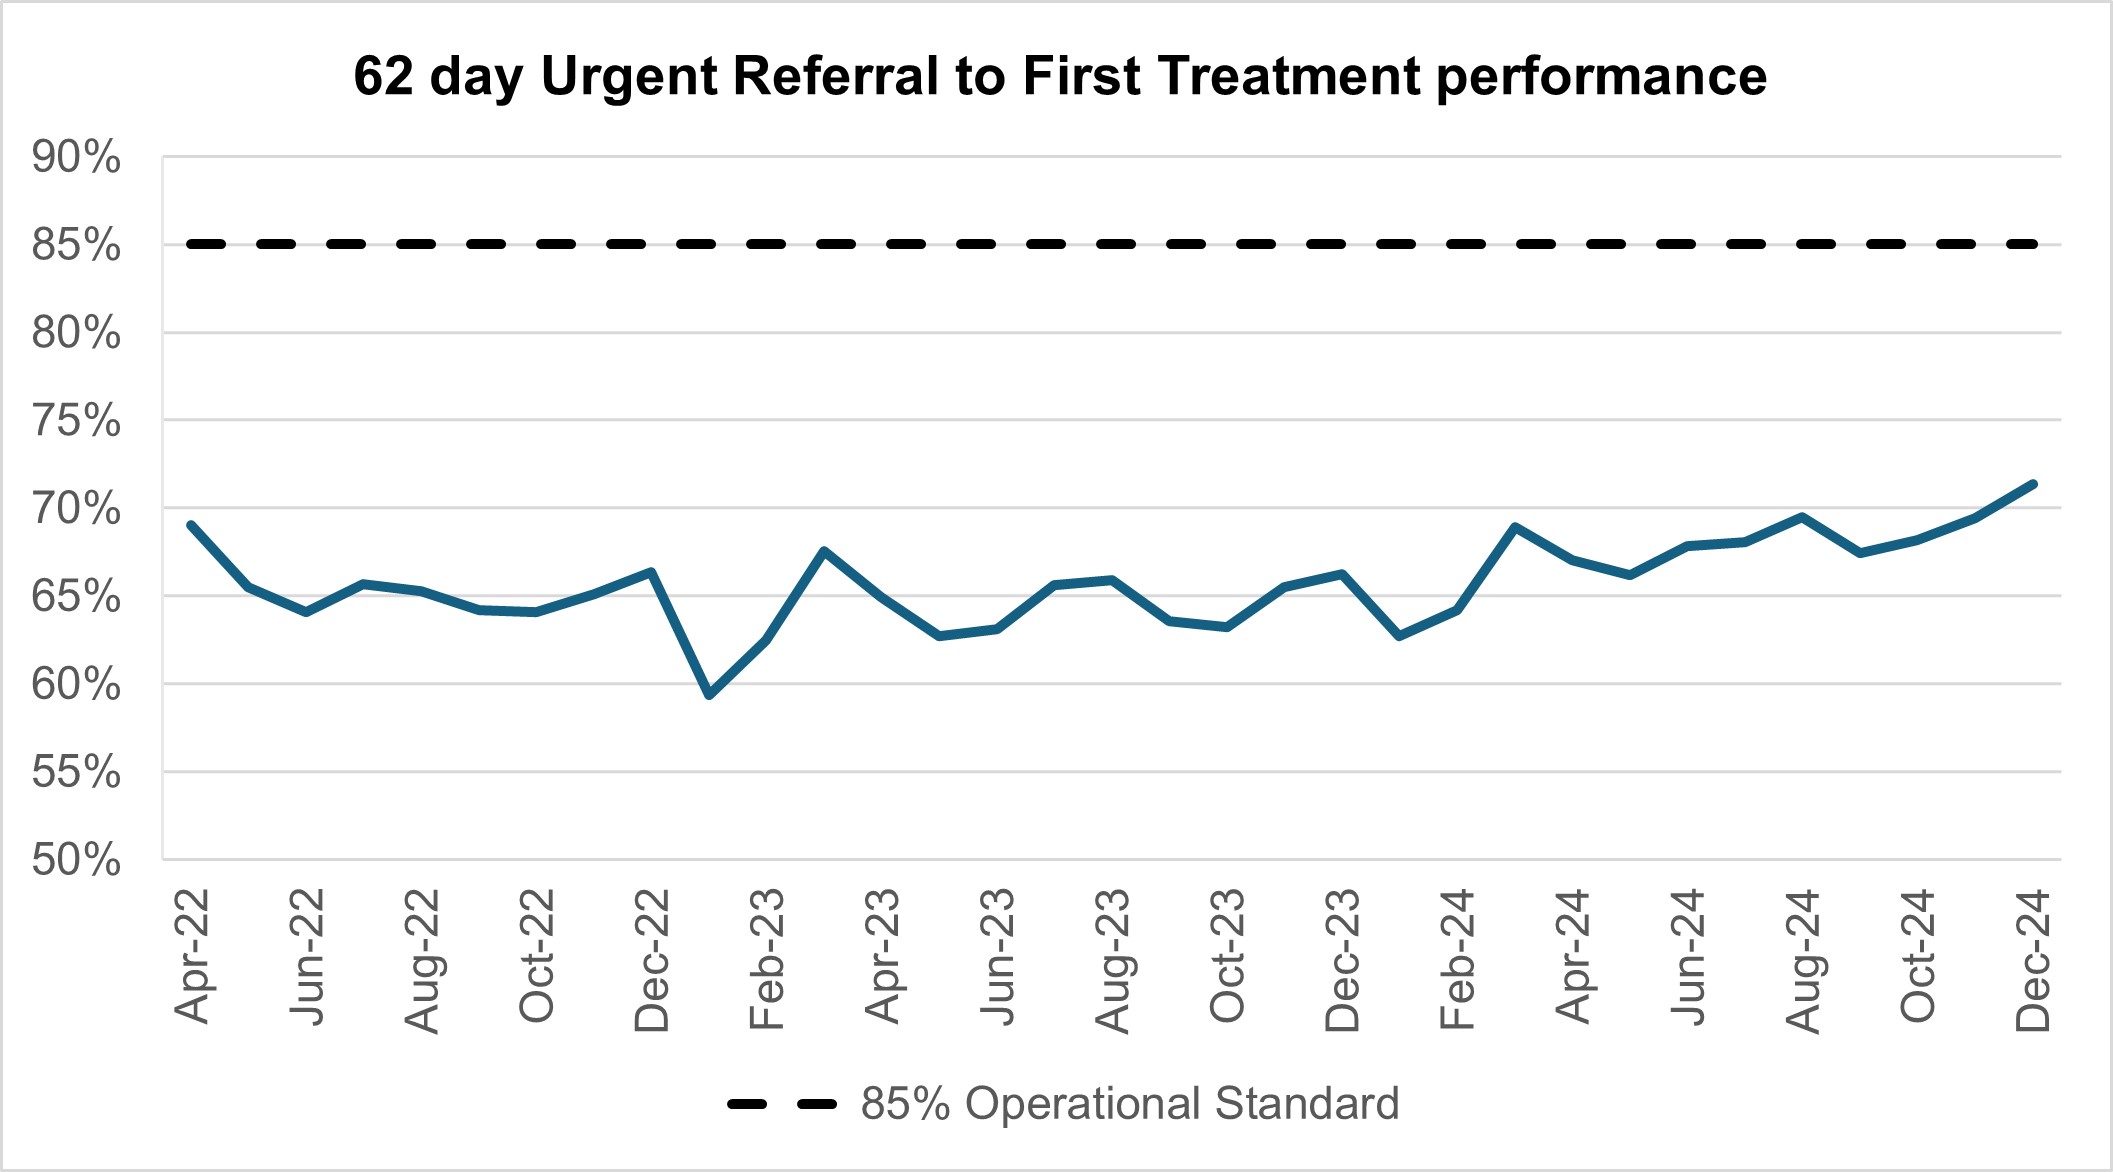
- Performance against the 62 day Urgent Referral to First Treatment Standard to begin first definitive treatment of an urgent suspected cancer referral, breast symptomatic referral, urgent screening referral or a consultant upgrade was 71.3% in December. This was 5.1% higher than at the same point last year, and 1.9% higher than November 2024, but still below where we want to see it.
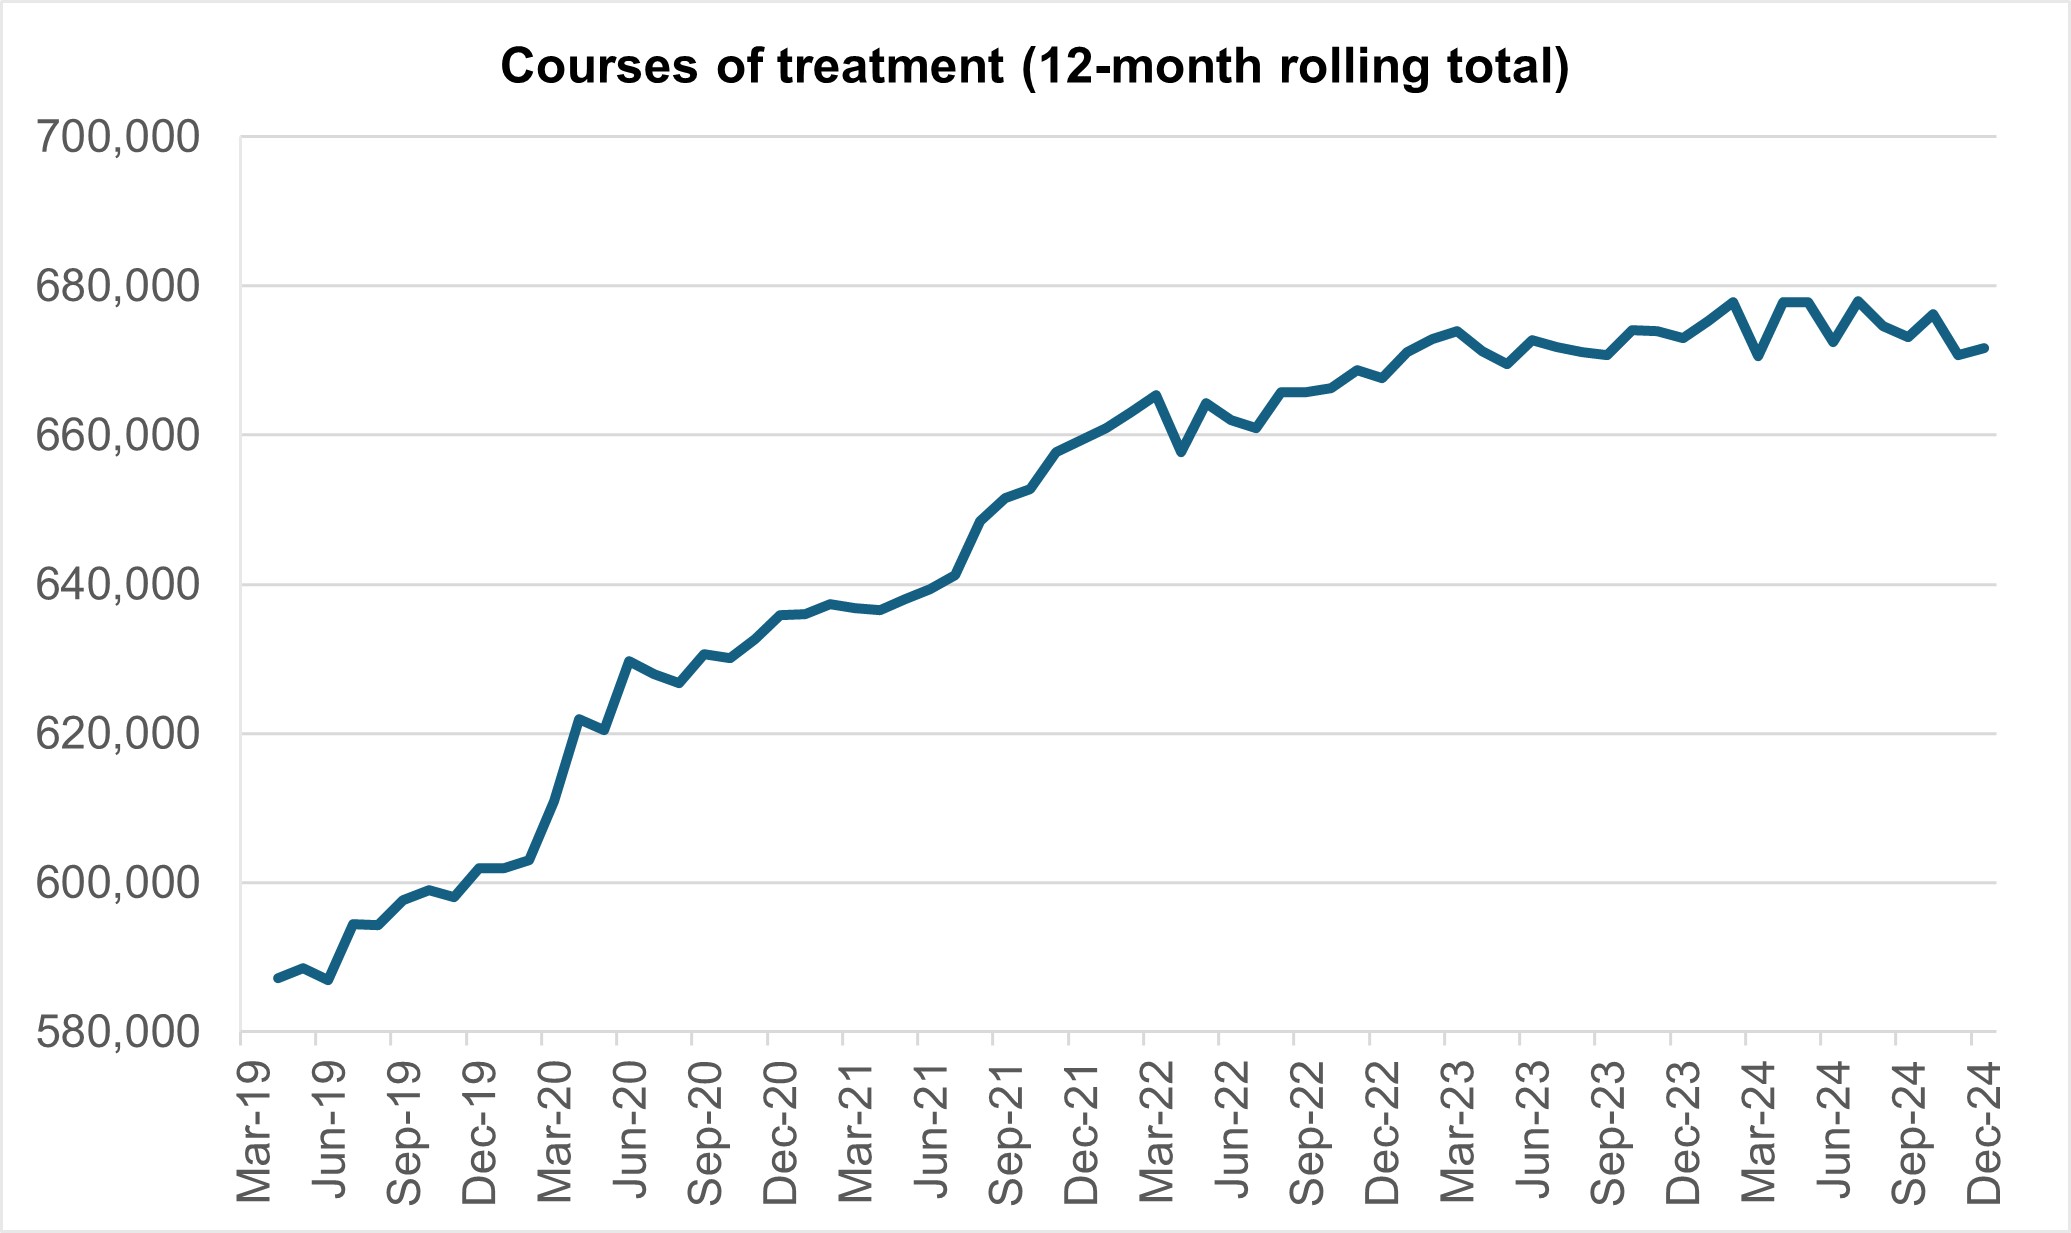
- The NHS delivered 10% more courses of treatment for mental health Talking Therapies in December than before the pandemic. The 12-month rolling total to December 2024 is 671,644, compared to 670,775 in November 2024 and 672,997 in December 2023.
Urgent and emergency care
Ongoing demand for emergency care placed pressure on urgent and emergency services in January.
There was a total of 2,218,130 attendances at A&E departments across England in January. The average daily attendances decreased to 71,553 this is 5.4% lower than December’s daily average and 0.6% lower than January 2023.
73.0% of patients were admitted, transferred or discharged within four hours, which is below the NHS constitutional standard of 95%. This is an improvement from 71.1% in December, and an improvement from 70.4% in January 2024.
The provisional figures published for January indicate that 12.7% of patients attending a type 1 A&E department spent 12 hours from arrival in A&E compared with 12.1% last month.
Percentage of patients seen within 4 hours
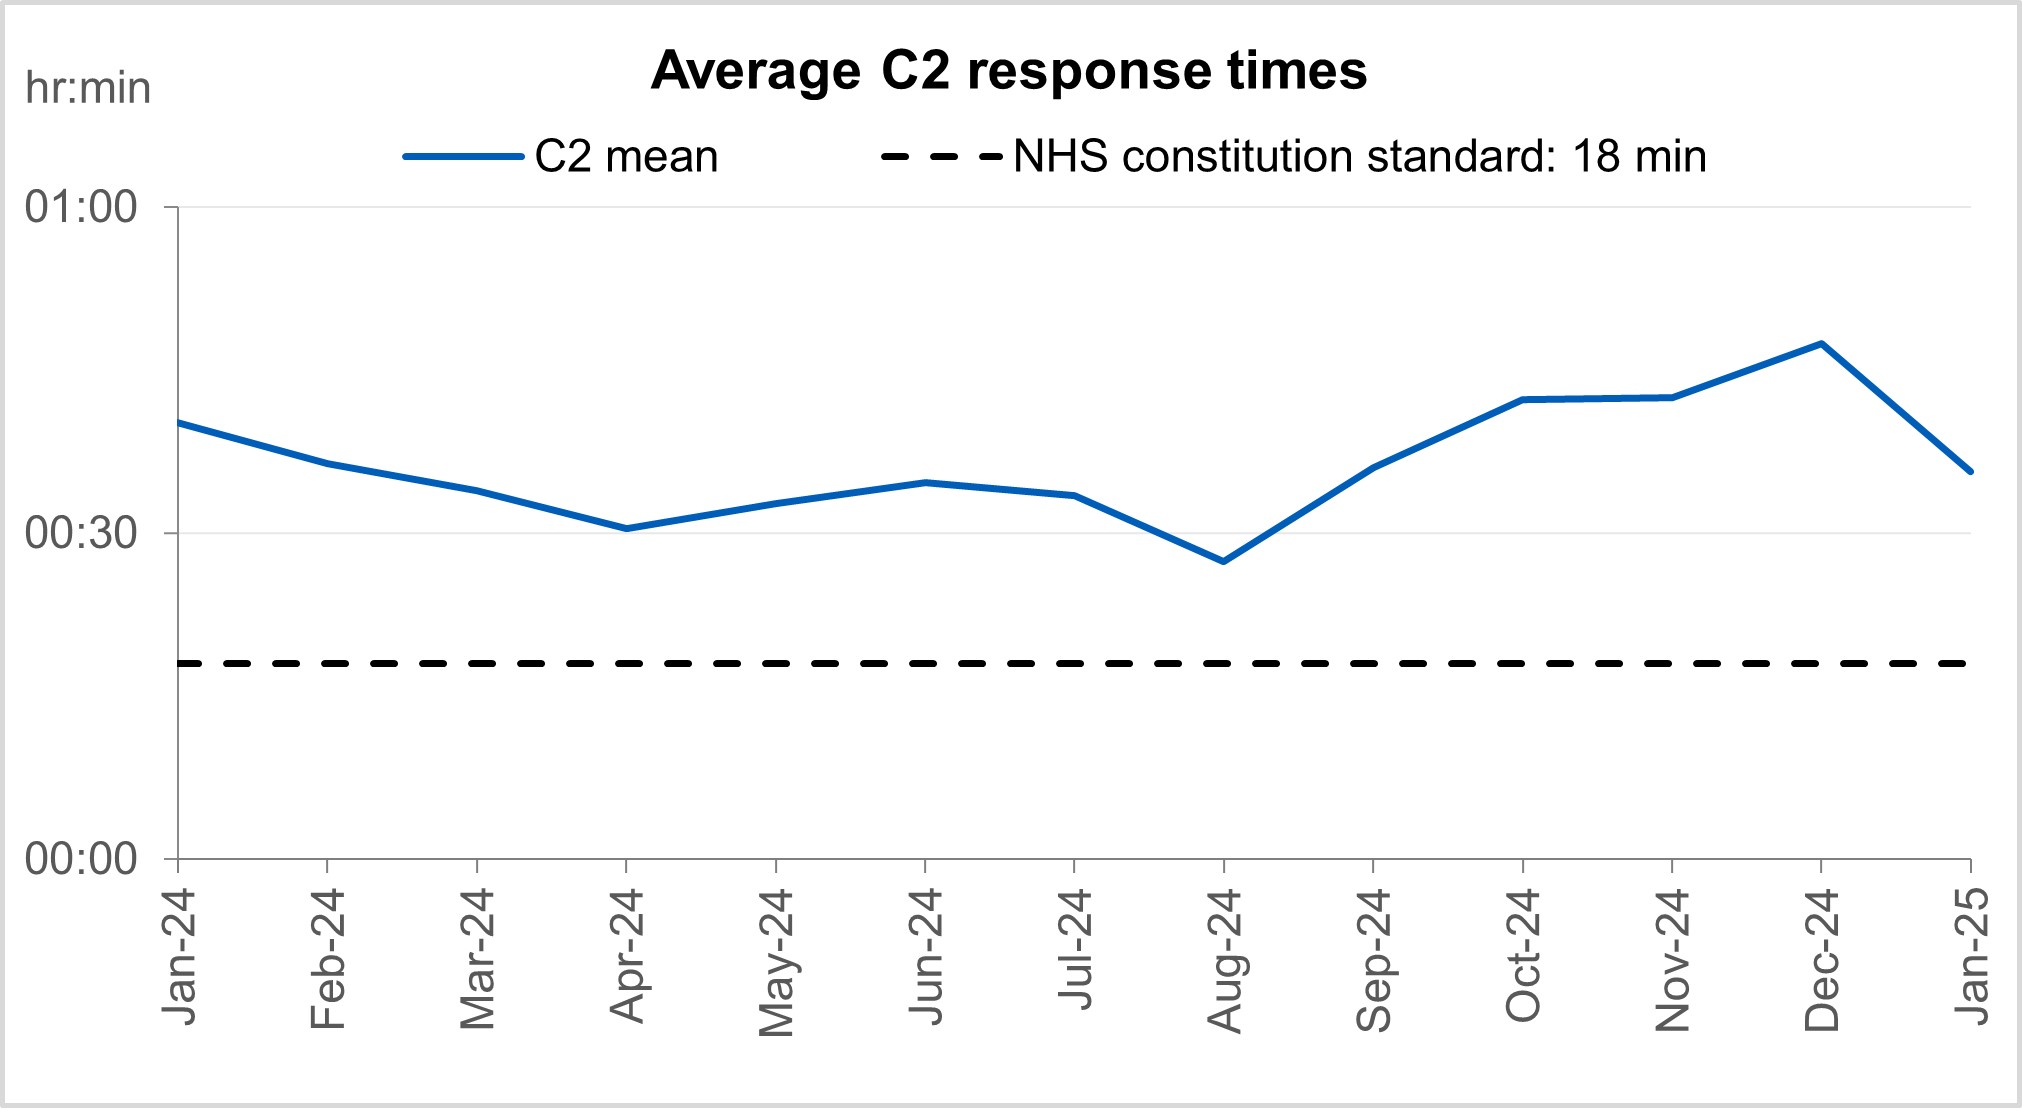
Average C2 response times
Ambulance services answered 816,010 calls to 999, or 26,323 per day, a decrease of 13% compared to December 2024 and 2% less than January 2024. There were 380,348 incidents where a patient was conveyed to A&E or 12,269 per day, 2% less than in December 2024 and a 0.1% less than January 2024.
The average ambulance response time for category 2 calls was 35 minutes and 40 seconds. This has decreased from 47 minutes and 26 seconds in December 2024 and 40 minutes and 06 seconds in January 2024. This is above the 30 minute target for the year and the NHS constitutional standard of 18 minutes.
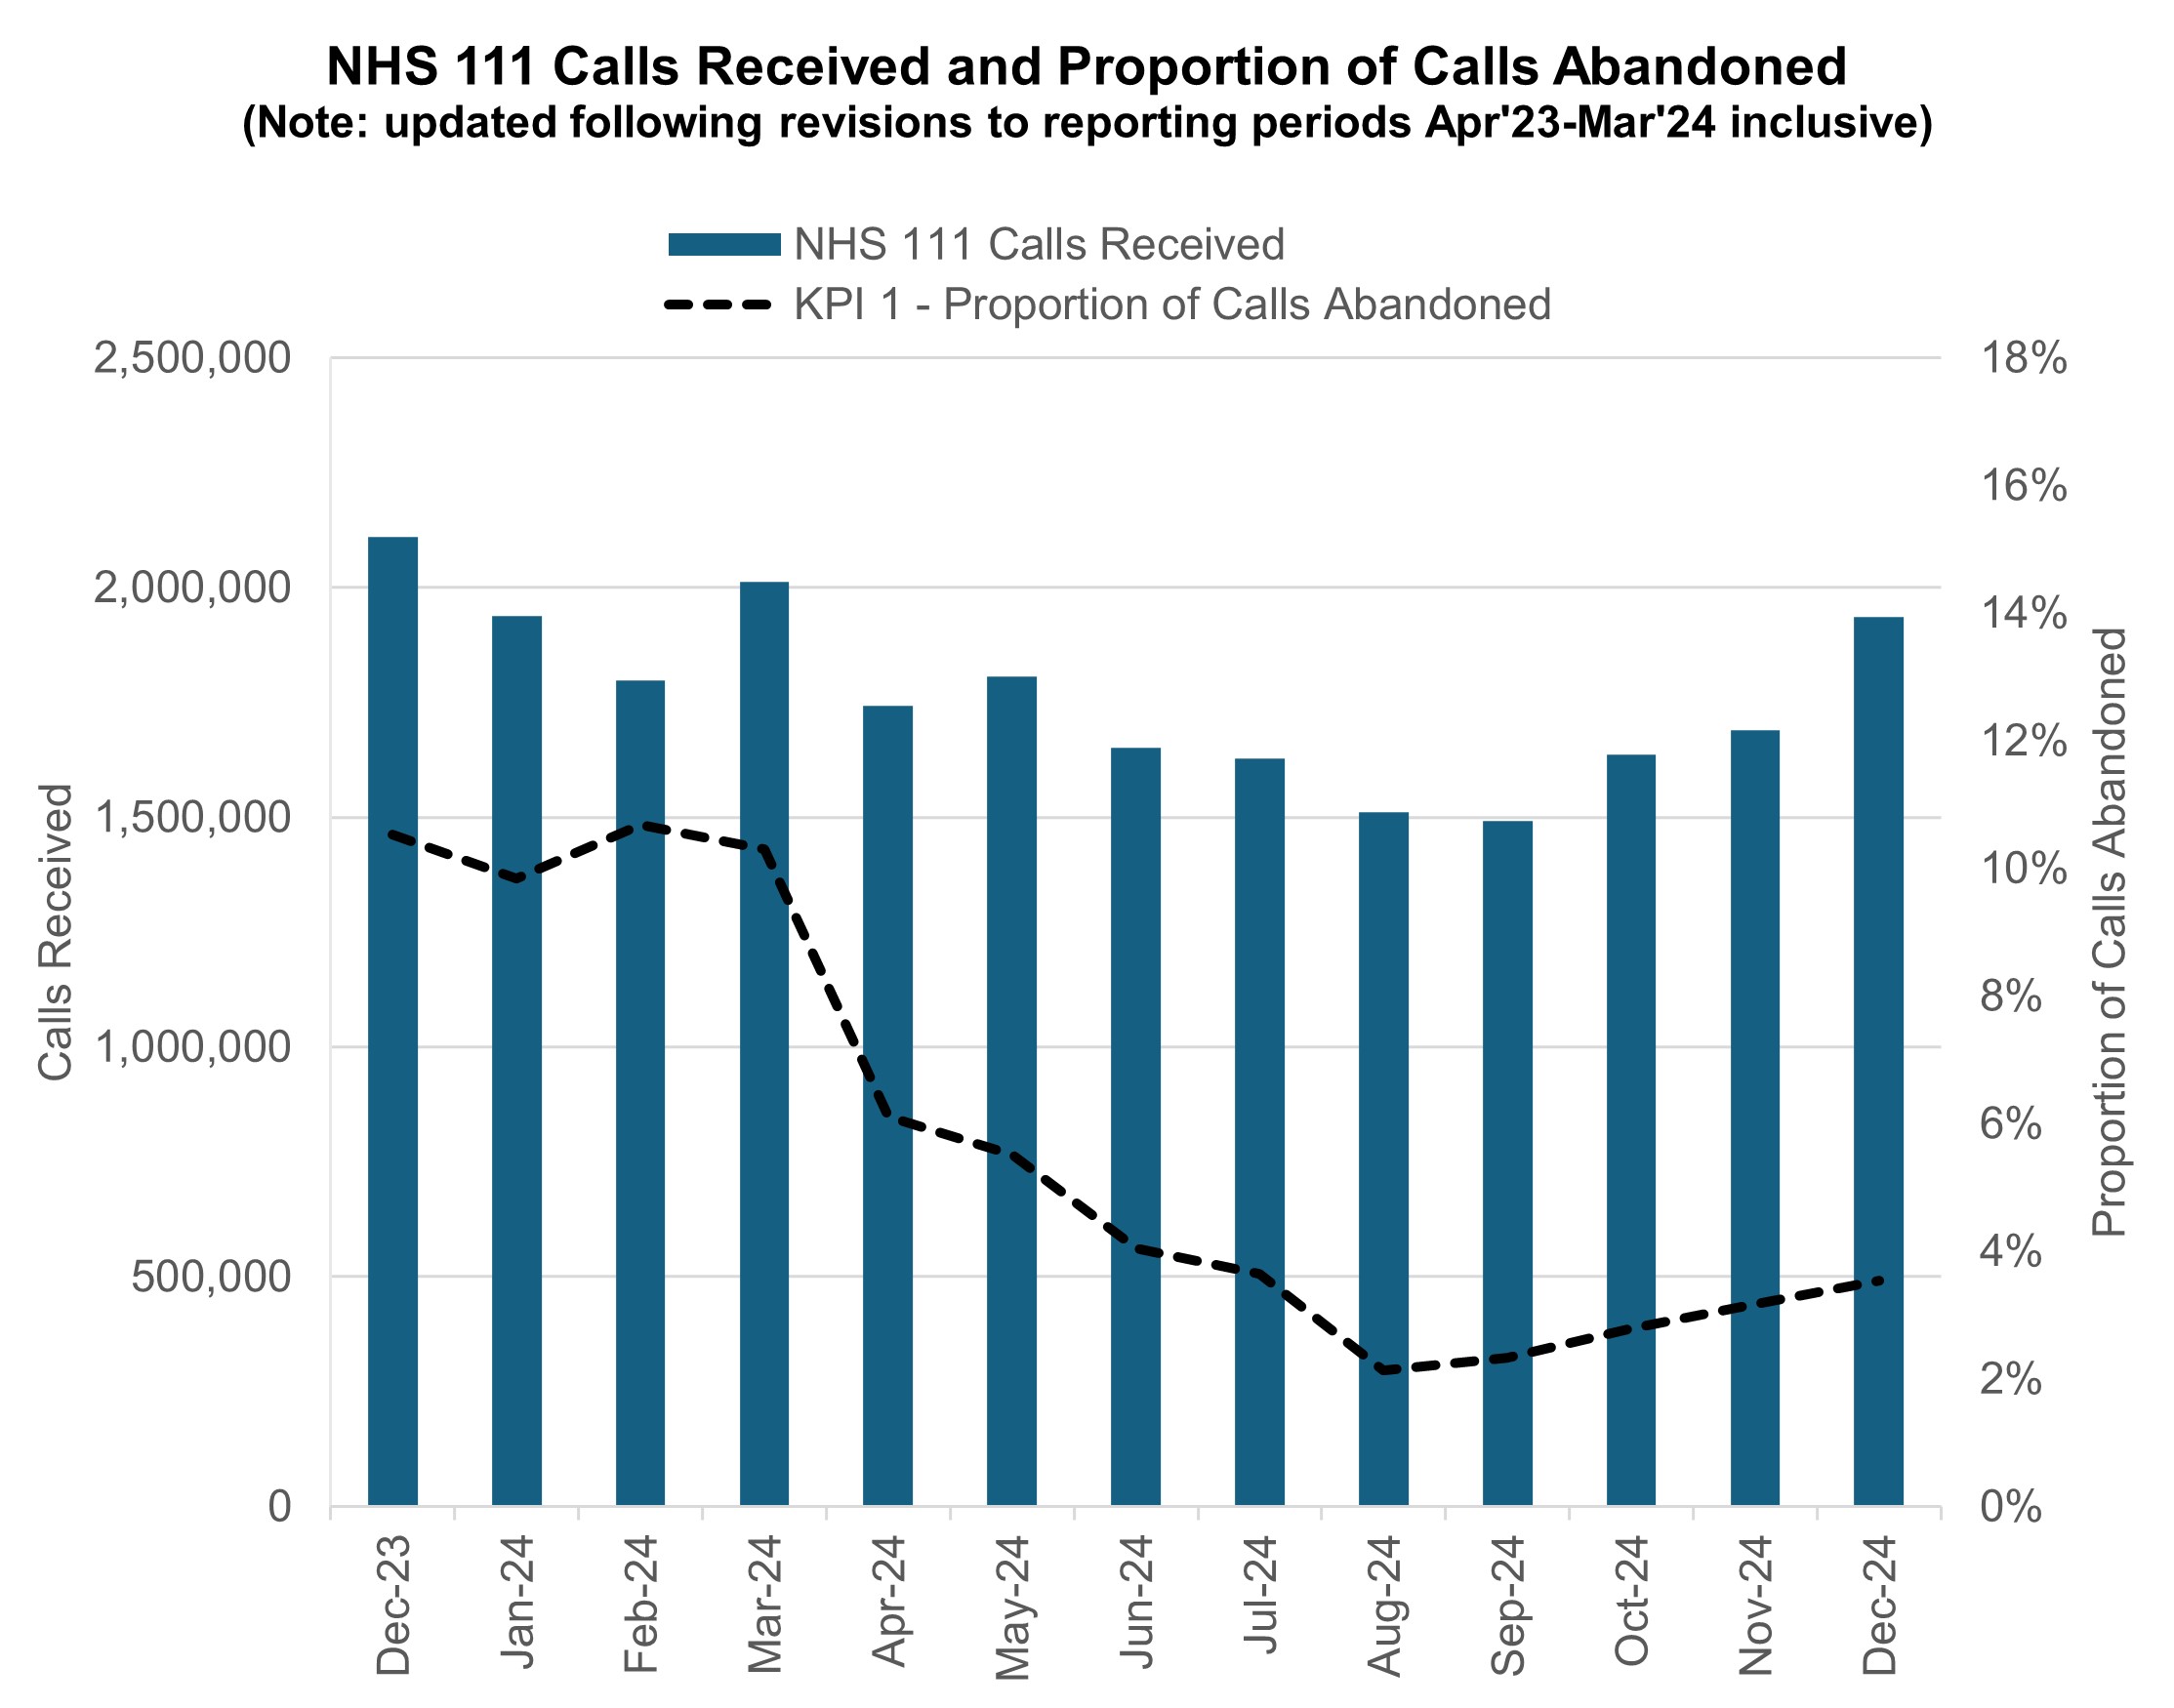
NHS 111 received 1.94 million calls (c. 62.4 thousand per day) in December 2024. Demand was 8.2% down year on year and 11.0% above volumes received in November 2024.
The proportion of calls abandoned increased 0.3% percentage points from the previous month (now at 3.5%) and the average speed to answer increased by 14 seconds to 70 seconds.
NHS 111 calls received and proportion of calls abandoned
Elective recovery
Elective care covers a broad range of planned, non-emergency services – from tests and scans to outpatient appointments, surgery and cancer treatment.
As of the end of December, there were 7.46 million waits for treatment which equates to an estimated 6.26 million people waiting for care. Of the 7.46m pathways on the waiting list in December 24, 1.2 million had a decision to be admitted for treatment.
While NHS staff have worked extremely hard in the aftermath of the pandemic to tackle the elective backlog – reducing long waits and treating the most clinically urgent cases – the NHS is a long way from meeting the required constitutional standard. The Elective Reform Plan was launched in January 2025, which sets out our intention to return to delivery of the constitutional standard: 92% of patients on the waiting list should have been waiting no longer than 18 weeks from referral to treatment.
To meet the 18-week standard and reform elective care by March 2029, we are focusing on empowering patients by giving them more choice and control, reforming delivery by working more productively, delivering care in the right place and aligning funding, performance oversight and delivery standards.
The ambition for 18 weeks performance is to reach the constitutional standard of 92% by March 2029 and 65% by March 2026, the current position is 58.9%.
There were 200,375 waits of more than 52 weeks for treatment at the end of December, compared to 338,070 at the end of December 23 (down 40.7%) and 221,889 at the end of November 24 (down 9.7%). Additional management data* suggests there were 211,469 waits of more than 52 weeks as of the end of January.
* Management information for the latest month is taken from the Waiting List Minimum Dataset (WLMDS). Figures include data up to week ending 26 Jan 25. WLMDS data is subject to less validation than the published monthly figures. All acute trusts submitted data for week ending 26 Jan 25.
Referral to treatment 52 week waits
As we shift the focus to the 18 week standard, we will continue to ensure that the longest waits are tackled and the number of patients waiting unacceptably long times continues to reduce. In the 2025/26 priorities and operational planning guidance we have made a commitment to reduce the proportion of people waiting over 52 weeks for treatment to less than 1% of the total waiting list by March 2026.
Waits of more than 65 weeks for treatment was 15,568 at the end of December, reduced compared to 98,567 at the end of December 2023 (down 84.2%) and 16,904 in November 2024 (down 7.9%). Additional management data suggests there were 19,065 waits of more than 65 weeks for treatment as of the end of January.
There has been a reduction in the longest waits for care, 2,059 patients were waiting more than 78 weeks for treatment at the end of December, compared to 13,191 at the end of December 23 (down 84.4%) and 2,051 in November 2024 (up 0.4%). Additional management data suggests there were 1,924 waits of more than 78 weeks for treatment as of the end of January.
At the end of December, on the diagnostic waiting list there were 1.56 million waits, of which 360,000 had waited 6 weeks or more. The percentage of 6 week waits was 22.8%, down from 26.8% in December 2023. Progress is being made towards the interim recovery target of not more than 5% of the waiting list over 6 weeks and an increased percentage of diagnostic activity is supplied by Community Diagnostic Centres.
Diagnostic 6 week waits
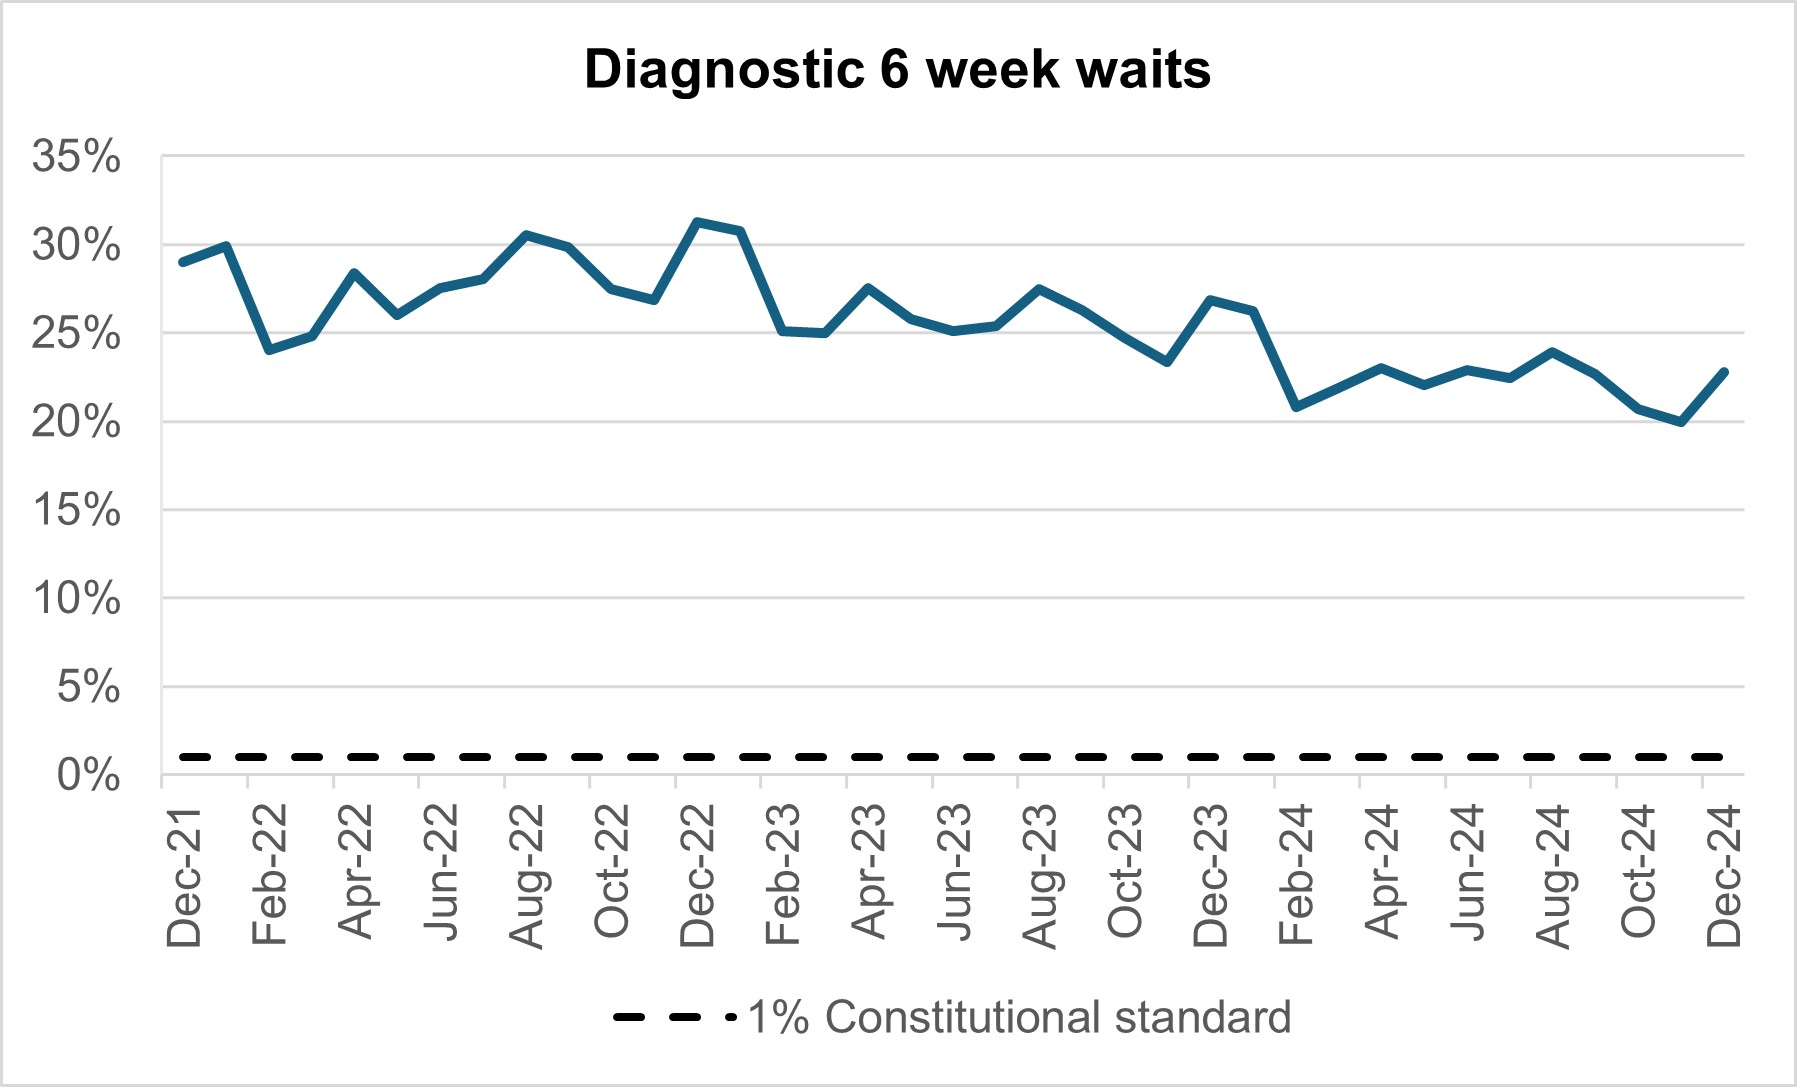
By providing a wider range of and capacity for tests and more consulting rooms, CDCs can improve elective pathways for both urgent cancer pathways and routine diagnostic pathways. There are 1.63 million waits for the 15 major diagnostic tests and demand is rising. With 170 community diagnostic centres (CDCs) due to be up and running by the end of March 2025, these centres can take on more of the growing diagnostic demand within elective care.
Cancer
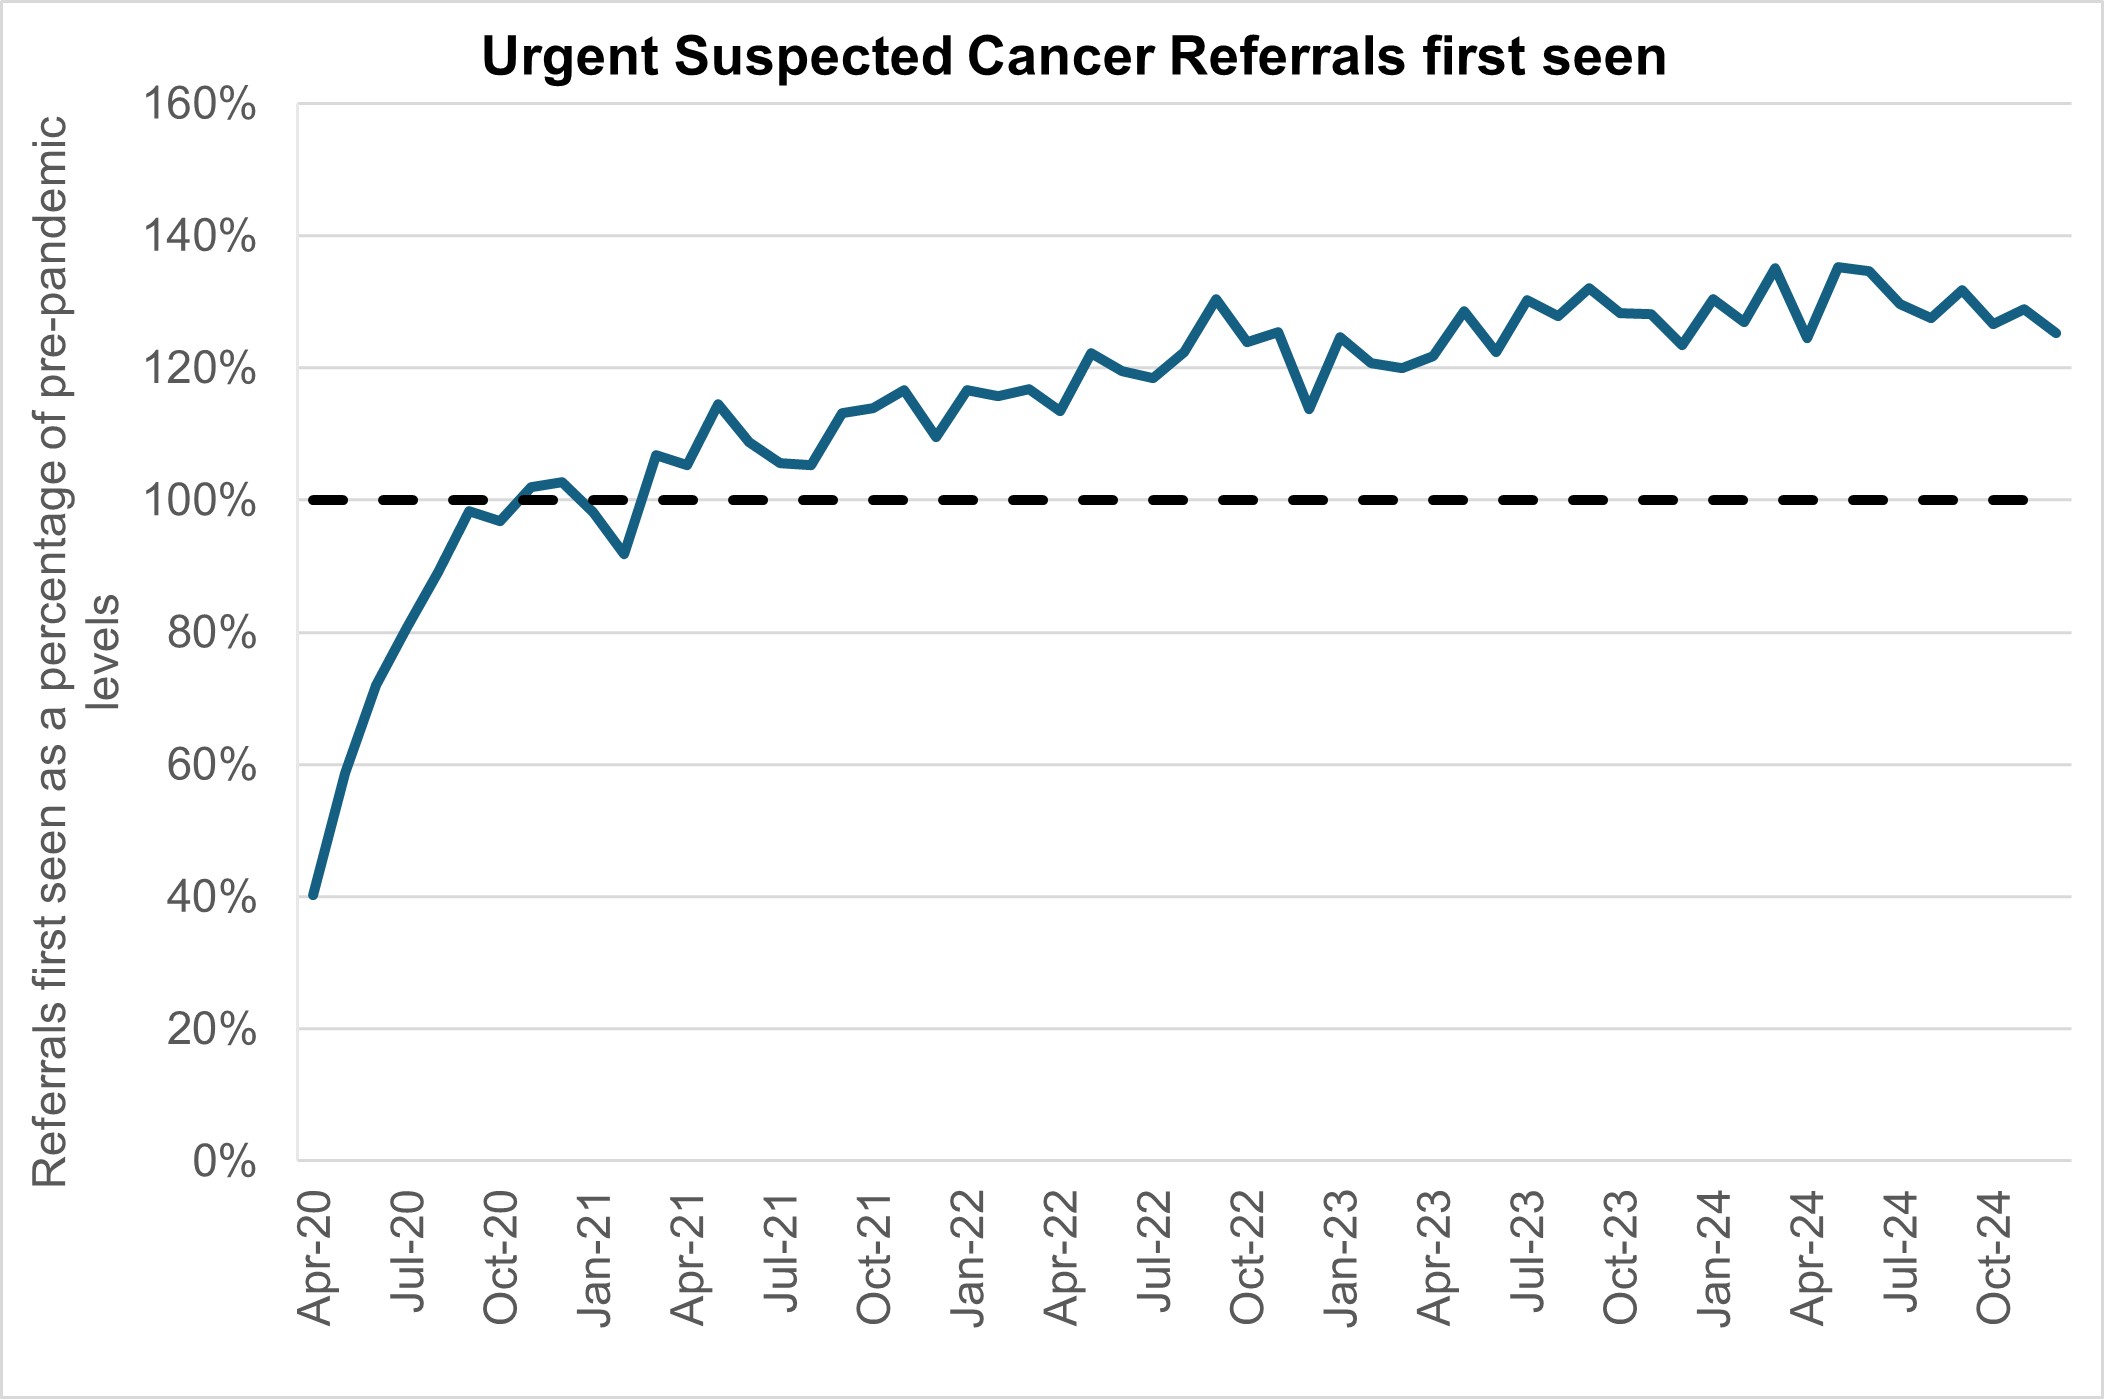
Levels of Urgent Suspected Cancer referrals have remained at high levels, with 11,758 referrals per working day in December 2024. This is 25% more referrals than the NHS was seeing before the pandemic – the equivalent of ~2,400 more referrals per working day.
Treatment activity was also at a record high level with over 1,400 patients starting cancer treatment per working day, 15% above pre-pandemic levels.
Urgent suspected cancer referrals first seen
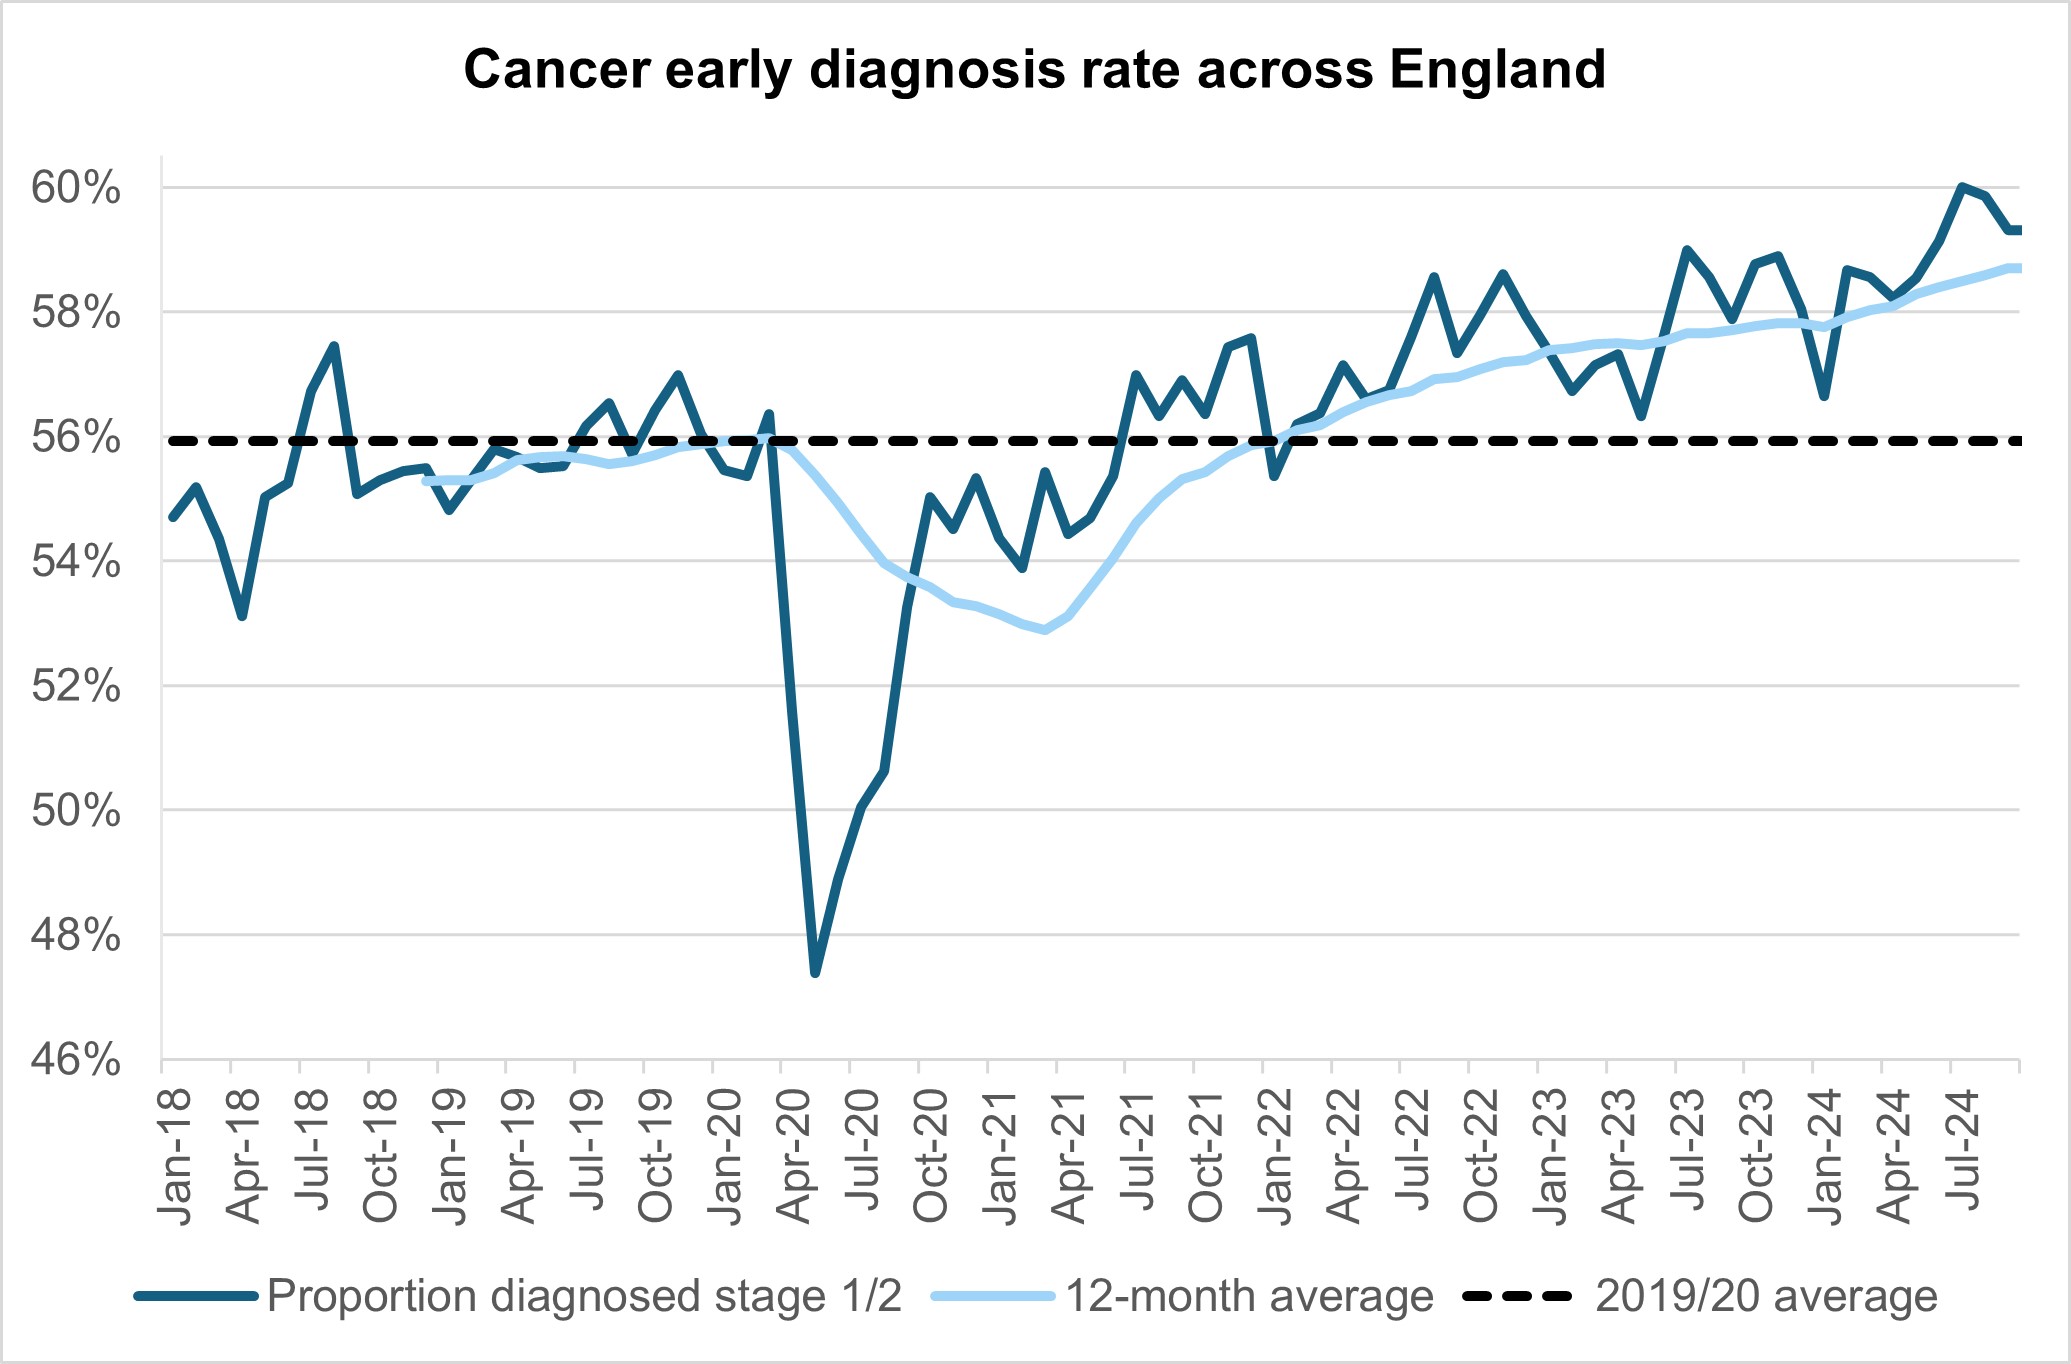
The increase in referrals has also contributed to increases in early diagnosis, which are now about 2 percentage points higher than before the pandemic, cancer survival also continues to improve.
Cancer early diagnosis rate across England
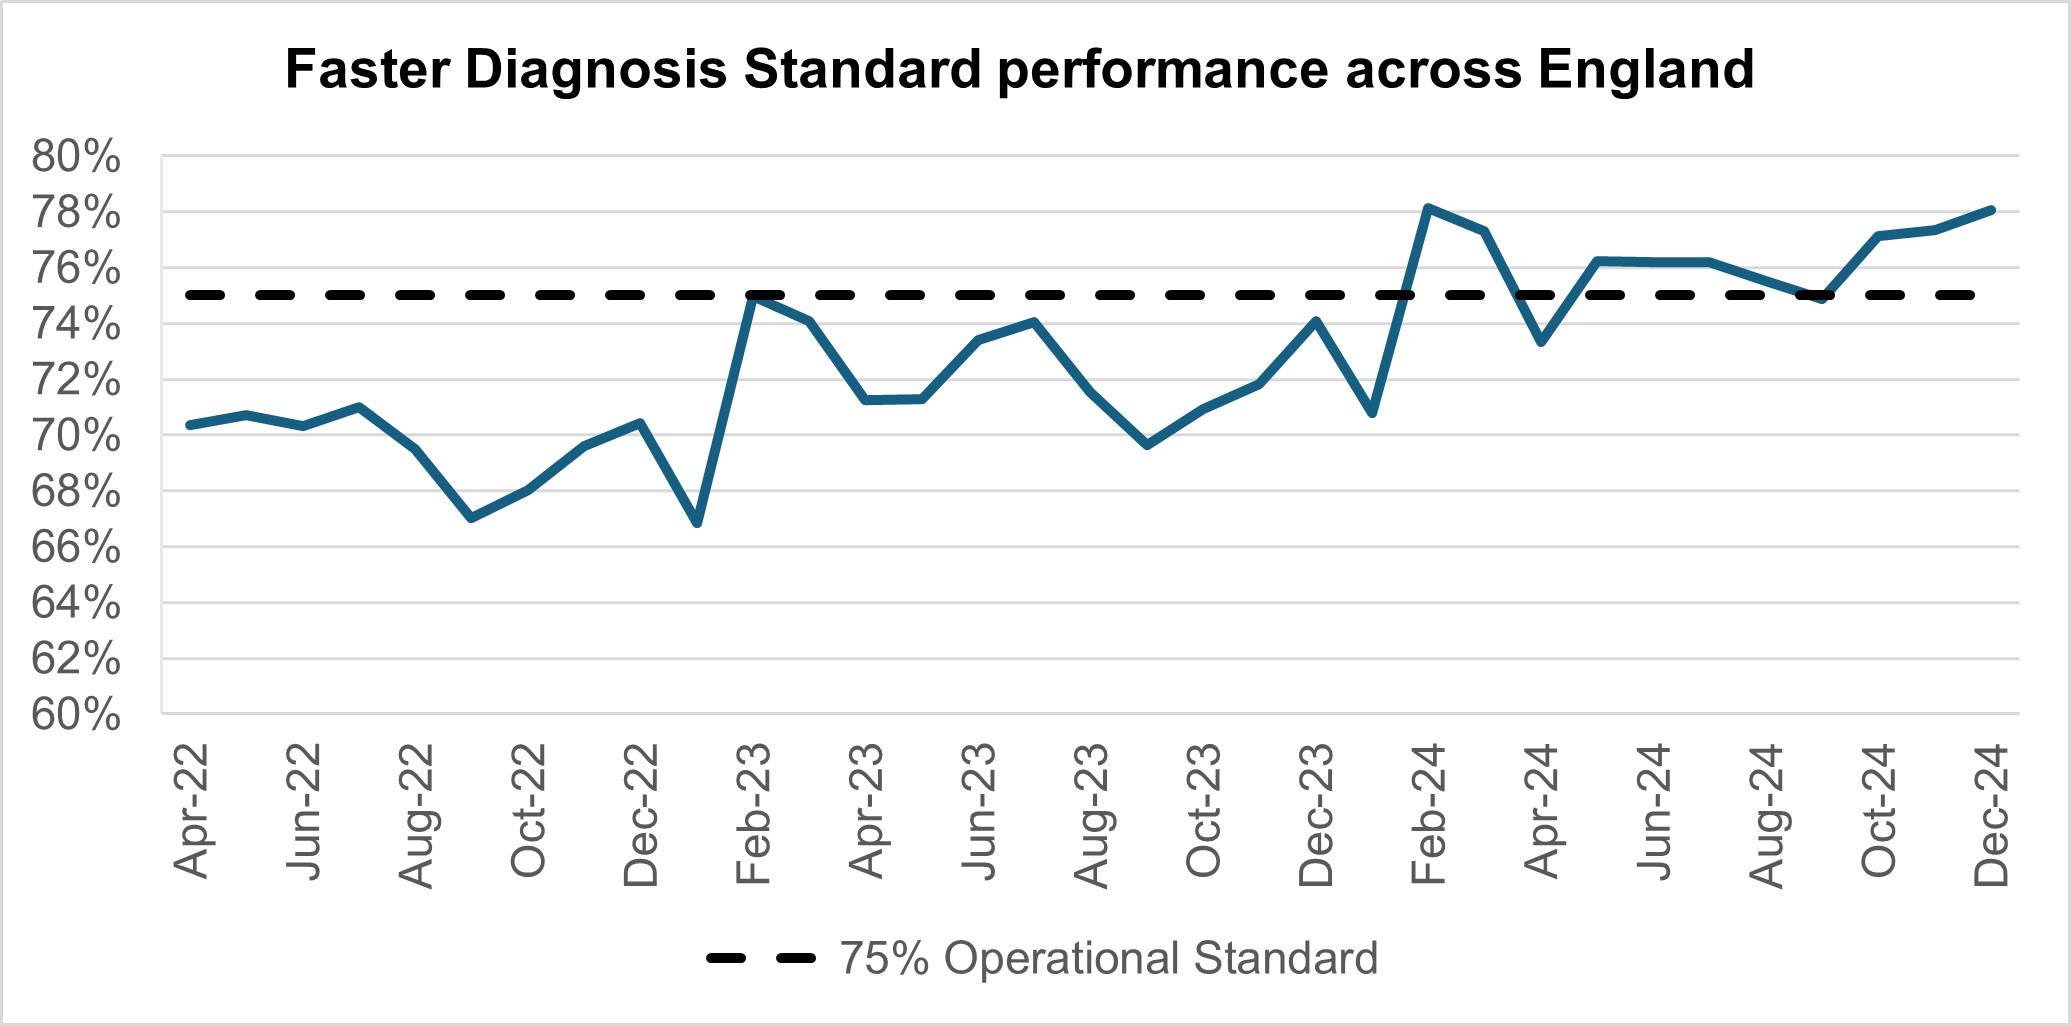
The NHS is working hard to keep up with this increase in demand. It has been accelerating the installation of new diagnostic capacity, much of it in Community Diagnostic Centres. Performance against the 28 day faster diagnosis standard to reduce the time between referral and diagnosis of cancer increased to 78.1% in December. Which is above the NHS constitutional standard of 75% and represents a 4.0% improvement compared to the same point last year and 0.7% improvement on November 2024.
Faster diagnosis standard performance across England
Performance against the 62 day Urgent Referral to First Treatment Standard to begin first definitive treatment of an urgent suspected cancer referral, breast symptomatic referral, urgent screening referral or a consultant upgrade was 71.3% in December. This was 5.1% higher than at the same point last year, and 1.9% higher than November 2024, but still below where we want to see it. The NHS has set the ambition to improve this to 70% by March 2025, as a first step in recovering performance to the NHS constitutional standard of 85%.
62 day urgent referral to first treatment standard
Mental health
Courses of treatment within NHS Talking Therapies continue to increase. The 12-month rolling total to December 2024 is 671,644, compared to 670,775 in November 2024 and 672,997 in December 2023. This is 10% more courses of treatment than the NHS was seeing before the pandemic – the equivalent of 5,064 more patients being seen each month.
Courses of treatment (12-month rolling total)
Despite the increase in numbers seen, waiting times for NHS Talking Therapies remain good with 91.2% being seen within 6 weeks (compared to 91.7% in November 2024 and 91.6% in December 2023) and 98.4% being seen within 18 weeks (compared to 98.8% in November 2024 and 98.6% in December 2023).
Outcomes for NHS Talking Therapies patients have dropped, with 66.9% achieving reliable improvement (an improvement in symptoms), compared to 67.4% in November 2024 and 65.8% in December 2023. 46.8% achieved reliable recovery (an improvement in symptoms and moving from being a clinical case to not being a clinical case), compared to 47.6% in November 2024 and 45.4% in December 2023. The slight decline in treatment courses, reliable improvement, and reliable recovery may be attributed to the festive season and the limited 20 working days.
CYP access LTP trajectories (0-17 data against 0-17 trajectory)
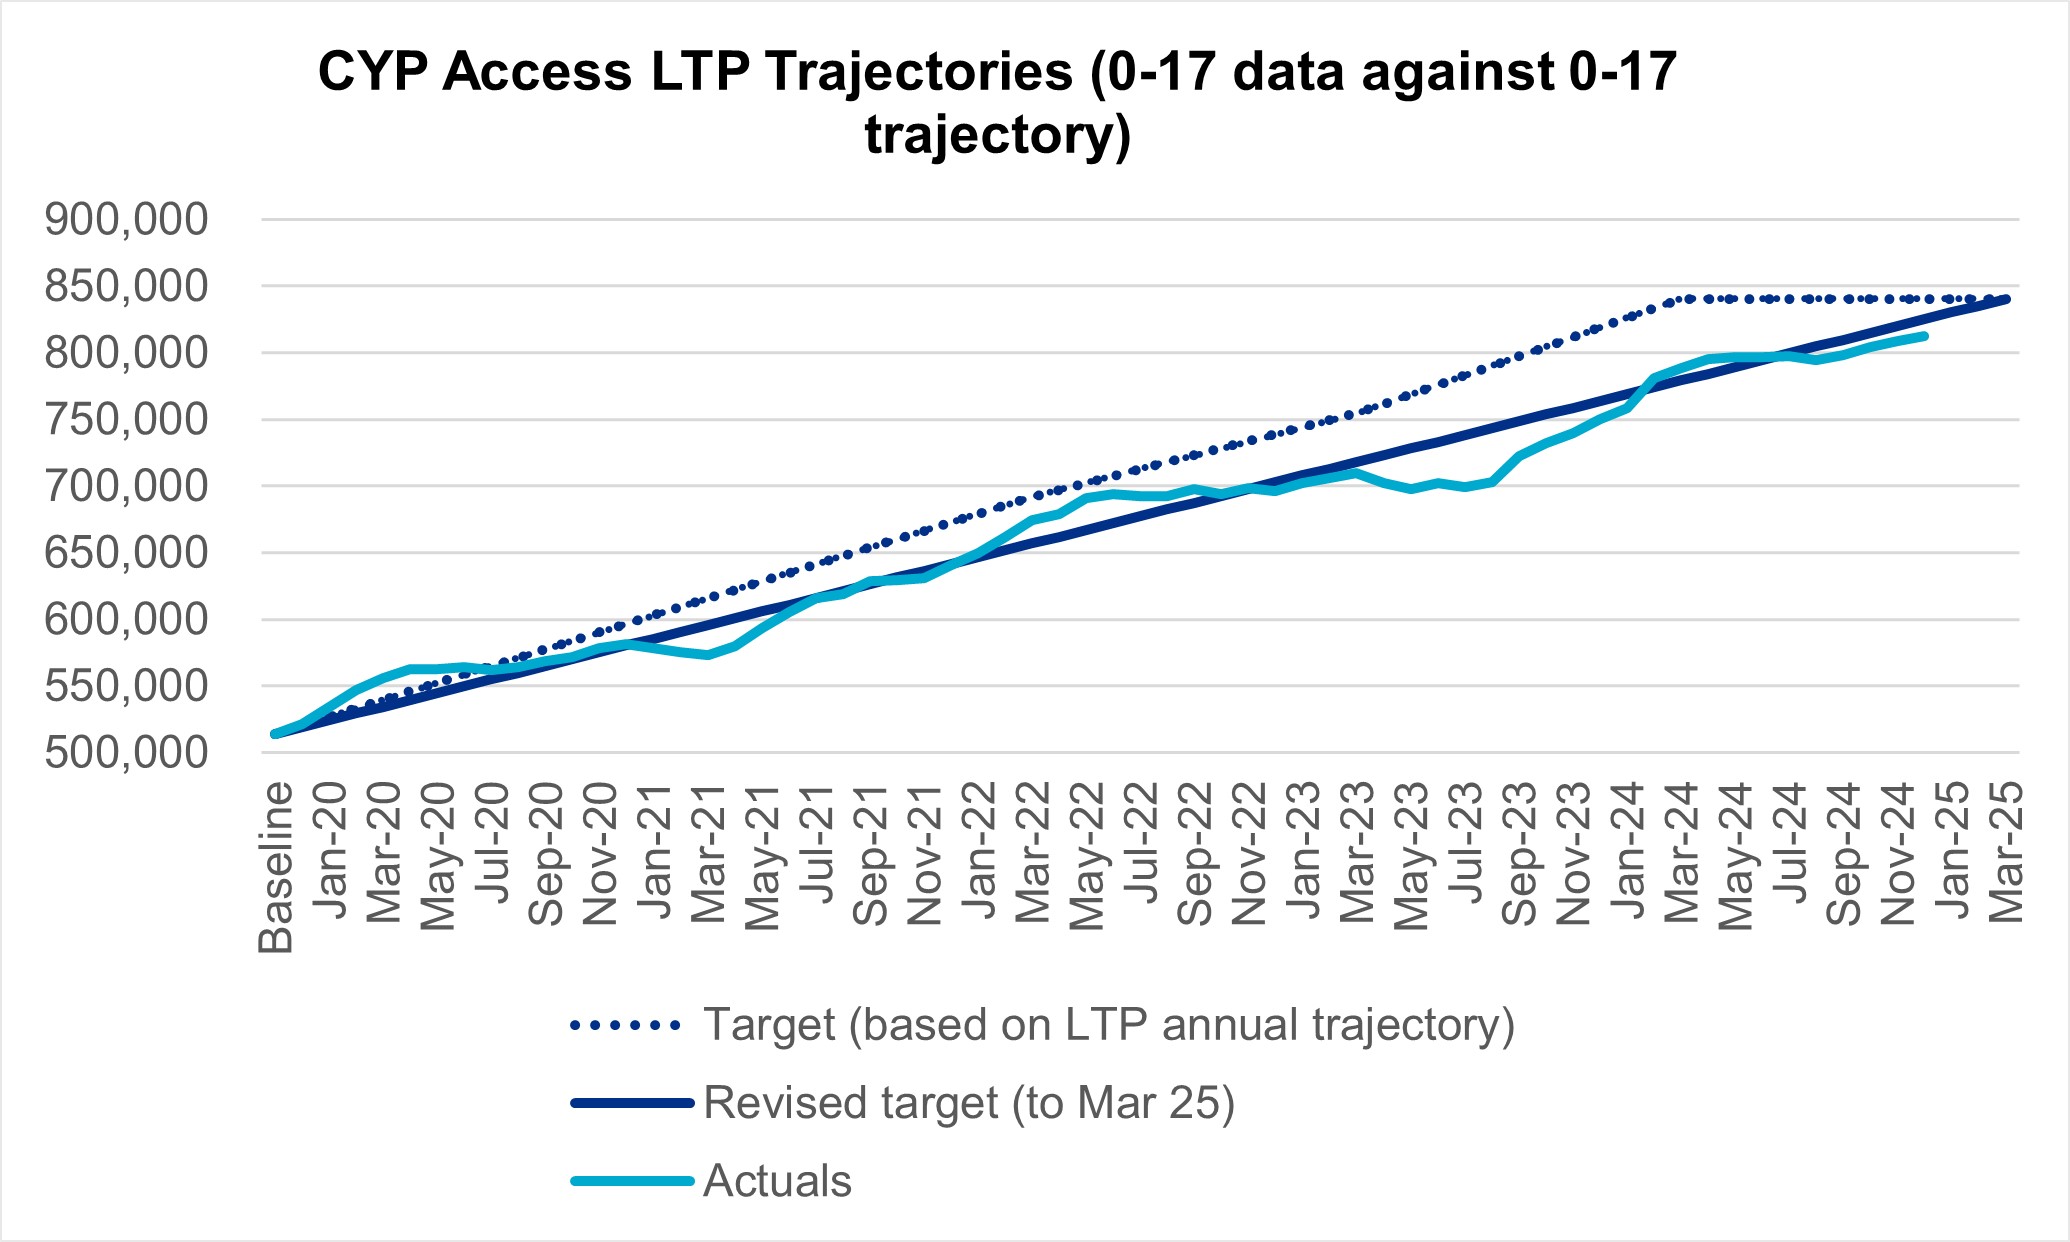
The graph above uses first published performance data for each month.
In the rolling 12 months from January 2024 to December 2024, the number of 0-17s receiving at least one contact increased by 3,569 to 812,185 – up from 808,616 in November 2024, and 749,833 in December 2023. Planning returns suggested the Long Term Plan (LTP) target will be met nationally in 2024/25 however this month’s data shows we are still 28,069 contacts away from achieving this. An average of 9,356 contacts are required over the next 3 months to meet the LTP commitment. There also remains some regional variation which we continue to raise with regional leadership and colleagues working on Children and Young People’s Mental Health (CYPMH), to understand the causes and support required by systems. The focus is on improving data quality and reducing variation in reported activity, including in Mental Health Support Teams in schools and colleges.