Executive summary
This briefing draws on official statistics published on the NHS England website.
1. NHS staff experienced the busiest year on record for A&E and ambulance services last year. There was a total of 2,345,934 attendances at A&E departments across England in December, bringing the total number of attendances in 2024 to 27.42 million.
2. 71.1% of patients were admitted, transferred or discharged within 4 hours, which is below the NHS constitutional standard of 95%. This is a deterioration from 72.1% in November, but an improvement from 69.5% in December 2023.
3. Ambulance services answered 935,950 calls to 999, or 30,192 per day, an increase of 5% compared to November 2024 and 4% more than December 2023.
4. The average ambulance response time for category 2 calls was 47 minutes and 26 seconds. This has increased from 42 minutes and 26 seconds in November 2024 and 45 minutes and 57 seconds in December 2023.
5. Waits of more than 65 weeks for treatment was 16,904 at the end of November, reduced compared to 94,681 at the end of November 2023 (down 82.1%) and 20,930 in October 2024 (down 19.2%).
6. There has been a reduction in the longest waits for care, 2,051 patients were waiting more than 78 weeks for treatment at the end of November, compared to 11,215 at the end of November 2023 (down 81.7%) and 2,446 in October 2024 (down 16.1%).
7. There were 12,145 urgent suspected cancer referrals per working day in November 2024. This is 27% more referrals than the NHS was seeing before the pandemic – the equivalent of 2,500 more referrals per working day – and there were 1,400 patients starting cancer treatment per working day.
8. In November, performance against the 62 day Urgent Referral to First Treatment Standard, was 69.4% which was 3.9% higher than at the same point last year, and 1.2% higher than October 2024, but still well below where we want to see it. The NHS has set the ambition to improve this to 70% by March 2025, as a first step in recovering performance to the NHS constitutional standard of 85%.
Urgent and emergency care
Demand rose for urgent and emergency care services in December, with an increase in winter viruses and infection prevention and control increasing pressure on flow through emergency departments.
There was a total of 2,345,934 attendances at A&E departments across England in December. The average daily attendances decreased to 75,675, this is 1.8% lower than November’s daily average and 7.4% higher than December 2023.
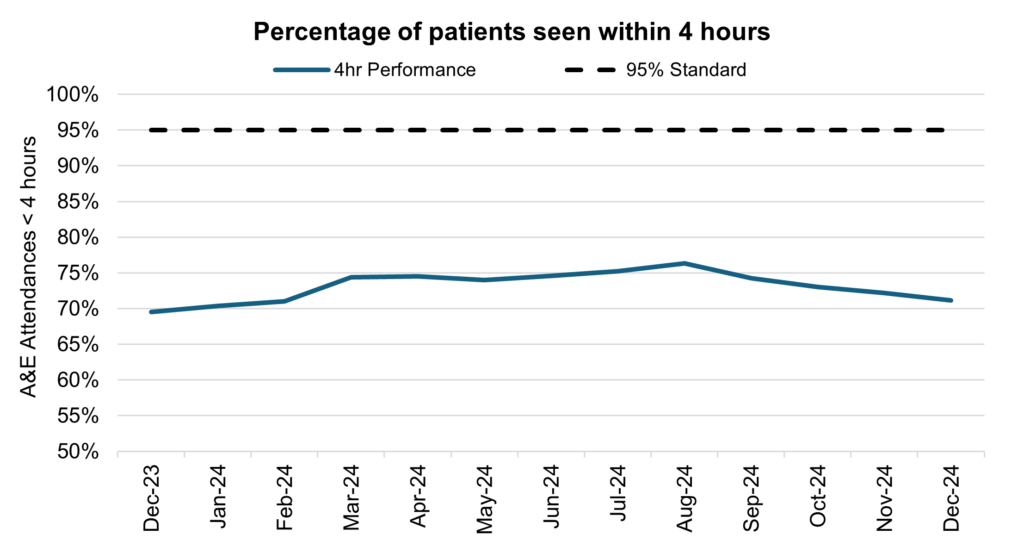
71.1% of patients were admitted, transferred or discharged within 4 hours, which is below the NHS constitutional standard of 95%. This is a deterioration from 72.1% in November, but an improvement from 69.5% in December 2023.
The provisional figures published for December indicate that 12.0% of patients attending a type 1 A&E department spent 12 hours from arrival in A&E compared with 10.8% last month.
Percentage of patients seen within 4 hours
Ambulance services answered 935,950 calls to 999, or 30,192 per day, an increase of 5% compared to November 2024 and 4% more than December 2023. There were 388,473 incidents where a patient was conveyed to A&E or 12,531 per day, 0.5% more than in November 2024 and a 2% increase from December 2023.
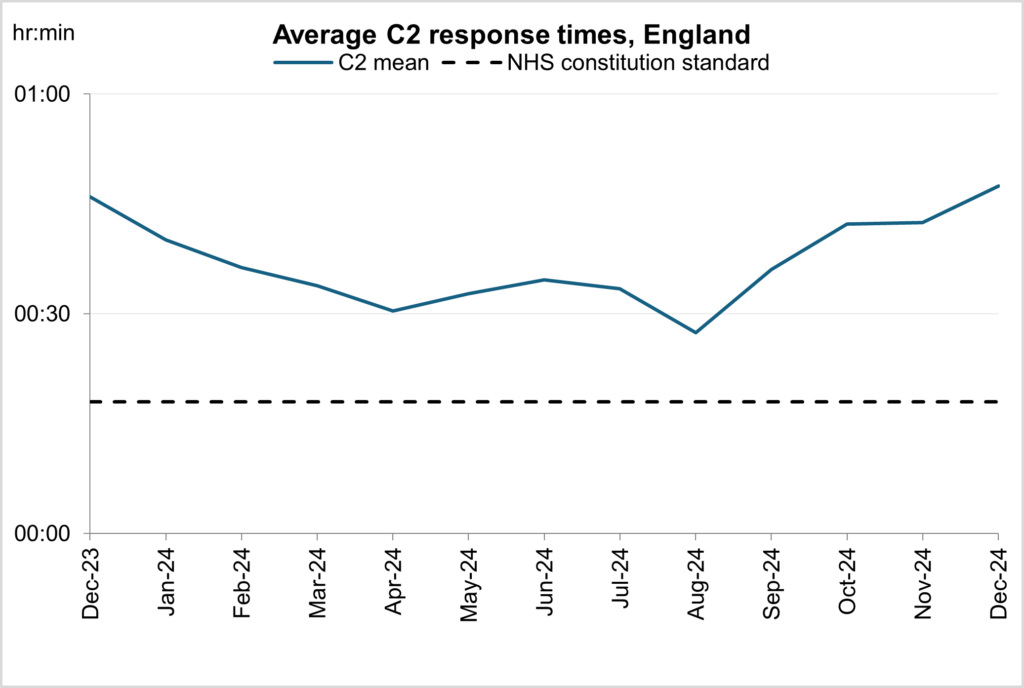
The average ambulance response time for category 2 calls was 47 minutes and 26 seconds. This has increased from 42 minutes and 26 seconds in November 2024 and 45 minutes and 57 seconds in December 2023. This is above the 30-minute target for the year and the NHS constitutional standard of 18 minutes.
Average category 2 response times, England
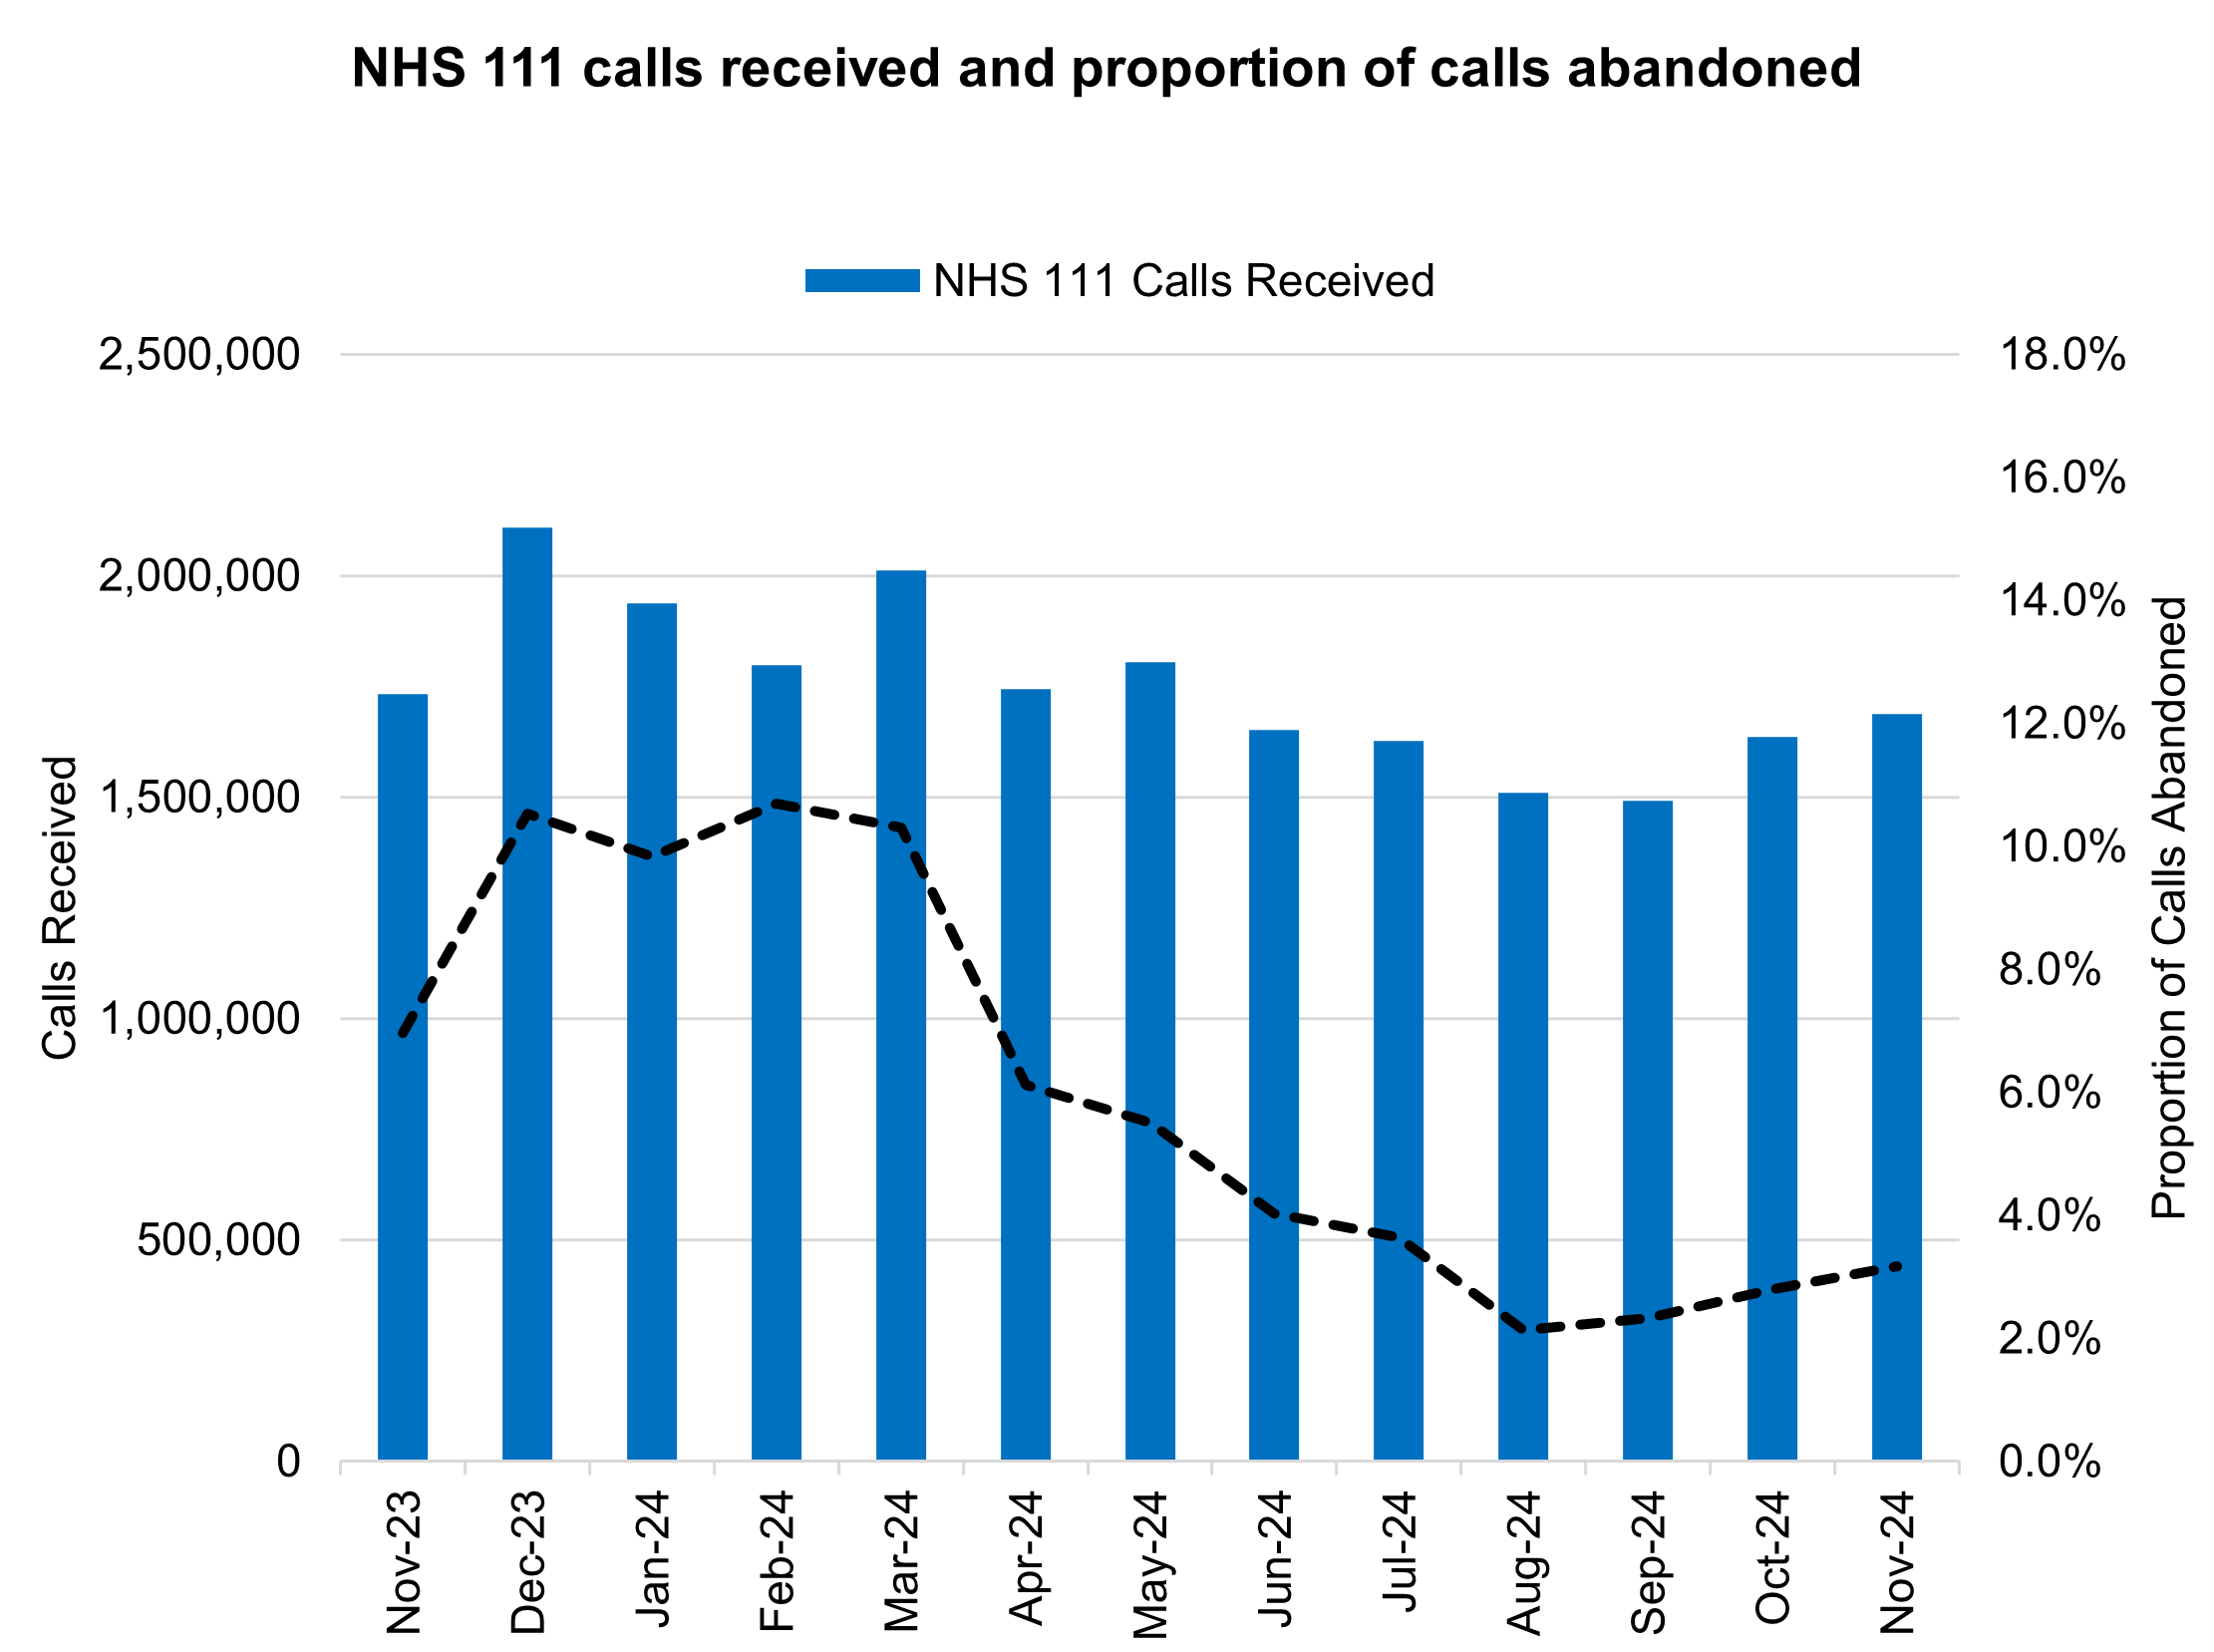
NHS 111 received 1.68 million calls (c. 56.3 thousand per day) in November 2024. Demand was 2.6% down year on year and 3.2% above volumes received in October 2024.
The proportion of calls abandoned increased 0.4% percentage points from the previous month (now at 3.2%) and the average speed to answer increased by 9 seconds to 56 seconds.
NHS 111 calls received and proportion of calls abandoned
Note: updated following revisions to reporting periods April 2023 to March 2024 inclusive.
Elective recovery
As of the end of November, on the total waiting list there were 7.48 million waits for procedures and appointments and an estimated 6.28 million people waiting for care. The NHS constitution standard states that 92% of patients have a right to start consultant-led treatment within a maximum of 18 weeks from referral for non-urgent conditions.
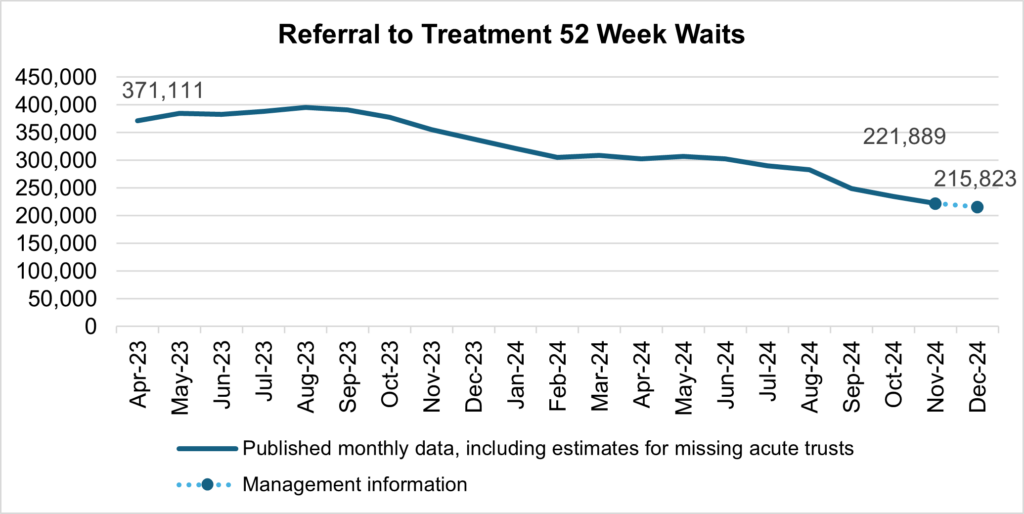
There were 221,889 waits of more than 52 weeks for treatment at the end of November, compared to 355,712 at the end of November 2023 (down 37.6%) and 234,885 at the end of October 2024 (down 5.5%). Additional management data* suggests there were 215,823 waits of more than 52 weeks as of the end of December.
*Management information for the latest month is taken from the Waiting List Minimum Dataset (WLMDS). Figures include data up to week ending 29 December 2024. WLMDS data is subject to less validation than the published monthly figures. All acute trusts submitted data for week ending 29 December 2024.
Referral to treatment 52 week waits
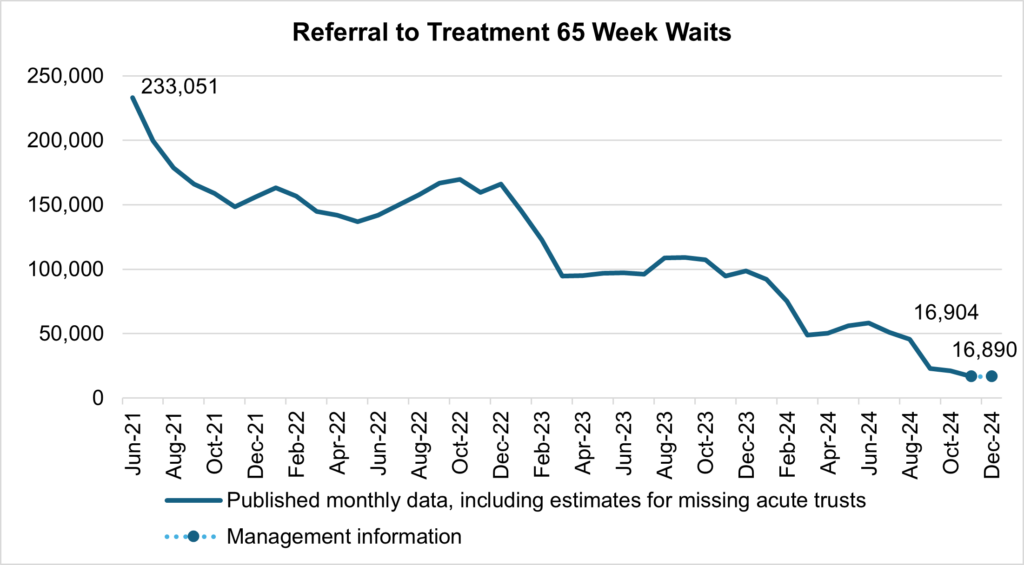
Waits of more than 65 weeks for treatment was 16,904 at the end of November, reduced compared to 94,681 at the end of November 2023 (down 82.1%) and 20,930 in October 2024 (down 19.2%). Additional management data* suggests there were 16,890 waits of more than 65 weeks for treatment as of the end of December.
*Management information for the latest month is taken from the Waiting List Minimum Dataset (WLMDS). Figures include data up to week ending 29 December 2024. WLMDS data is subject to less validation than the published monthly figures. All acute trusts submitted data for week ending 29 December 2024.
Referral to treatment 65 week waits
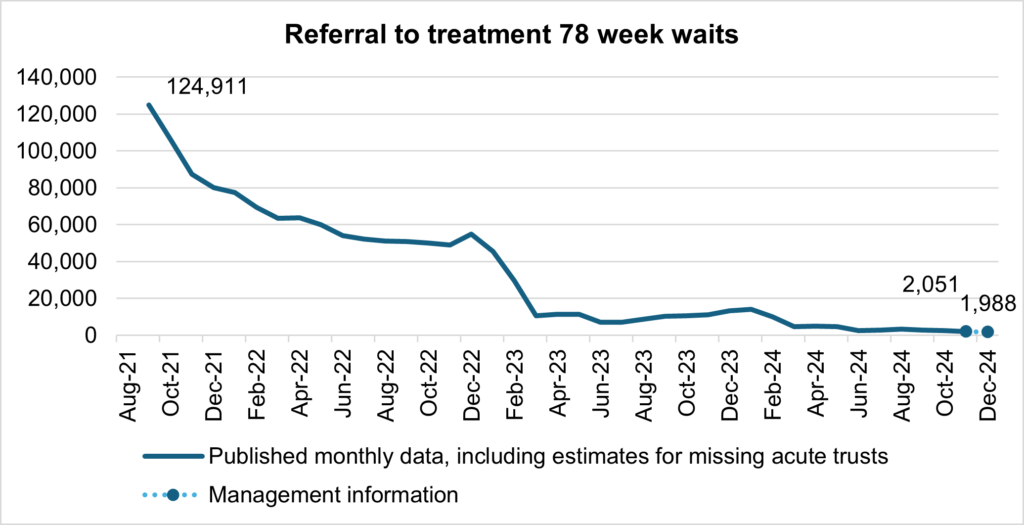
There has been a reduction in the longest waits for care, 2,051 patients were waiting more than 78 weeks for treatment at the end of November, compared to 11,215 at the end of November 2023 (down 81.7%) and 2,446 in October 2024 (down 16.1%). Additional management data* suggests there were 1,988 waits of more than 78 weeks for treatment as of the end of December.
*Management information for the latest month is taken from the Waiting List Minimum Dataset (WLMDS). Figures include data up to week ending 29 December 2024. WLMDS data is subject to less validation than the published monthly figures. All acute trusts submitted data for week ending 29 December 2024.
Referral to treatment 78 week waits
At the end of November, on the diagnostic waiting list there were 1.61 million waits, of which 321,773 had waited 6 weeks or more. The percentage of 6 week waits was 19.9%, down from 23.3% in November 2023. Progress is being made towards the interim recovery target of not more than 5% of the waiting list over 6 weeks and an increased percentage of diagnostic activity is supplied by community diagnostic centres.
Cancer
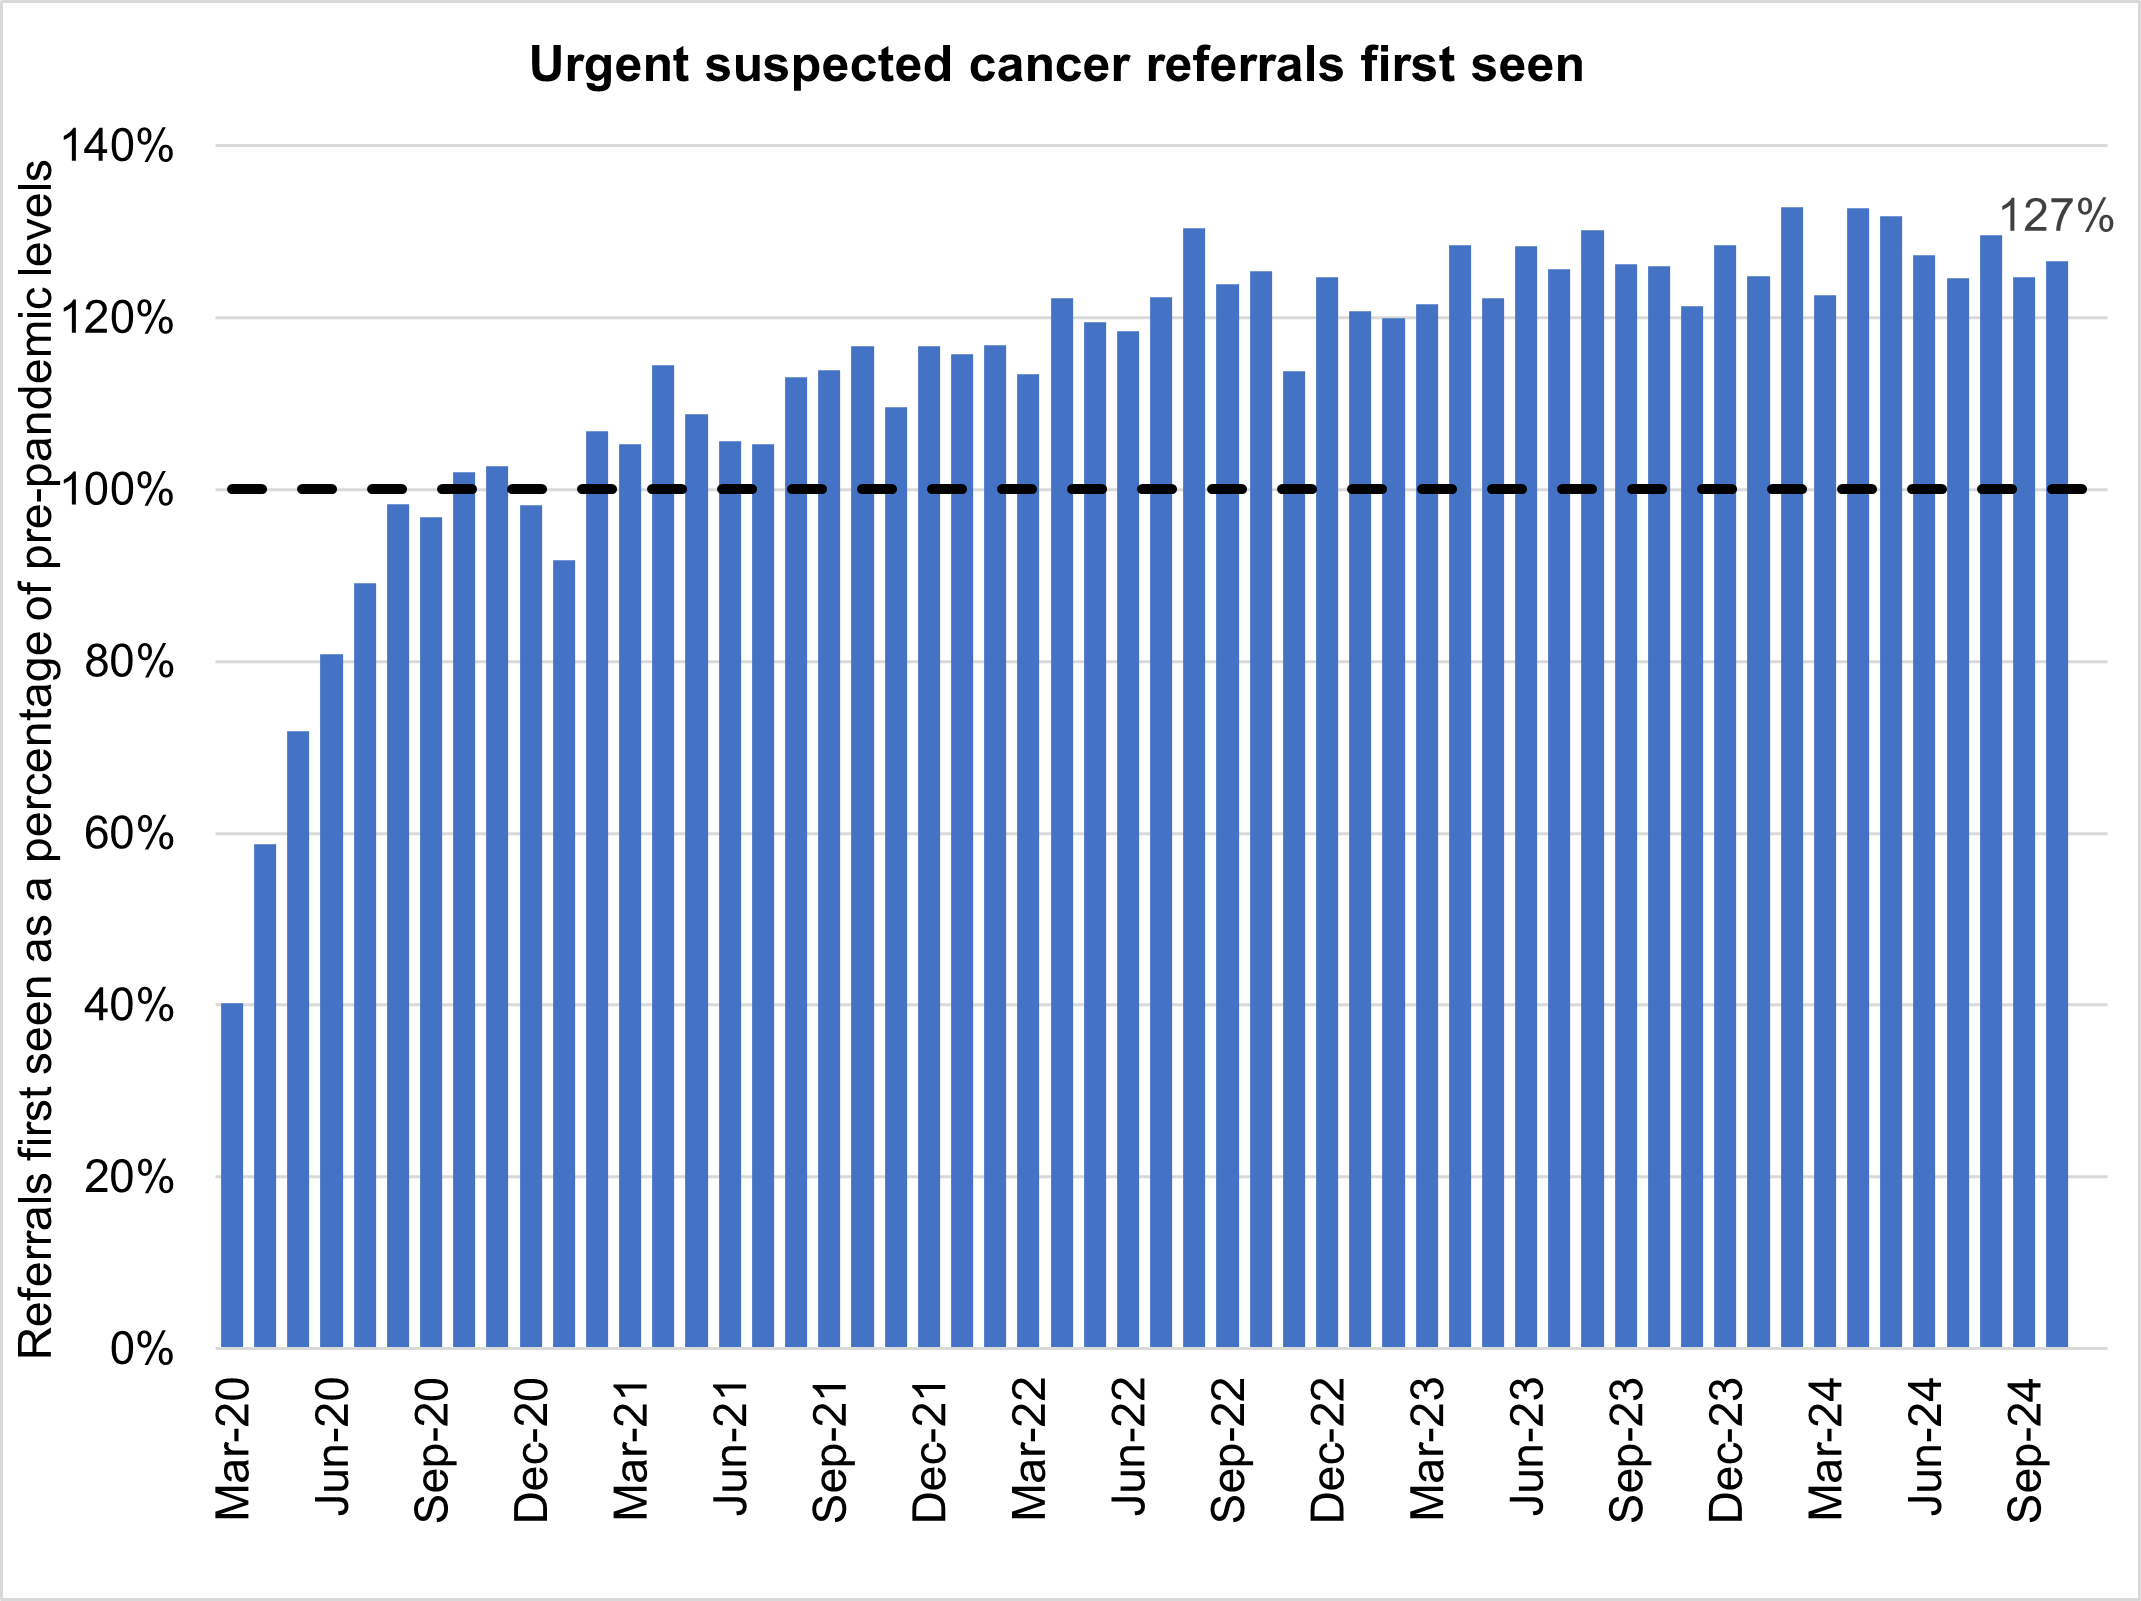
Levels of urgent suspected cancer referrals have remained at high levels, with 12,145 referrals per working day in November 2024. This is 27% more referrals than the NHS was seeing before the pandemic – the equivalent of 2,500 more referrals per working day.
Treatment activity was also at a record high level with 1,400 patients starting cancer treatment per working day, 12% above pre-pandemic levels.
Urgent suspected cancer referrals first seen
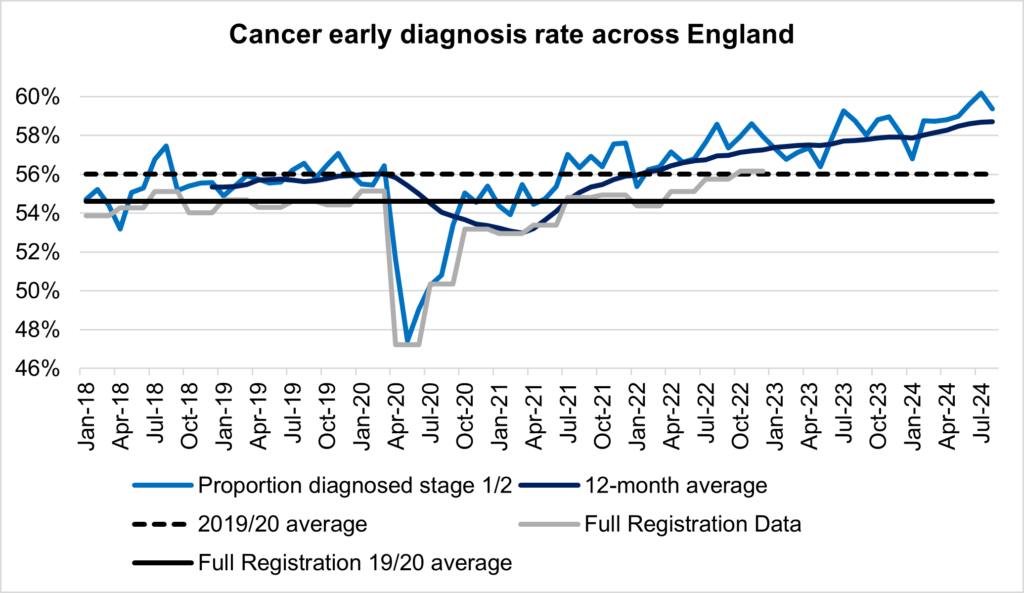
The increase in referrals has also contributed to increases in early diagnosis, which are now about 2 percentage points higher than before the pandemic. Cancer survival also continues to improve. In 2023, the Annals of Oncology published findings showing that cancer deaths are around 10% lower in the UK compared to 5 years ago.
Cancer early diagnosis rate across England
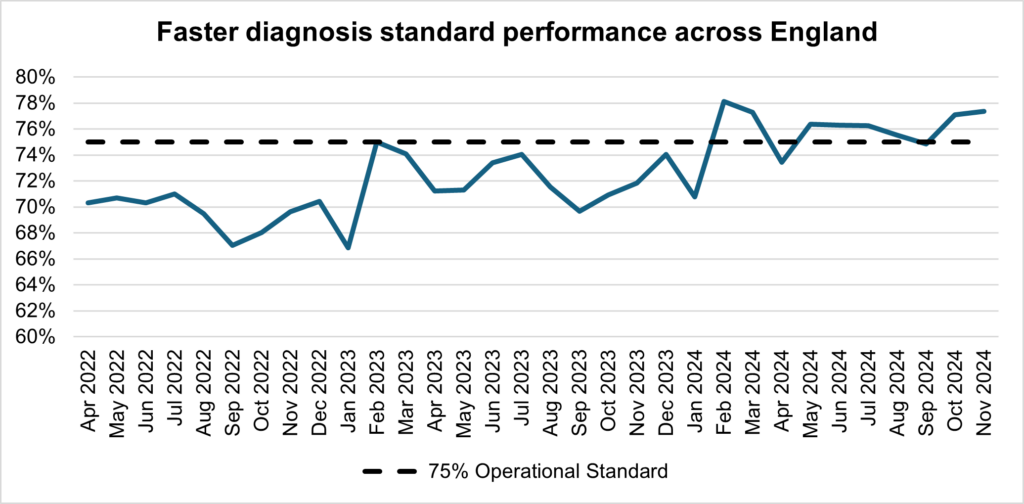
The NHS is working hard to keep up with this increase in demand. It has been accelerating the installation of new diagnostic capacity, much of it in community diagnostic centres. Performance against the 28 day faster diagnosis standard in November was 77.4%, which is above the NHS constitutional standard of 75% represents a 5.6% improvement compared to the same point last year and 0.3% improvement on October 2024.
Faster Diagnosis Standard performance across England
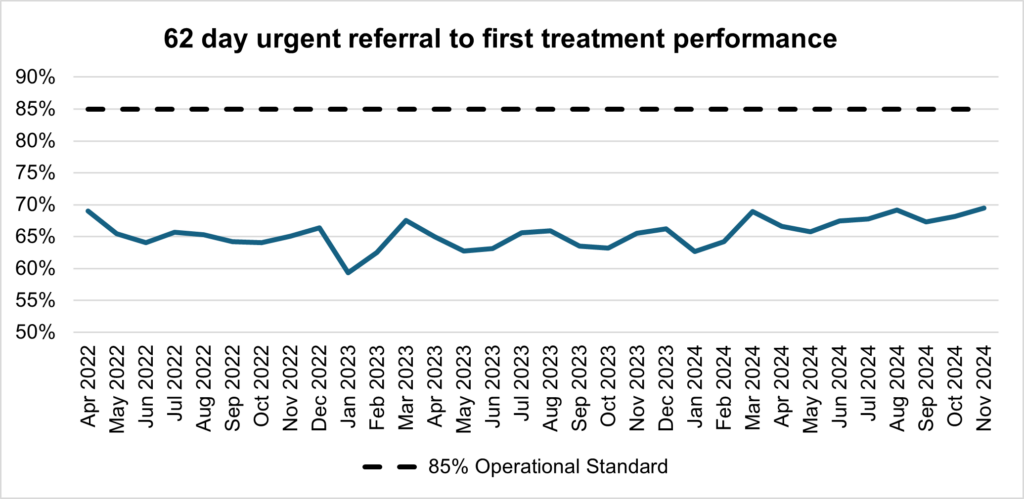
In November, performance against the 62 day Urgent Referral to First Treatment Standard, was 69.4% which was 3.9% higher than at the same point last year, and 1.2% higher than October 2024, but still well below where we want to see it. The NHS has set the ambition to improve this to 70% by March 2025, as a first step in recovering performance to the NHS constitutional standard of 85%.
62 day Urgent Referral to First Treatment performance