Executive summary
This briefing draws on official statistics published here.
- Every day, over 140,000 people access UEC services across the country, including more than 11,000 who are so unwell they need to be admitted to hospital for a day or more, and 20,700 people who are seen by the ambulance service. There was a total of 2,395,886 attendances at A&E departments across England in May. The average daily attendances decreased to 77,287. This is 1.0% higher than April’s daily average and 0.8% lower than May 2024.
- 75.4% of patients were admitted, transferred or discharged within four hours compared to 74.8% in April and 74.0% in May 2024. This is below the NHS constitutional standard of 95%. By the end of the year we expect a minimum of 78% of patients who attend an A&E to be admitted, transferred or discharged within 4 hours.
- The average ambulance response time for category 2 calls was 27 minutes and 54 seconds. This has increased from 27 minutes and 34 seconds in April 2025 and decreased from 32 minutes and 44 seconds in May 2024. This is below the 30 minute target for the year but not the NHS constitutional standard of 18 minutes.
- As of the end of April, there were 7.39 million waits for treatment, a decrease of 31,628 from April 2025. The estimated number of patients waiting for care at the end of April was 6.23 million people. Of the 7.39 million pathways on the waiting list in April 2025, 1.16 million had a decision to be admitted for treatment.
- In April 2025, there were 264,880 patients seen following an Urgent Suspected Cancer referral, equivalent to over 13,000 patients seen per working day. Adjusted for the number of working days, this is 2.2% higher than last month (March 2025), and 6.8% higher than at the same point last year (April 2024).
- Performance against the 28 day faster diagnosis standard to reduce the time between referral and diagnosis of cancer was 76.7% in April 2025. This is above the NHS constitutional standard of 75% and represents a 2.2 percentage point decrease from March 2025, and conforms to seasonal decreases in performance that are commonly observed each April. Performance for April 2025 represents a 3.4 percentage point increase compared to the same point last year.
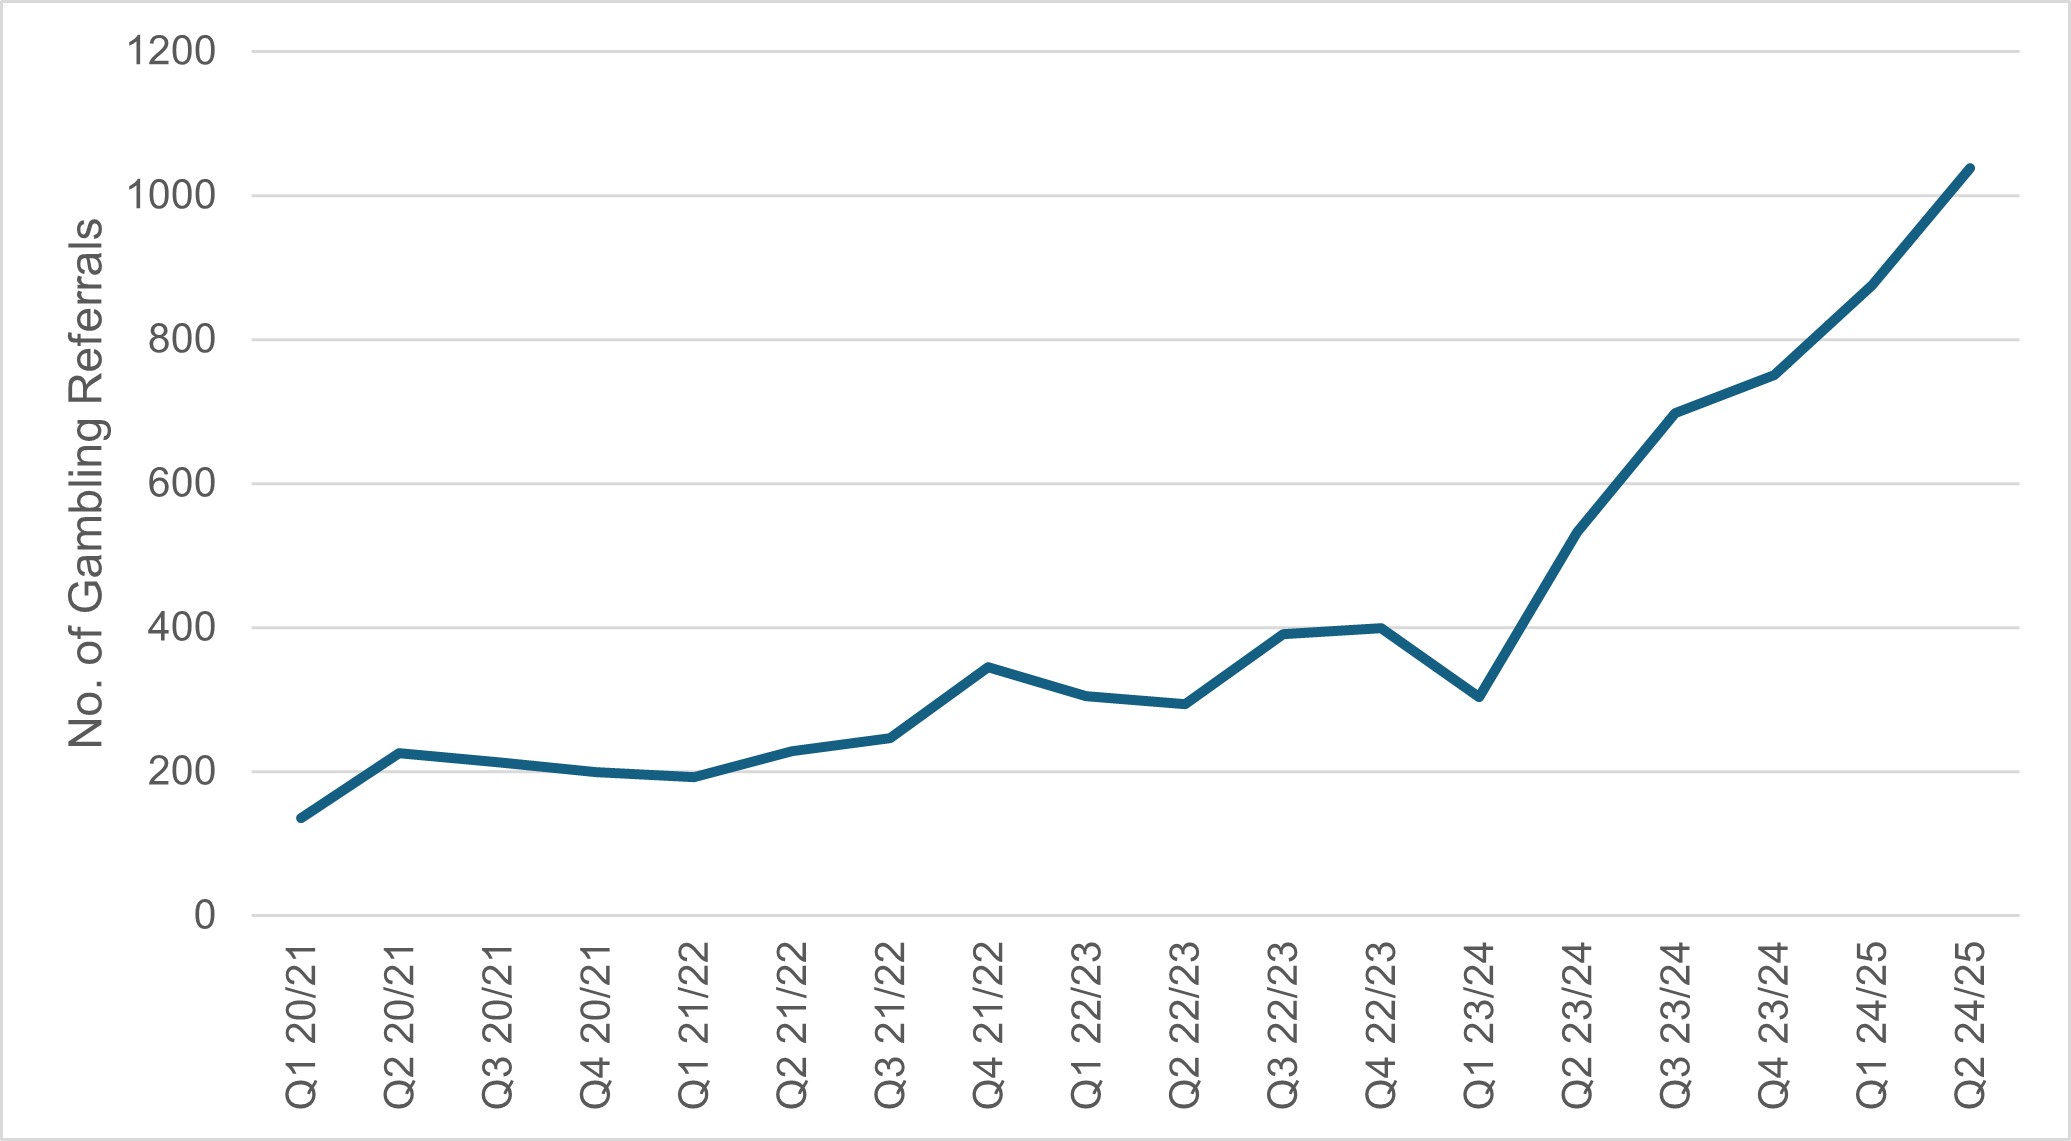
- The NHS Long Term Plan (2019) committed to expanding geographical coverage of NHS specialist clinics to help more people with serious gambling problems. By March 2024, 15 specialist NHS gambling harms clinics had been established across the country, including provision for under-18s. At the end Q2 2024/25 there were 1,914 in-year referrals to these services, a 129% increase on the 836 referrals received at the same point in 2023/24.
Urgent and emergency care
Urgent and emergency care services play a specific part in supporting patients to receive the right care, by the right person, as quickly as possible.
Emergency care involves life-threatening illnesses or accidents which require immediate treatment from the ambulance service (via 999) and an emergency department (A&E).
Urgent care involves any non-life-threatening illness or injury needing urgent attention which might be dealt with through the NHS111 Clinical Assessment Service, pharmacy advice, out-of-hours GP appointments, and/or referral to an urgent treatment centre (UTC).
Every day, over 140,000 people access UEC services across the country, including more than 11,000 who are so unwell they need to be admitted to hospital for a day or more, and 20,700 people who are seen by the ambulance service.
There was a total of 2,395,886 attendances at A&E departments across England in May. The average daily attendances decreased to 77,287. This is 1.0% higher than April’s daily average and 0.8% lower than May 2024.
The Urgent and emergency care plan summarises priority actions and outlines the roles of NHS England, the Department of Health and Social Care and our system colleagues.
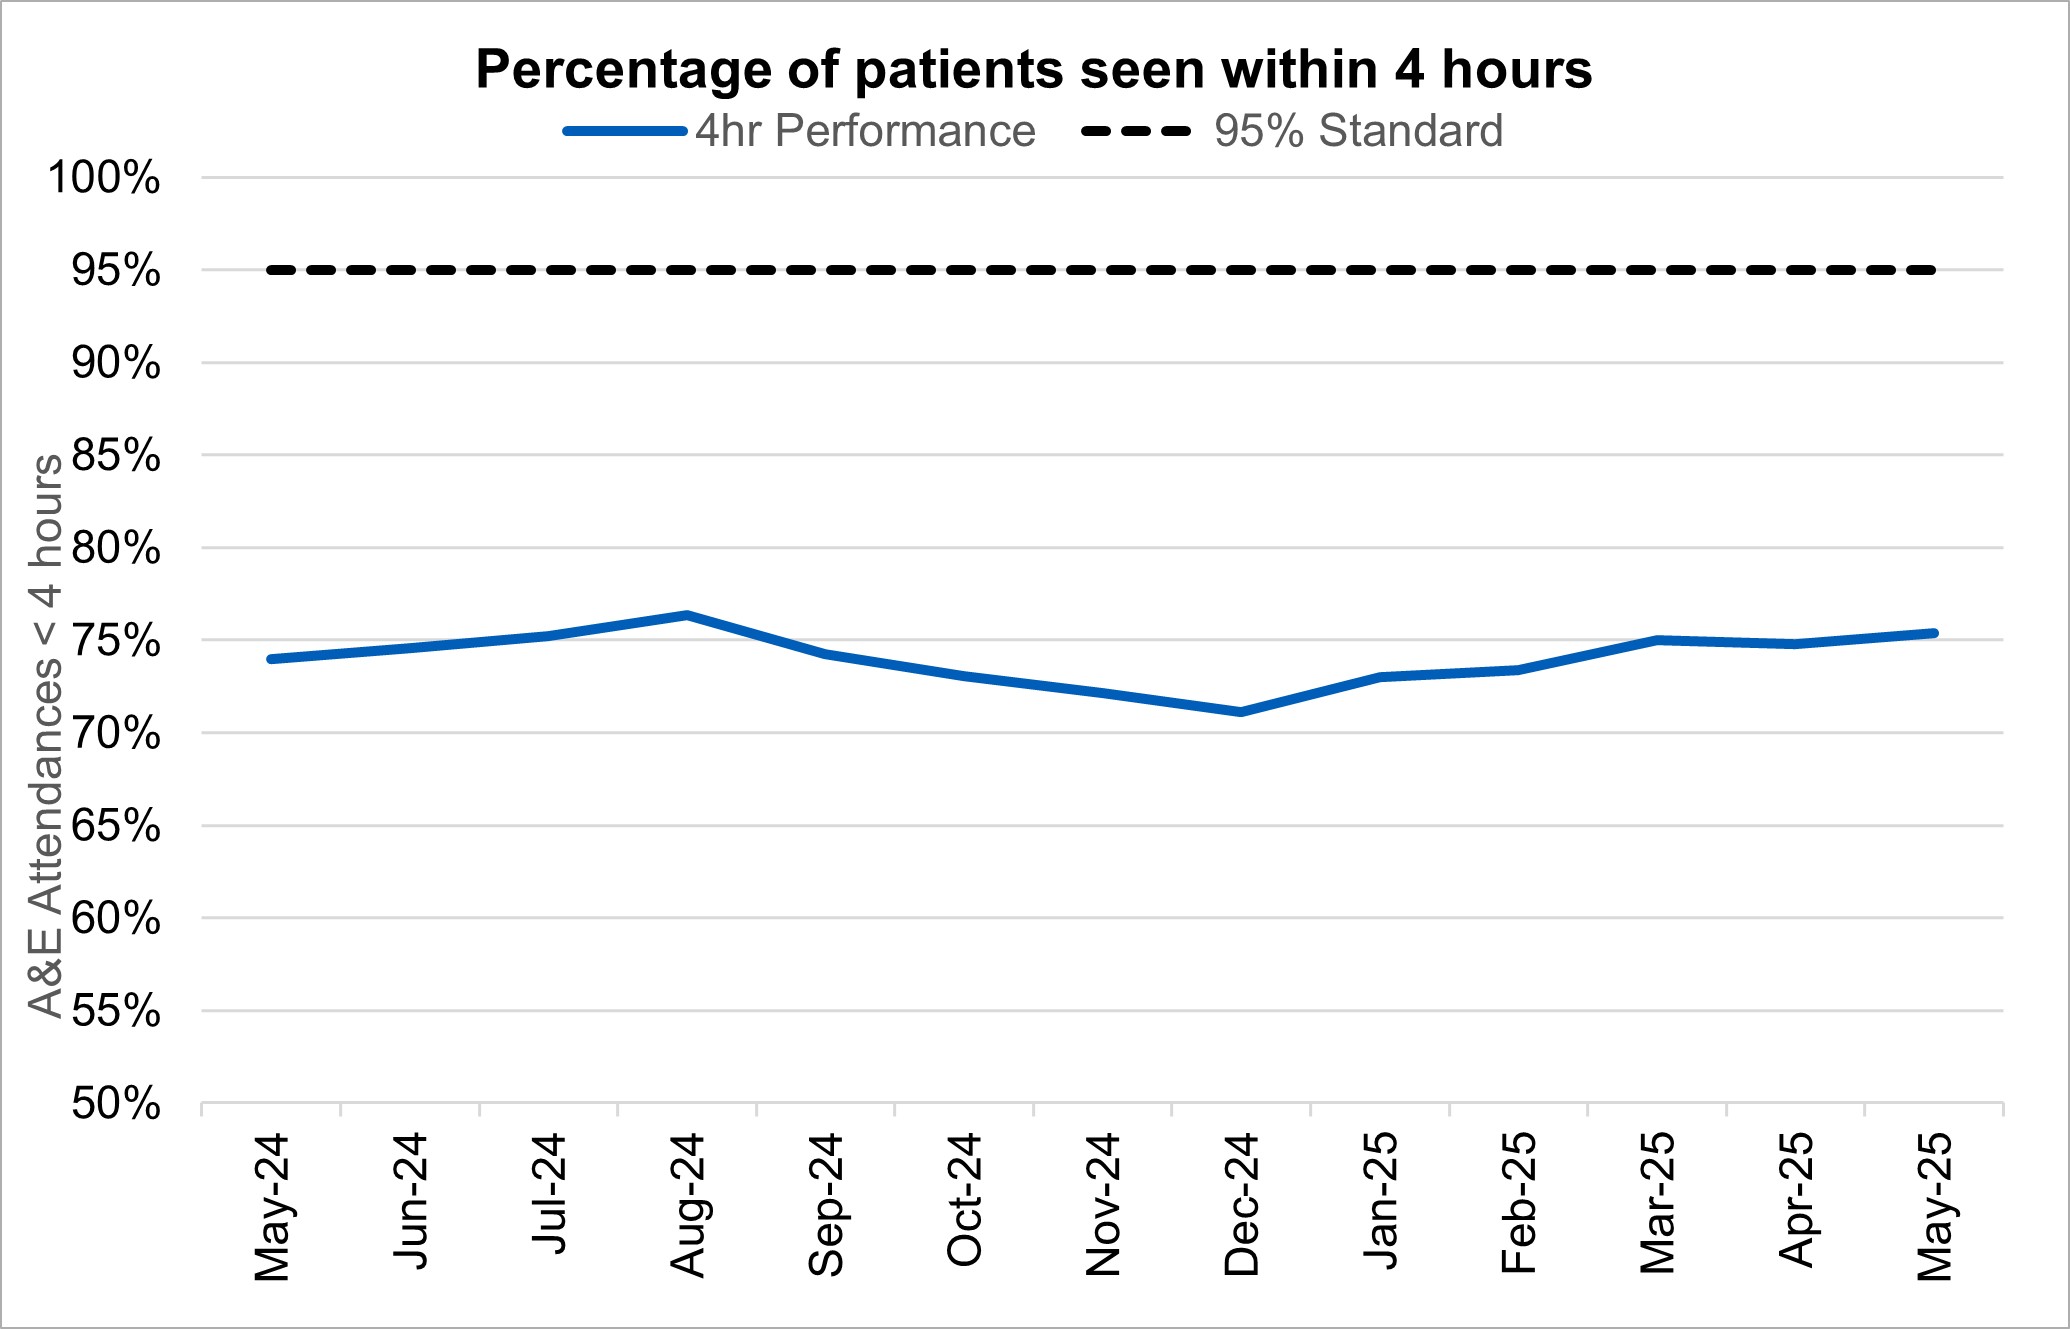
75.4% of patients were admitted, transferred or discharged within four hours compared to 74.8% in April and 74.0% in May 2024. This is below the NHS constitutional standard of 95%. By the end of the year we expect a minimum of 78% of patients who attend an A&E to be admitted, transferred or discharged within 4 hours.
The provisional figures published for May indicate that 9.3% of patients attending a type 1 and 2 A&E department spent 12 hours from arrival in A&E compared with 10.1% last month. It is a priority to reduce the number of patients waiting over 12 hours for admission or discharge from an emergency department compared to 2024/25, so that this occurs less than 10% of the time.
Percentage of patients seen within 4 hours
Ambulance services answered 800,660 calls to 999, or 25,828 per day, an increase of 1.7% compared to April 2025 and 1.8% less than May 2024. There were 383,664 incidents where a patient was conveyed to A&E or 12.4 thousand per day, 0.9% fewer per day than in April 2025 and 0.5% more than May 2024.
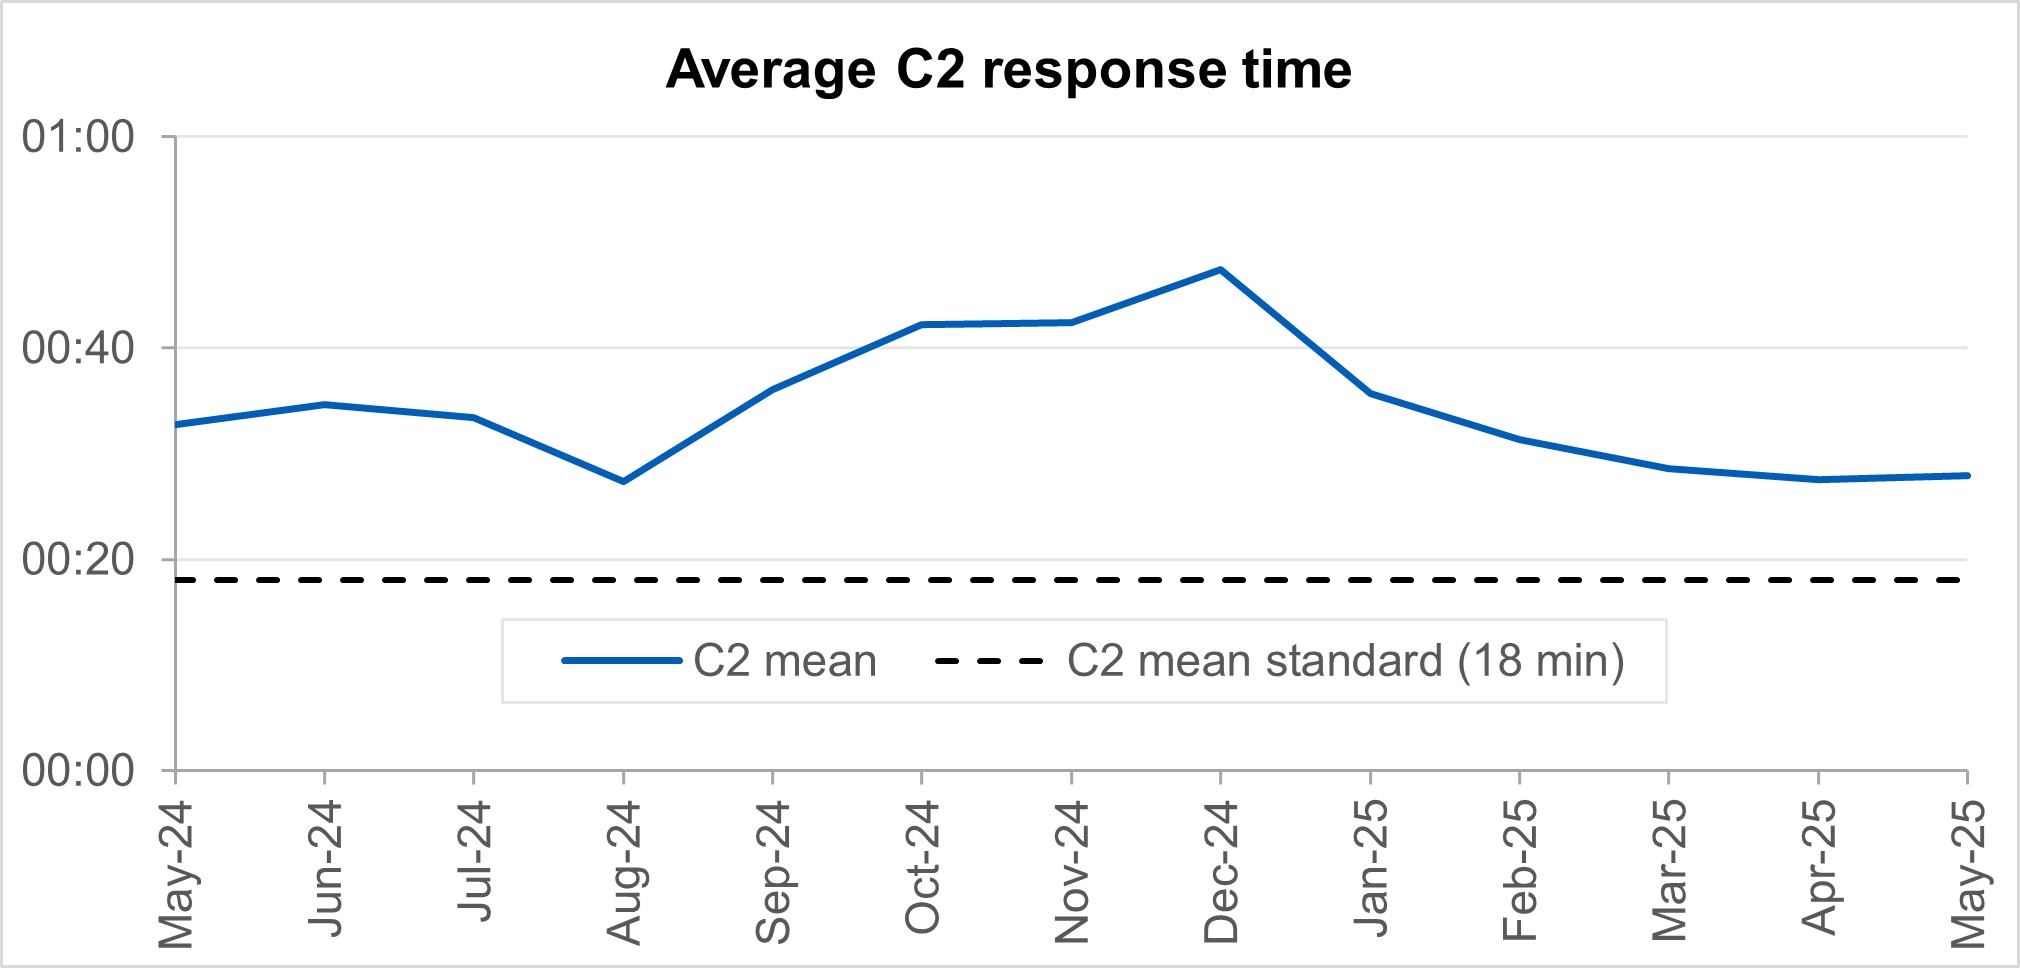
It is a priority for patients who are categorised as Category 2 – such as those with a stroke, heart attack, sepsis or major trauma – receive an ambulance within 30 minutes. The average ambulance response time for category 2 calls was 27 minutes and 54 seconds. This has increased from 27 minutes and 34 seconds in April 2025 and decreased from 32 minutes and 44 seconds in May 2024. This is below the 30 minute target for the year but not the NHS constitutional standard of 18 minutes.
Average C2 response times, England
‘Hear and Treat’ clinical teams have been embedded in all ambulance control centres to increase the number of patients who can be appropriately treated over the phone. 999 calls are responded to by an ambulance service over the phone instead of sending an ambulance, with a clinician giving treatment and advice remotely. Since March 2024, 16% of all ambulance calls across England were handled by ‘Hear and Treat’, meaning they did not require an ambulance to be dispatched.
As well as improving outcomes for patients, ‘Hear and Treat’ also reduces pressure on Emergency Departments and improves ambulance response times.
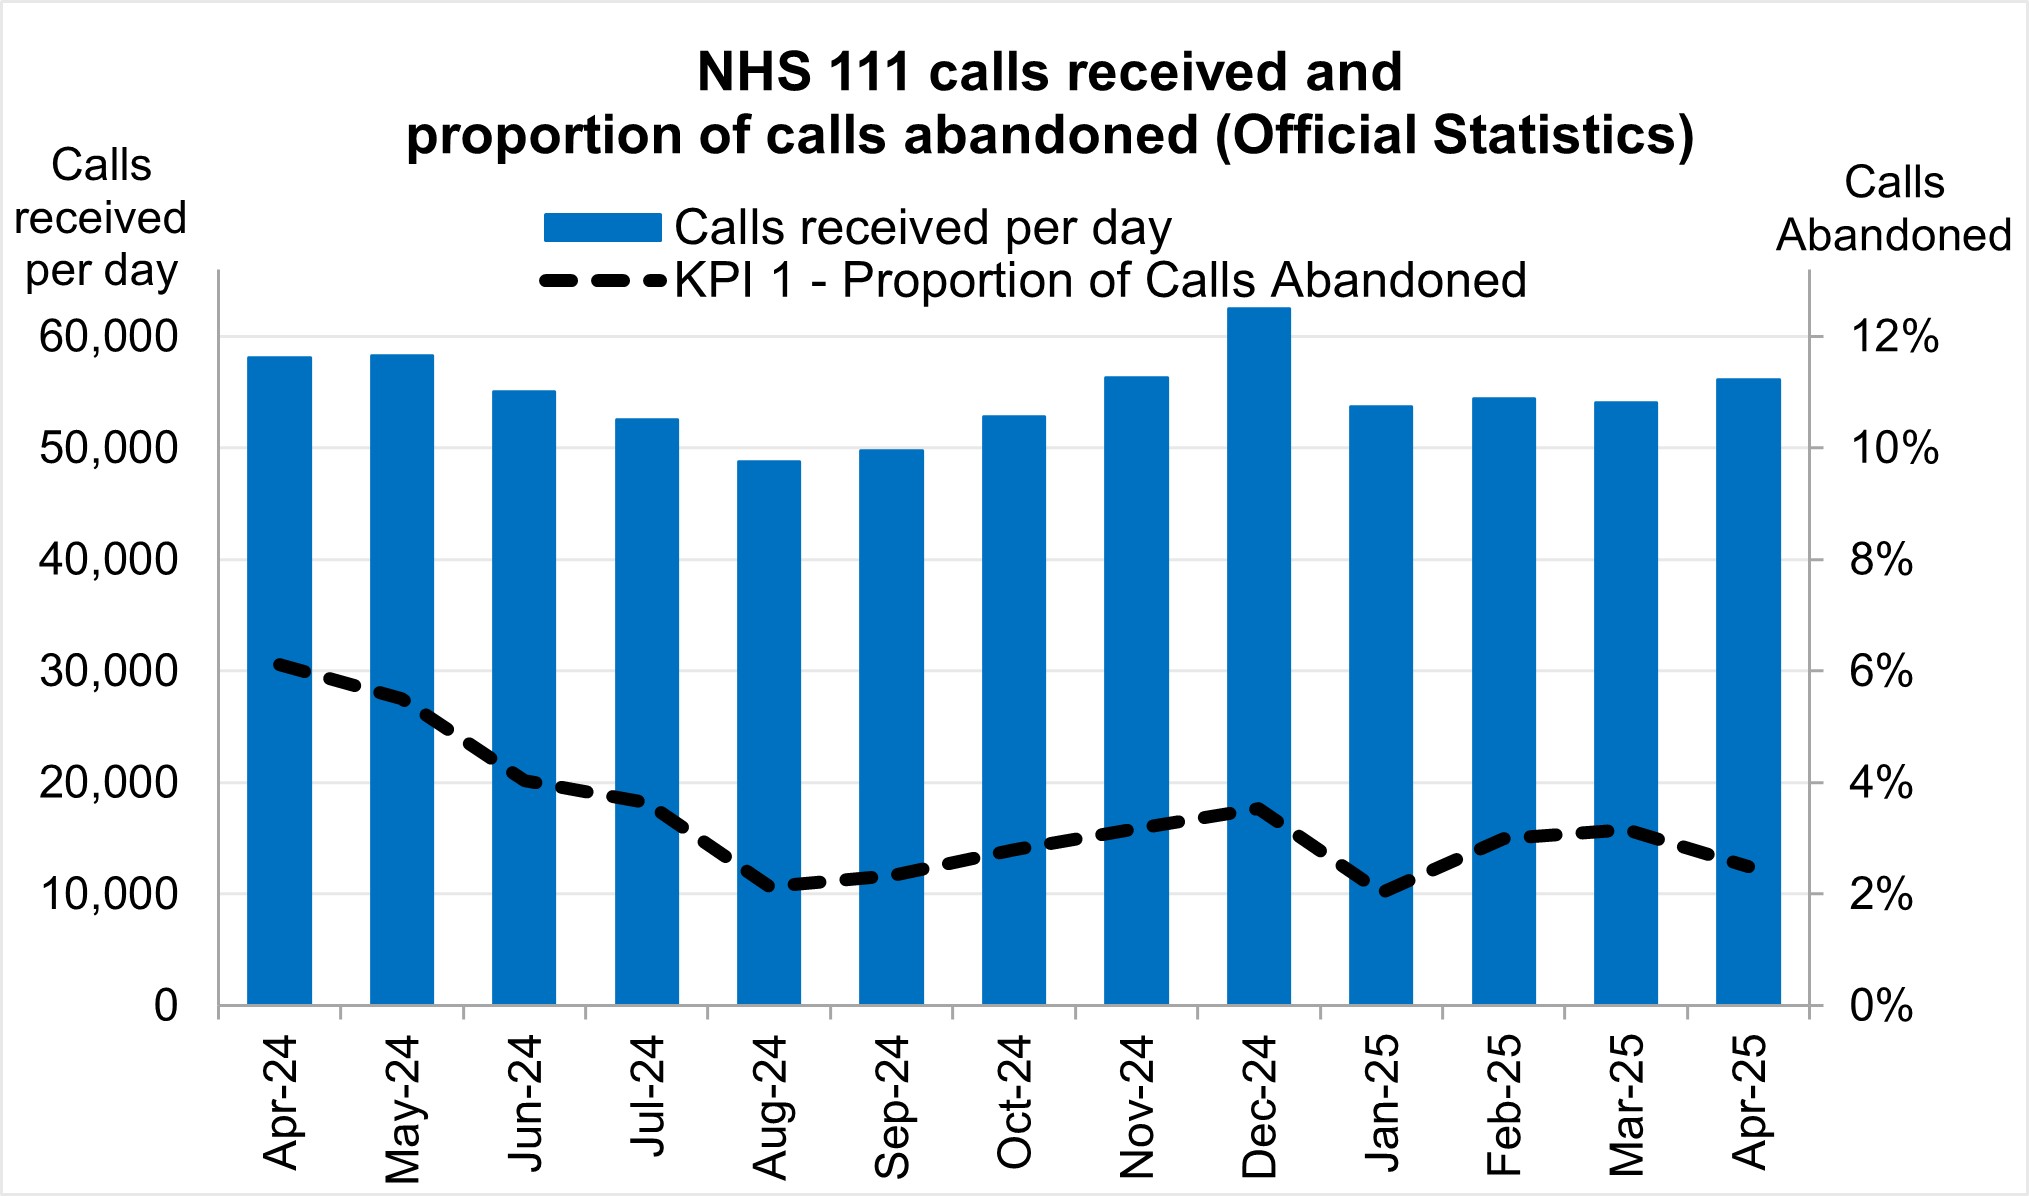
NHS 111 received 1.68 million calls (c. 56.1 thousand per day) in April 2025. Demand per day was 3.4% down year on year and up 3.8% on March 2025.The proportion of calls abandoned decreased 0.7% percentage points from the previous month (now at 2.5%) and the average speed to answer reduced to 40 seconds.
Elective recovery
Elective care covers a broad range of planned, non-emergency services – from tests and scans to outpatient appointments, surgery and cancer treatment.
As of the end of April, there were 7.39 million waits for treatment, a decrease of 31,628 from April 2025. The estimated number of patients waiting for care at the end of April was 6.23 million people. Of the 7.39 million pathways on the waiting list in April 2025, 1.16 million had a decision to be admitted for treatment.
While NHS staff have worked extremely hard in the aftermath of the pandemic to tackle the elective backlog – reducing long waits and treating the most clinically urgent cases – the NHS is a long way from meeting the required constitutional standard. The Elective Reform Plan was launched in January 2025, which sets out our intention to return to delivery of the constitutional standard: 92% of patients on the waiting list should have been waiting no longer than 18 weeks from referral to treatment. The Elective Reform Plan also sets out the ambition to improve the percentage of patients waiting no longer than 18 weeks for a first appointment to 72% by March 2026. The position in the latest management data is 65.9%.*
*[Management information for the latest month is taken from the Waiting List Minimum Dataset (WLMDS). Figures include data up to week ending 25 May 25. WLMDS data is subject to less validation than the published monthly figures. All acute trusts submitted data for week ending 25 May 25.
The % waiting for first attendance within 18 weeks is calculated using:
- denominator: the number of cases where patients on the waiting list without a decision to admit (i.e. incomplete outpatient pathways) were waiting for a first appointment at the snapshot date
- numerator: the number of cases where patients on the waiting list without a decision to admit were waiting for a first appointment and had been waiting up to 18 weeks at the snapshot date]
To meet the 18-week standard and reform elective care by March 2029, we are focusing on empowering patients by giving them more choice and control, reforming delivery by working more productively, delivering care in the right place and aligning funding, performance oversight and delivery standards.
The ambition for 18 weeks performance is to reach the constitutional standard of 92% by March 2029 and 65% by March 2026, the position at the end of April 2025 was 59.7% (down 0.1 percentage points from March 2025).
There were 190,068 waits of more than 52 weeks for treatment at the end of April, compared to 302,589 at the end of April 24 (down 37.2%) and 180,242 at the end of March 25 (up 5.5%). This represents 2.6% of the total waiting list.
Referral to treatment 52-week waits
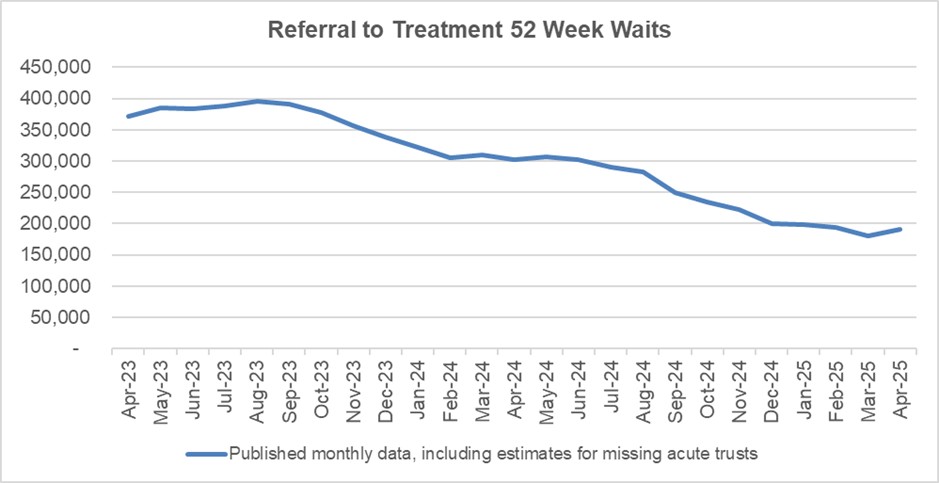
As we shift the focus to the 18 week standard, we will continue to ensure that the longest waits are tackled and the number of patients waiting unacceptably long times continues to reduce.
Waits of more than 65 weeks for treatment was 9,258 at the end of April, reduced compared to 50,397 at the end of April 2024 (down 81.6%) but an increase from 7,381 in April 2025 (up 25.4%).
There were 1,361 patients waiting more than 78 weeks for treatment at the end of March, compared to 5,013 at the end of March 2024 (down 72.9%) but an increase from 1,164 in March 2025 (up 16.9%).
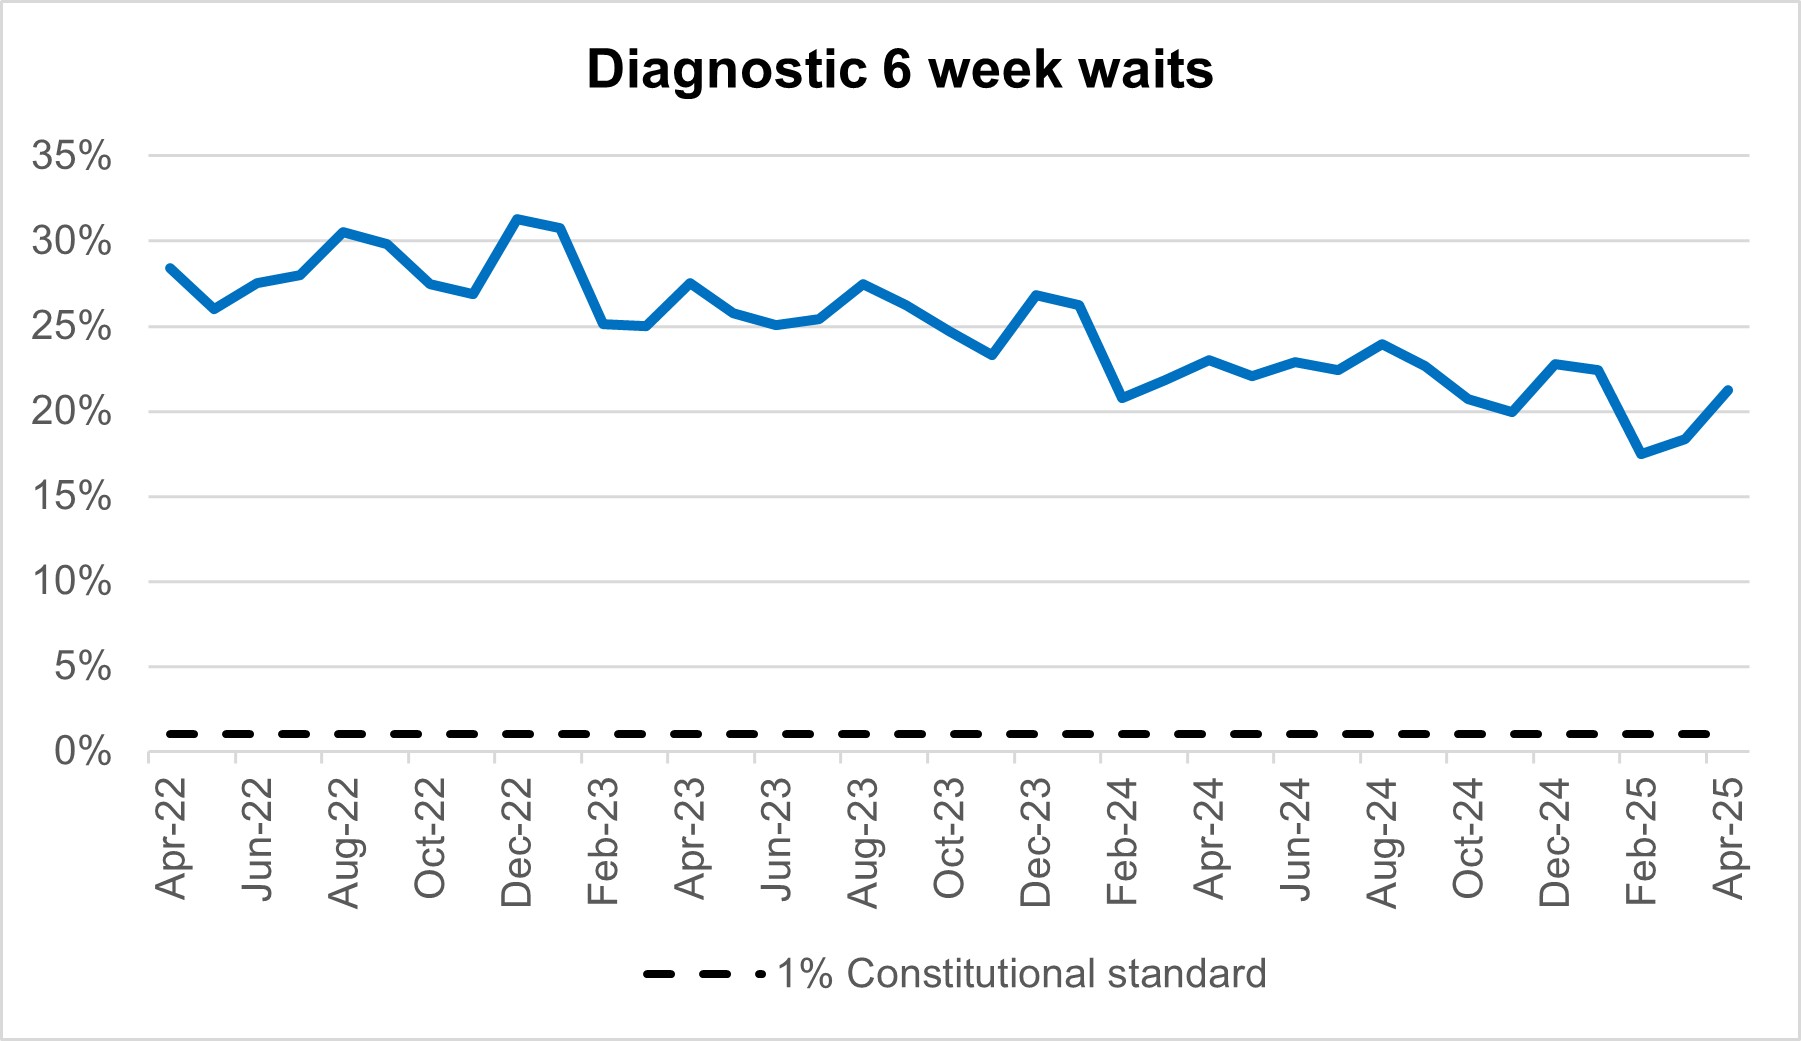
2.4 million diagnostic tests were delivered in April, 8.2% higher than the same month last year (2.3 million in April 2024). At the end of April, on the diagnostic waiting list there were 1.7 million waits, of which 360,400 had waited 6 weeks or more. The percentage of 6-week waits was 21.2%, up from 18.4% in March 2025 but down from 23.0% in April 2024. Progress is being made towards the interim recovery target of not more than 5% of the waiting list over 6 weeks and an increased percentage of diagnostic activity is supplied by Community Diagnostic Centres.
Diagnostic 6-week waits
By providing a wider range of and capacity for tests and more consulting rooms, CDCs can improve elective pathways for both urgent cancer pathways and routine diagnostic pathways. There are 1.7 million waits for the 15 major diagnostic tests and demand is rising. With 170 community diagnostic centres (CDCs) up and running by the end of March 2025, these centres can take on more of the growing diagnostic demand within elective care.
Cancer
In April 2025, there were 264,880 patients seen following an Urgent Suspected Cancer referral, equivalent to over 13,000 patients seen per working day. Adjusted for the number of working days, this is 2.2% higher than last month (March 2025), and 6.8% higher than at the same point last year (April 2024). We also saw 55,011 patients received treatment for cancer, equivalent to more than 2,500 patients per working day. This is at 4.7% more than last month, and 3.2% higher than at the same point last year (April 2024).
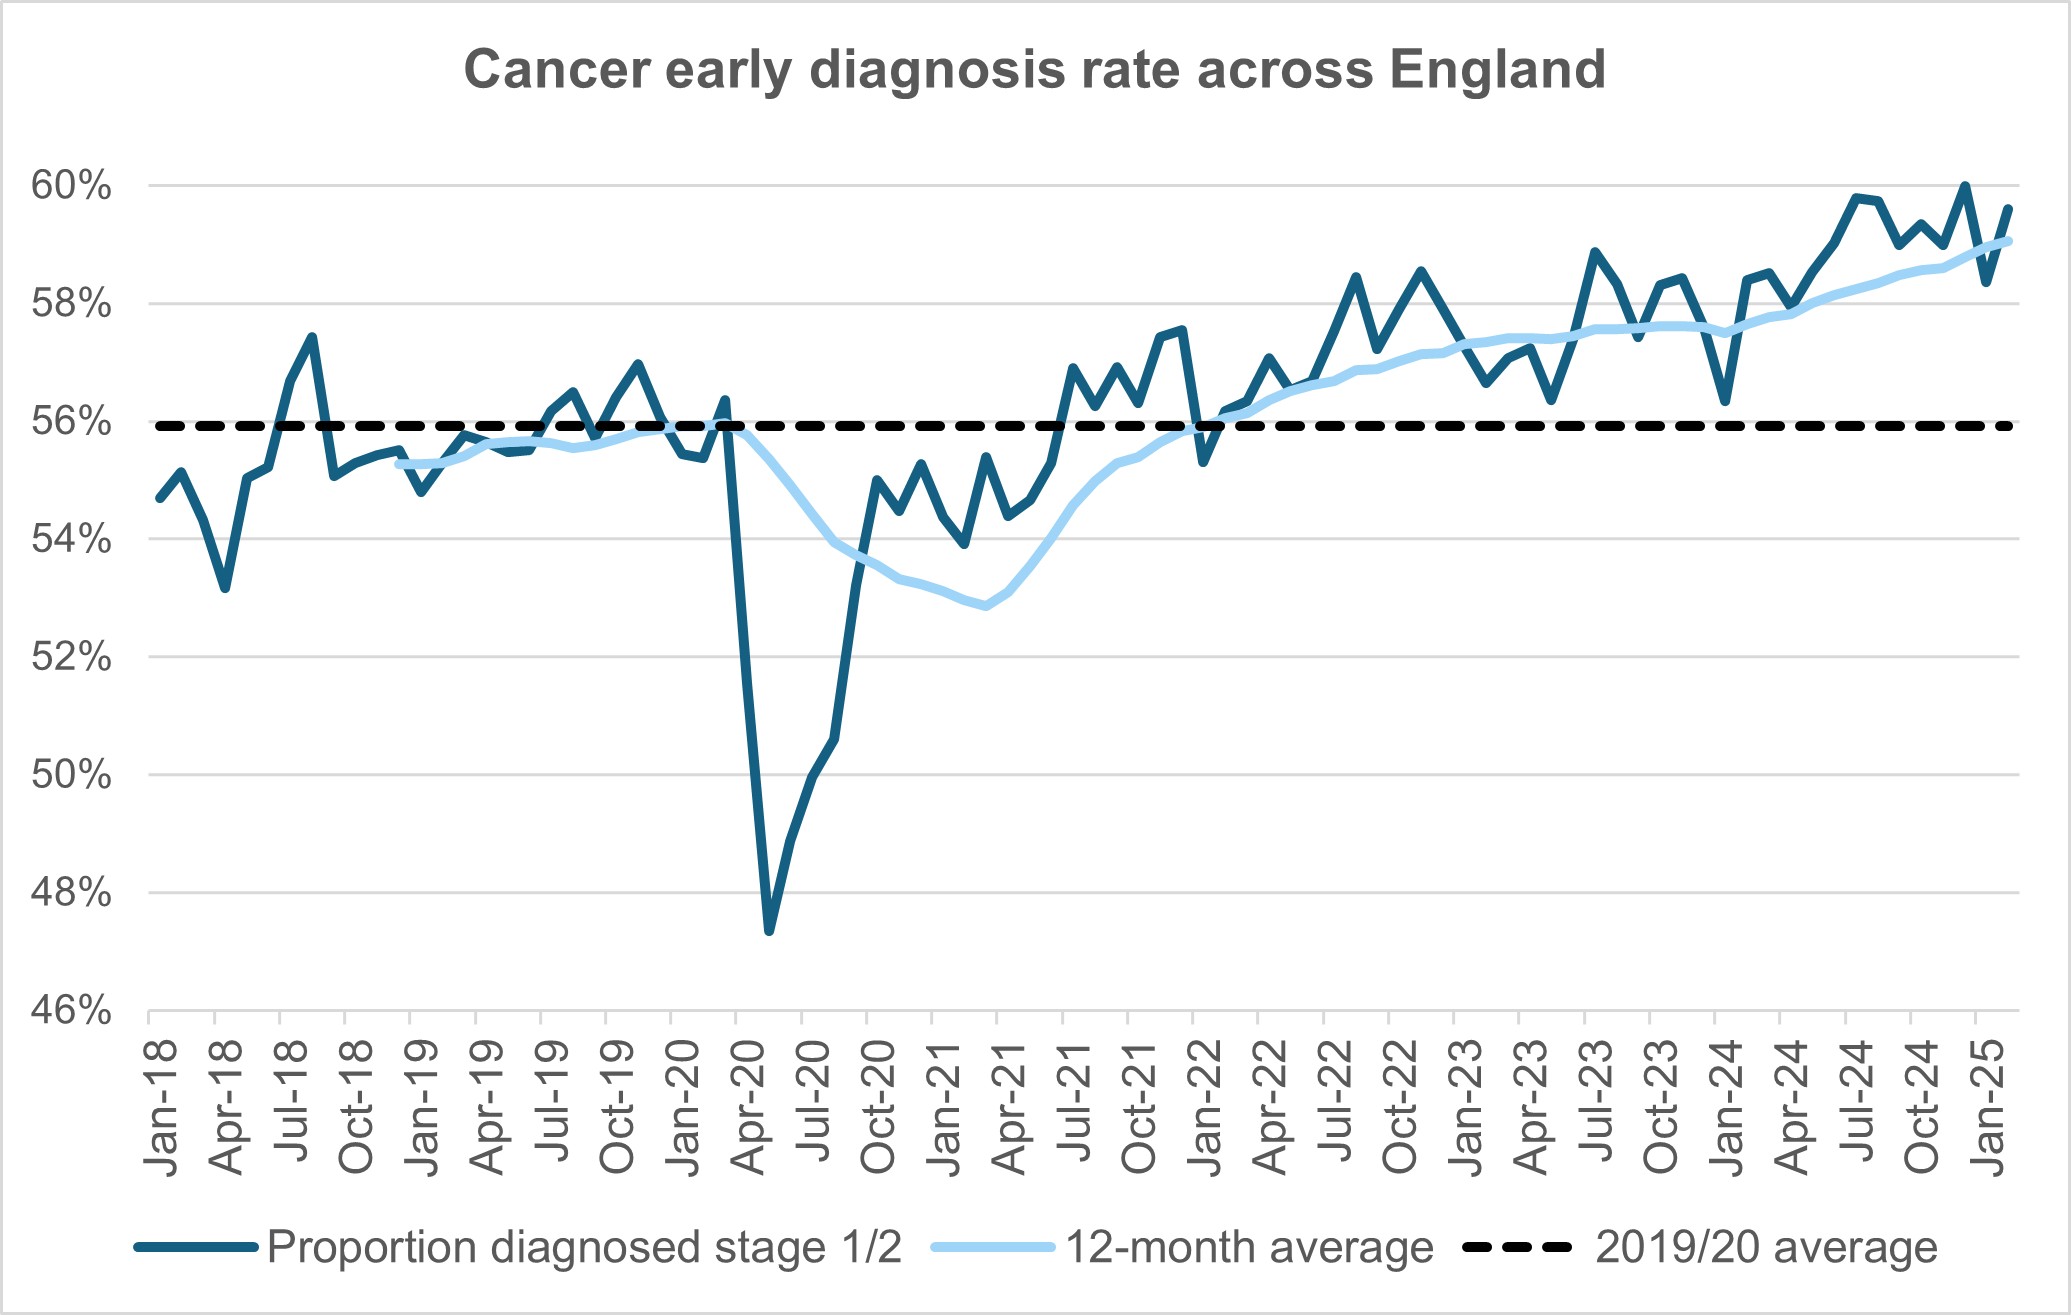
The NHS is working hard to keep up with this increase in demand. We are making strong progress on diagnosing patients earlier, which will improve outcomes and have been accelerating the installation of new diagnostic capacity, much of it in Community Diagnostic Centres.
Cancer early diagnosis rate across England
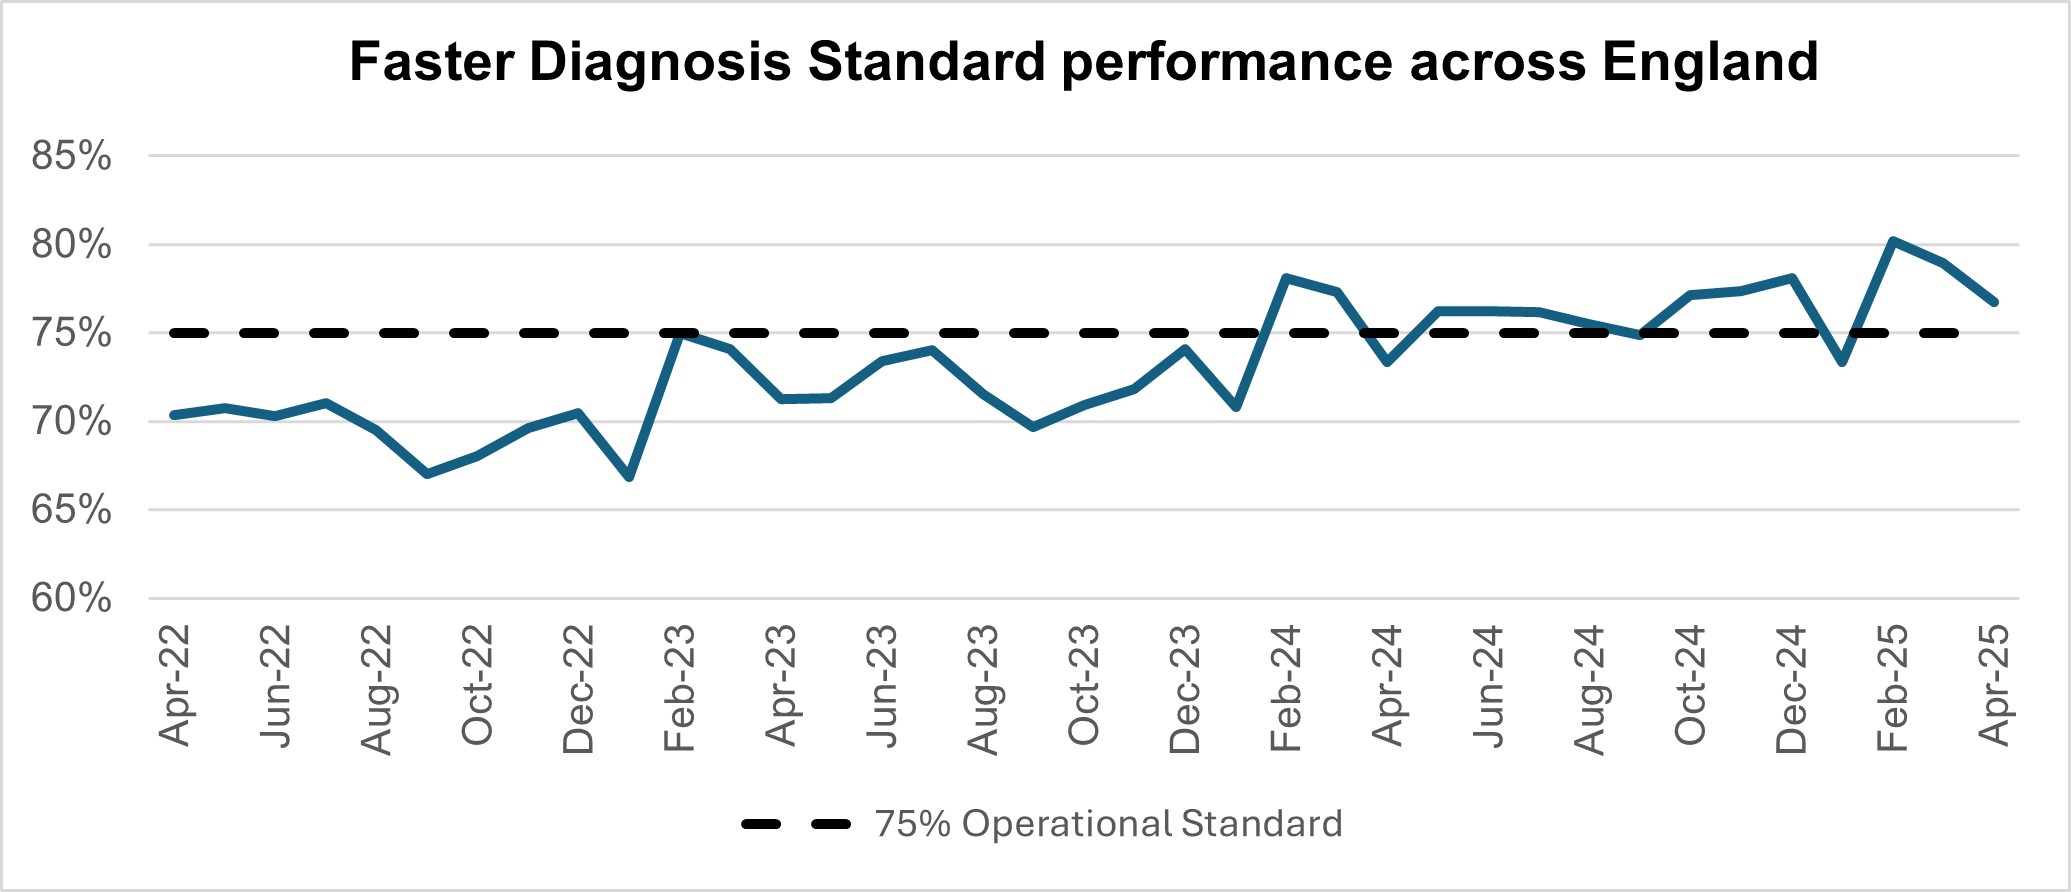
Performance against the 28 day faster diagnosis standard to reduce the time between referral and diagnosis of cancer was 76.7% in April 2025. This is above the NHS constitutional standard of 75% and represents a 2.2 percentage point decrease from March 2025, and conforms to seasonal decreases in performance that are commonly observed each April. Performance for April 2025 represents a 3.4 percentage point increase compared to the same point last year.
Faster diagnosis standard performance across England
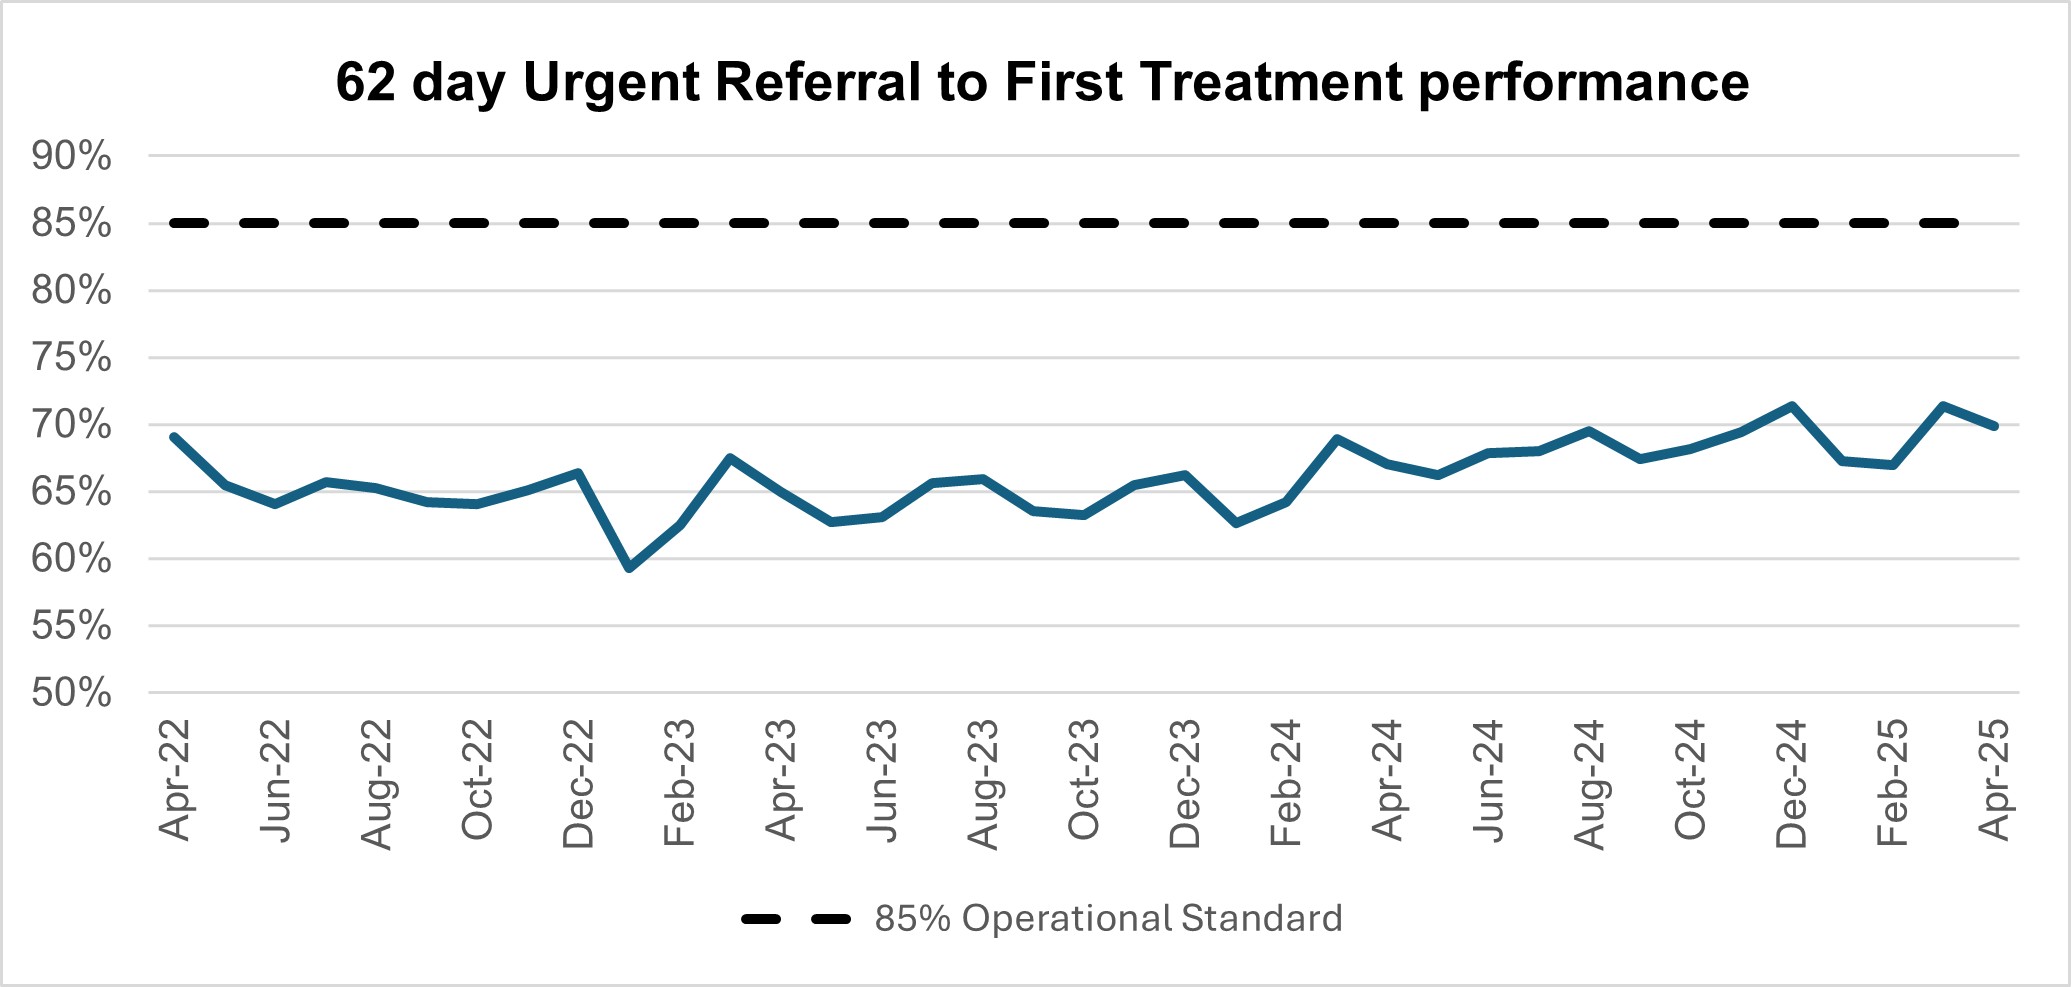
Performance against the 62 day Urgent Referral to First Treatment Standard to begin first definitive treatment of an urgent suspected cancer referral, breast symptomatic referral, urgent screening referral or a consultant upgrade was 69.9% in April 2025. This was 1.5 percentage points lower than March 2025, and conforms to seasonal decreases in performance that are commonly observed each April. April’s 2025 performance was 2.8 percentage points higher than the same point last year, but still below where we want to see it.
62-day urgent referral to first treatment performance
Mental Health
The NHS Long Term Plan (2019) committed to expanding geographical coverage of NHS specialist clinics to help more people with serious gambling problems. By March 2024, 15 specialist NHS gambling harms clinics had been established across the country, including provision for under-18s. At the end Q2 2024/25 there were 1,914 in-year referrals to these services, a 129% increase on the 836 referrals received at the same point in 2023/24.
In November 2024, the Government confirmed plans for the introduction of a statutory levy on gambling operators to fund the research, prevention and treatment of gambling-related harms across Great Britain. NHS England welcomed these proposals, which present the first opportunity to put gambling treatment services on a sustainable footing and expand care across the country and are now looking to implement at pace. The levy will raise approximately £100 million per year, of which 50% will be overseen by NHS England, and appropriate bodies in Scotland and Wales, to commission the full treatment pathway, from referral and triage through to aftercare, working in collaboration with the third sector.
Number of gambling referrals