
Executive summary
- Pressure has continued in emergency departments across the country, with 2.2 million A&E attendances, the busiest October on record, and over 547,000 emergency admissions in October 2023, the highest number since January 2020.
- Ambulance services also faced their busiest month this year for category 1 and category 2 callouts, and answering more than 850,000 calls to 999, the highest figure in 2023 so far.
- Continuing industrial action in the NHS has had a significant impact on patients. Since strikes began, the cumulative total of rescheduled acute inpatient and outpatient appointments exceeded one million for the first time.
- The NHS is treating more people than before the pandemic, with 1,446,805 patients starting treatment in September, an increase of 5% from the same month last year and an increase of 2% compared with the same month in 2019. Improvements have also been made on the number of patients waiting more than a year for treatment, which is down by more than 5,500 since August 2023.
- For the first time, the NHS has published the number of individual patients on the waiting list – 6.5 million – in addition to the total number of appointments and treatments currently on the waiting list – 7.77 million.
- Demand for cancer services continued at record levels in September 2023, with the number of urgent suspected cancer referrals at 130% of pre-pandemic levels. Treatment is also at record levels and there has been a reduction in the 62-day cancer backlog as a result.
- The NHS has made progress in reducing the number of people with a learning disability and autistic people in inpatient mental health settings. This has decreased by almost 30% since March 2015.
Urgent and emergency care
Three days of joint industrial action by junior doctors and consultants placed extraordinary pressure on urgent and emergency care in October. With little time to recover from the previous round of industrial action, hospital discharges slowed which inevitably impacted patient flow.
There were 2,219,618 attendances in A&Es across England, an average of 71,601 per day. This is an increase of 1.4% compared to October 2022 (2,188,028 people attended A&E in October 2022).
Despite this, the proportion of patients attending A&E who were admitted, transferred or discharged within four hours remained above last year, at 70.2% compared to 69.5% in October 2022.
Ambulance services answered 858,059 calls to 999, or 27,679 per day, the largest in 2023 so far. They also handled 724,362 incidents, the largest since December 2021.
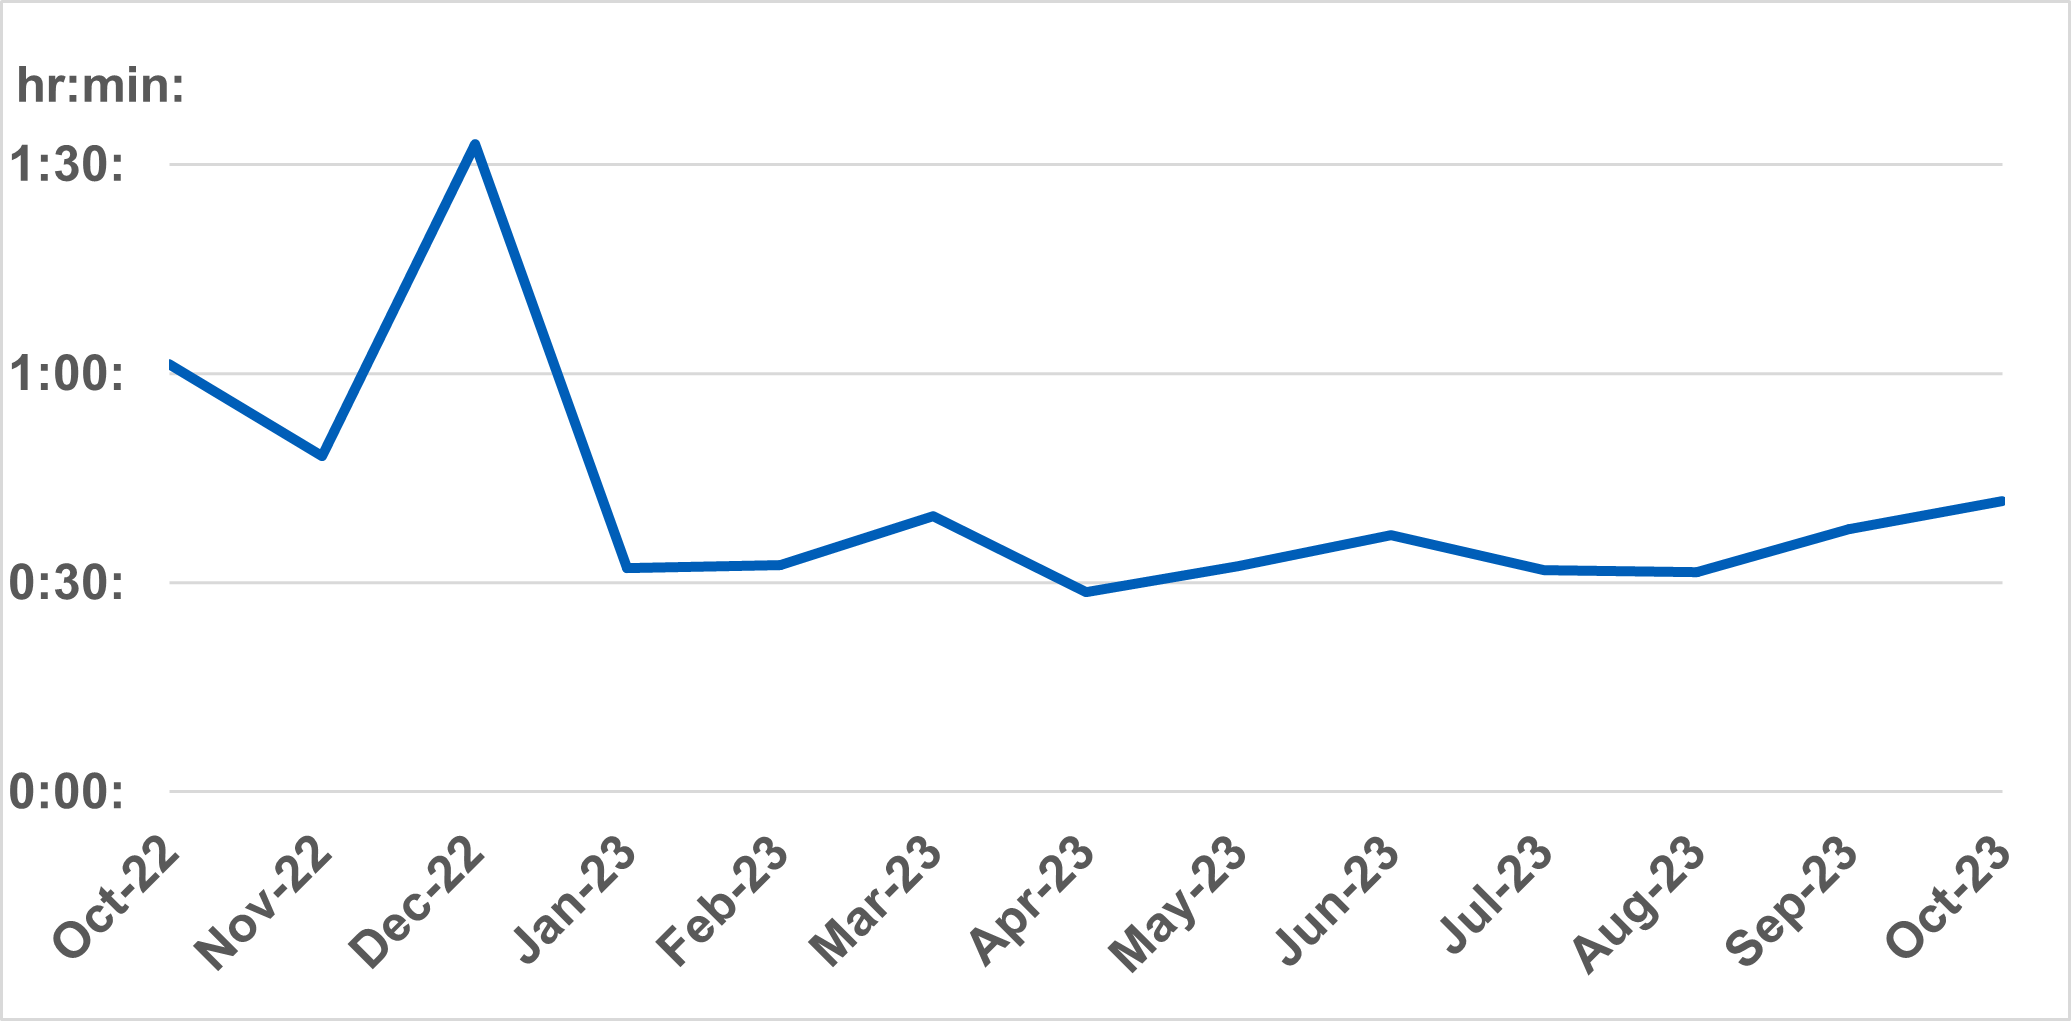
The average response time for a category two call was 41 minutes and 40 seconds. This is 19 minutes and 39 seconds faster compared to the same month last year (the average category two response time for England excluding London was 1:01:19 in October 2022).
Average category 2 response times
We have also been working with systems to develop a new metric that records and measures the time between a patient’s discharge ready date and their actual date of discharge. This month, as per our commitment in the urgent and emergency (UEC) recovery plan, we have published this dataset for the first time.
While this data is currently in development with submissions from 53.3% of trusts meeting the required data quality and compliance, its publication signifies an important step towards a better understanding of why and where discharge delays are occurring. This intel will support collaborative action across the NHS, local government, and social care to improve discharge planning and patient flow.
Data shows, during September, 86.4% of patients with a hospital stay of one night or longer left hospital on their discharge ready date. Of those who stayed in hospital beyond their discharge ready date, 33.1% left hospital one day after their discharge ready date and 6.2% had an extended stay of 21 days or more.
Elective recovery
Industrial action continued to have a significant impact on planned care in September. Two days of joint action meant that since strikes began, the cumulative total of rescheduled acute inpatient and outpatient appointments exceeded one million for the first time.
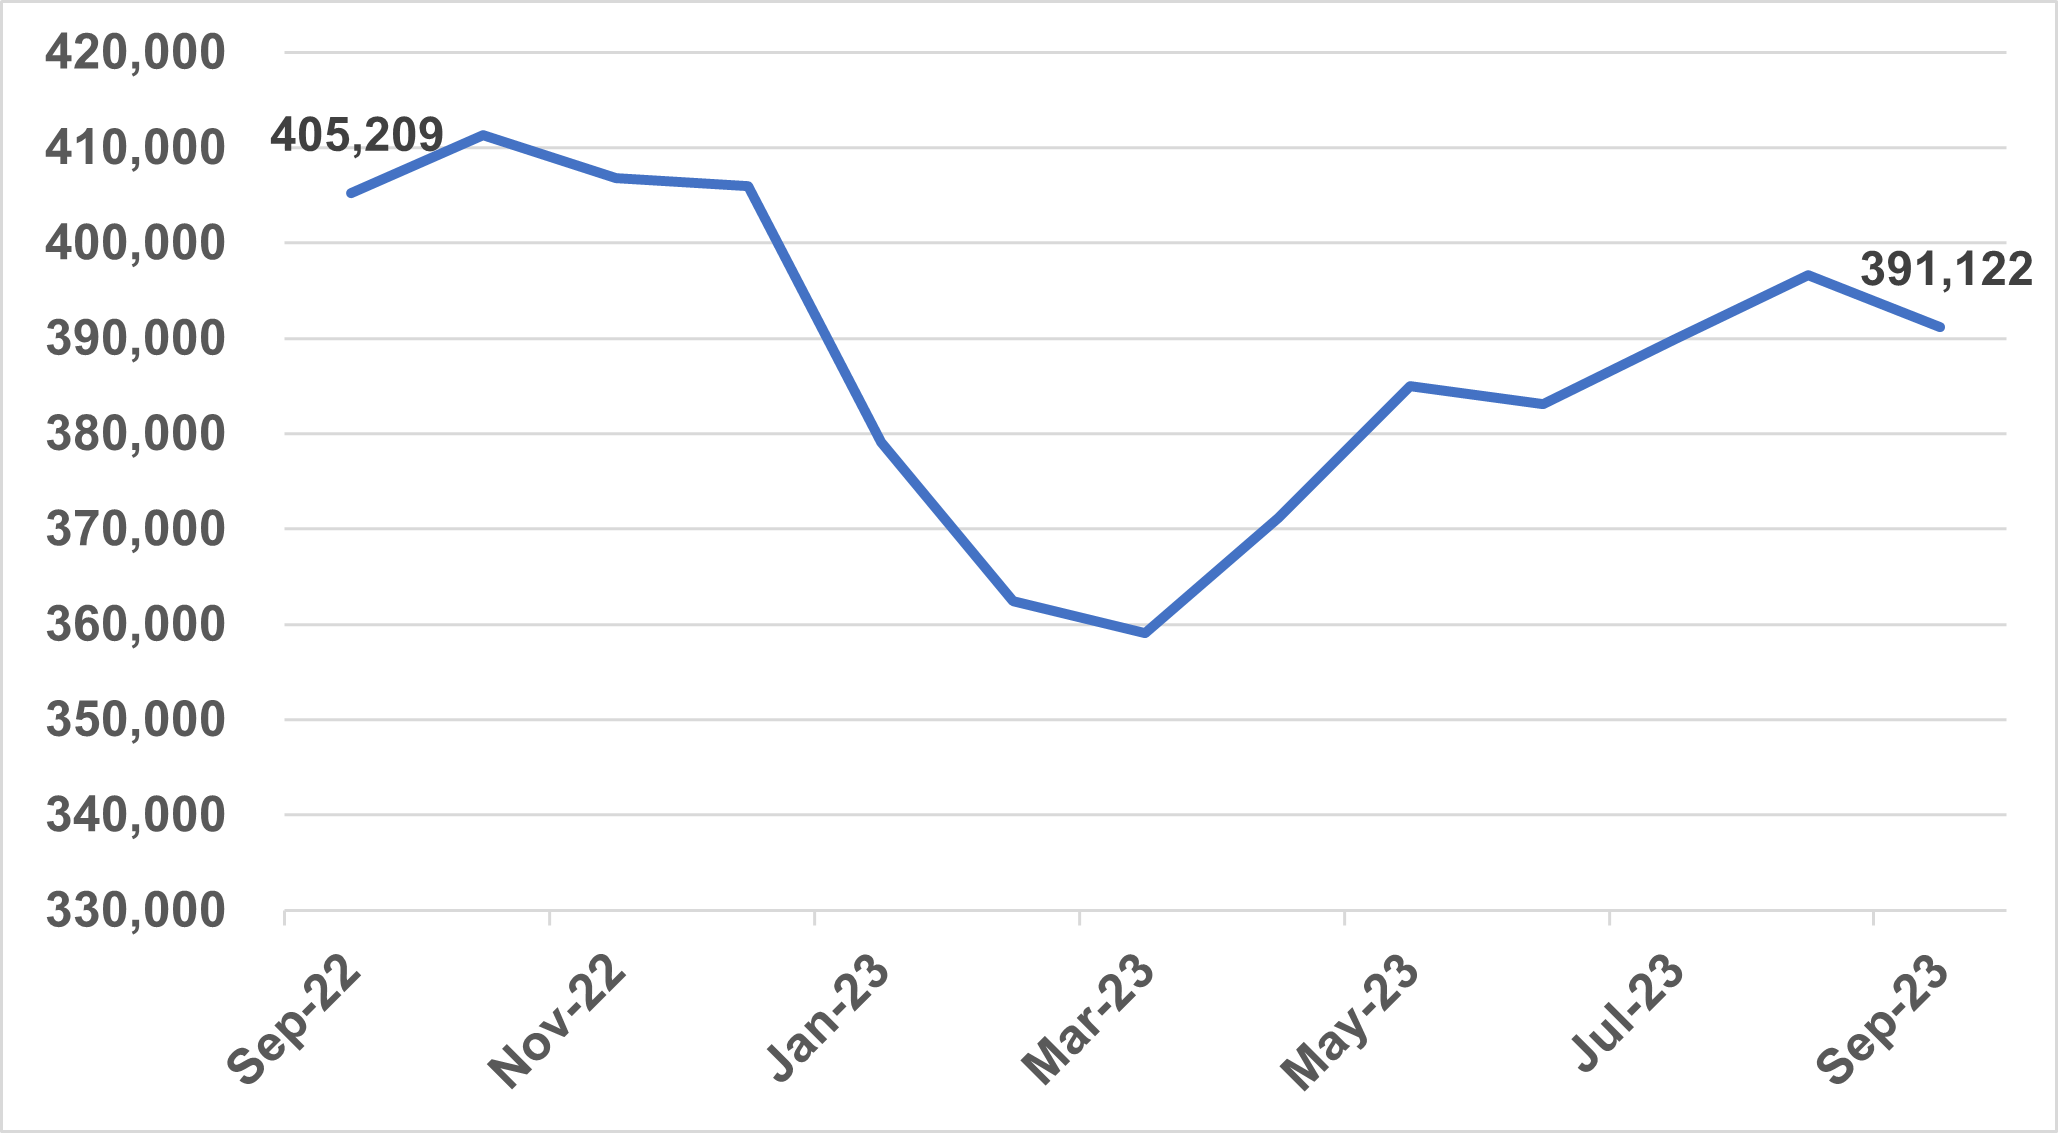
As of the end of September, 391,122 (5%) patients were waiting more than a year for treatment. This is down by more than 5,500 since August 2023.
Referral-to-treatment 52-week waits
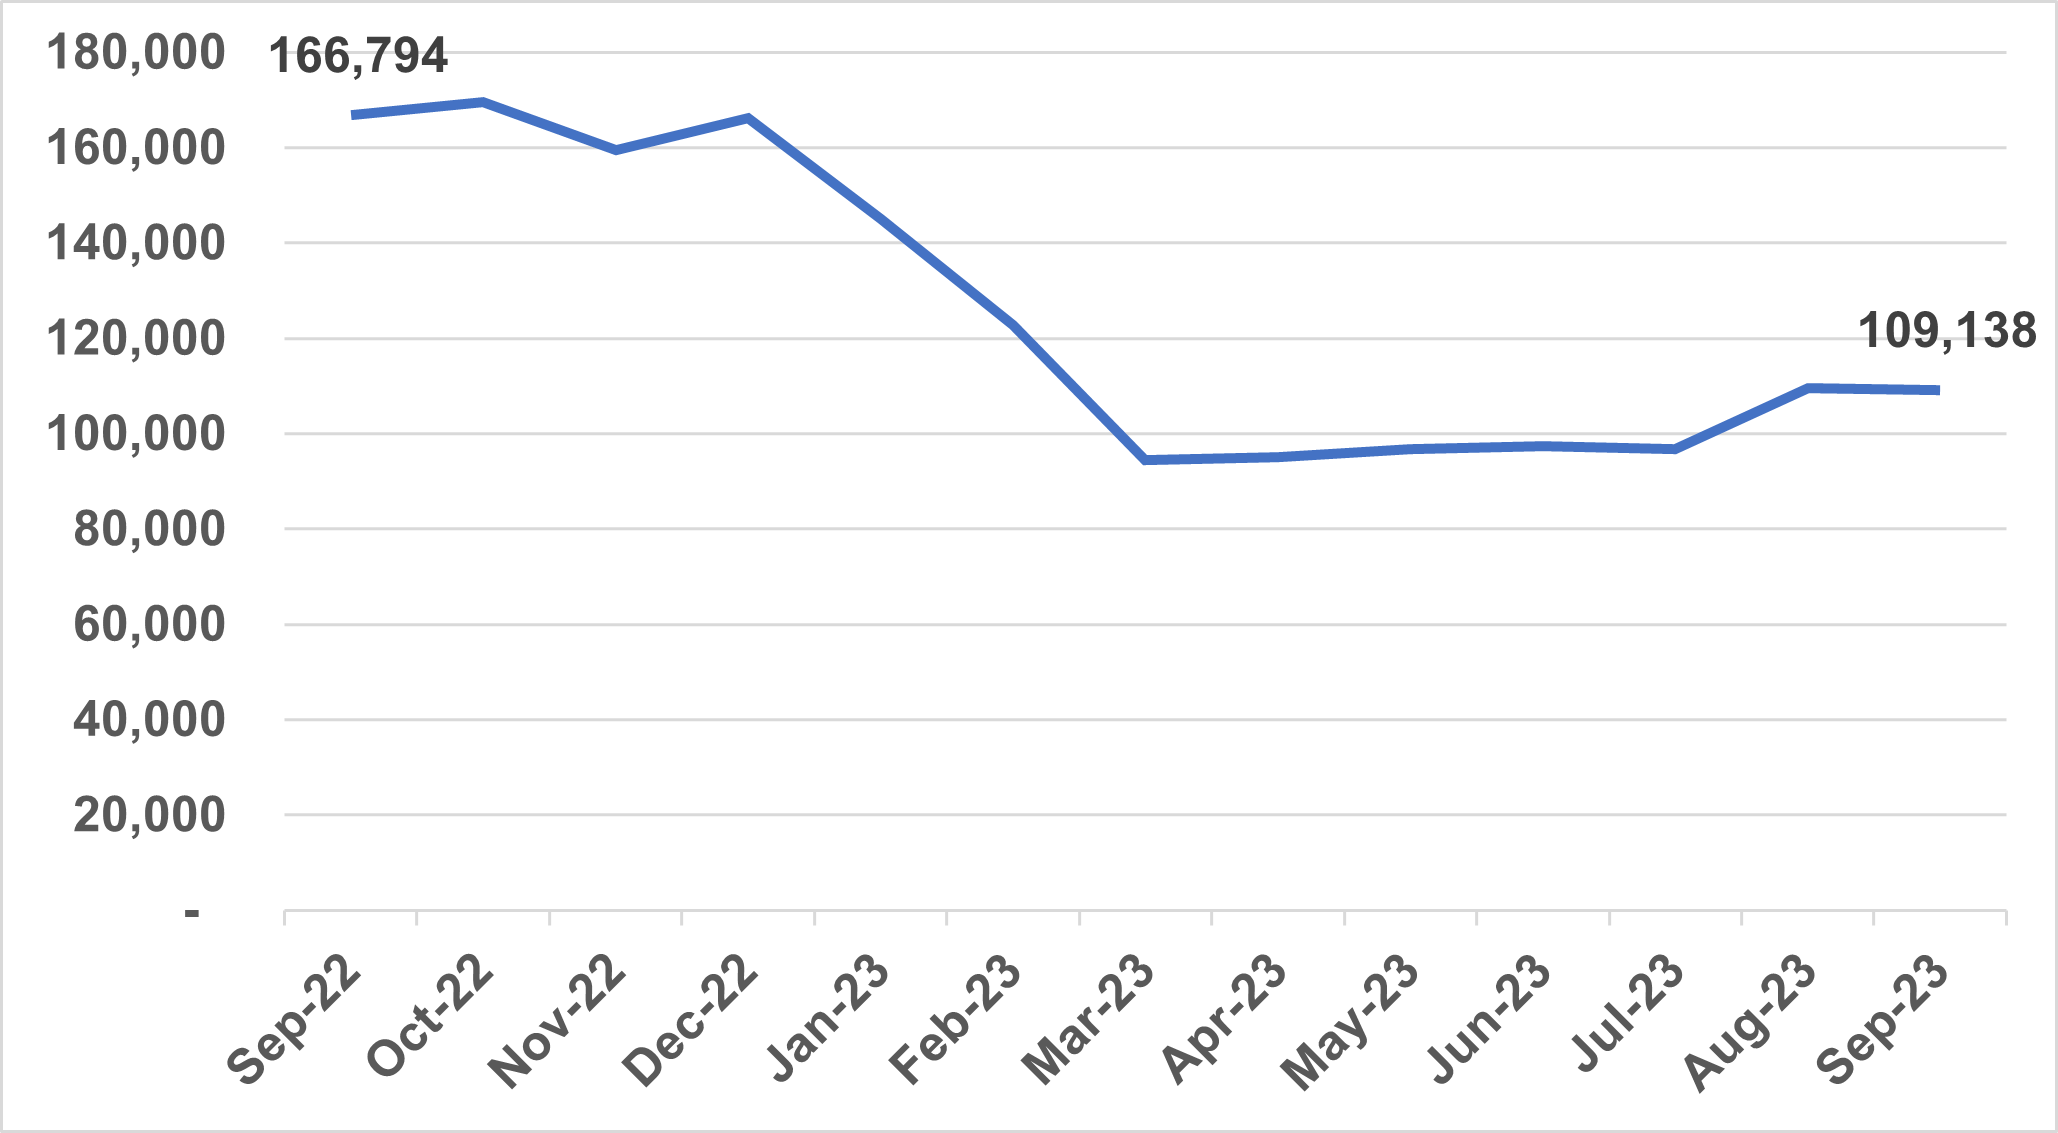
109,138 (1.4%) patients were waiting more than 65 weeks for treatment. This is down by more than a third since September 2022.
Referral-to-treatment 65-week waits
1,446,805 patients started treatment in September, an increase of 5% from the same month last year and an increase of 2% compared to September 2019. Of those, 947,400 started treatment within 18 weeks of referral. This is an increase of 0.3% from the same month last year.
A patient’s waiting time for elective treatment starts when they are referred to a consultant-led service in secondary care – this is known as a clock start.
As a patient moves through an elective pathway, they can also be referred for investigation and treatment for a different condition. In this case, a separate referral to treatment waiting time clock will start.
While there are 7.77 million waits for care, some of these people are waiting to be seen for more than one condition. Data published this month estimates there are 6.5 million unique patients on the elective waiting list, meaning an 83.6% ratio of unique patients to total waits.
Cancer
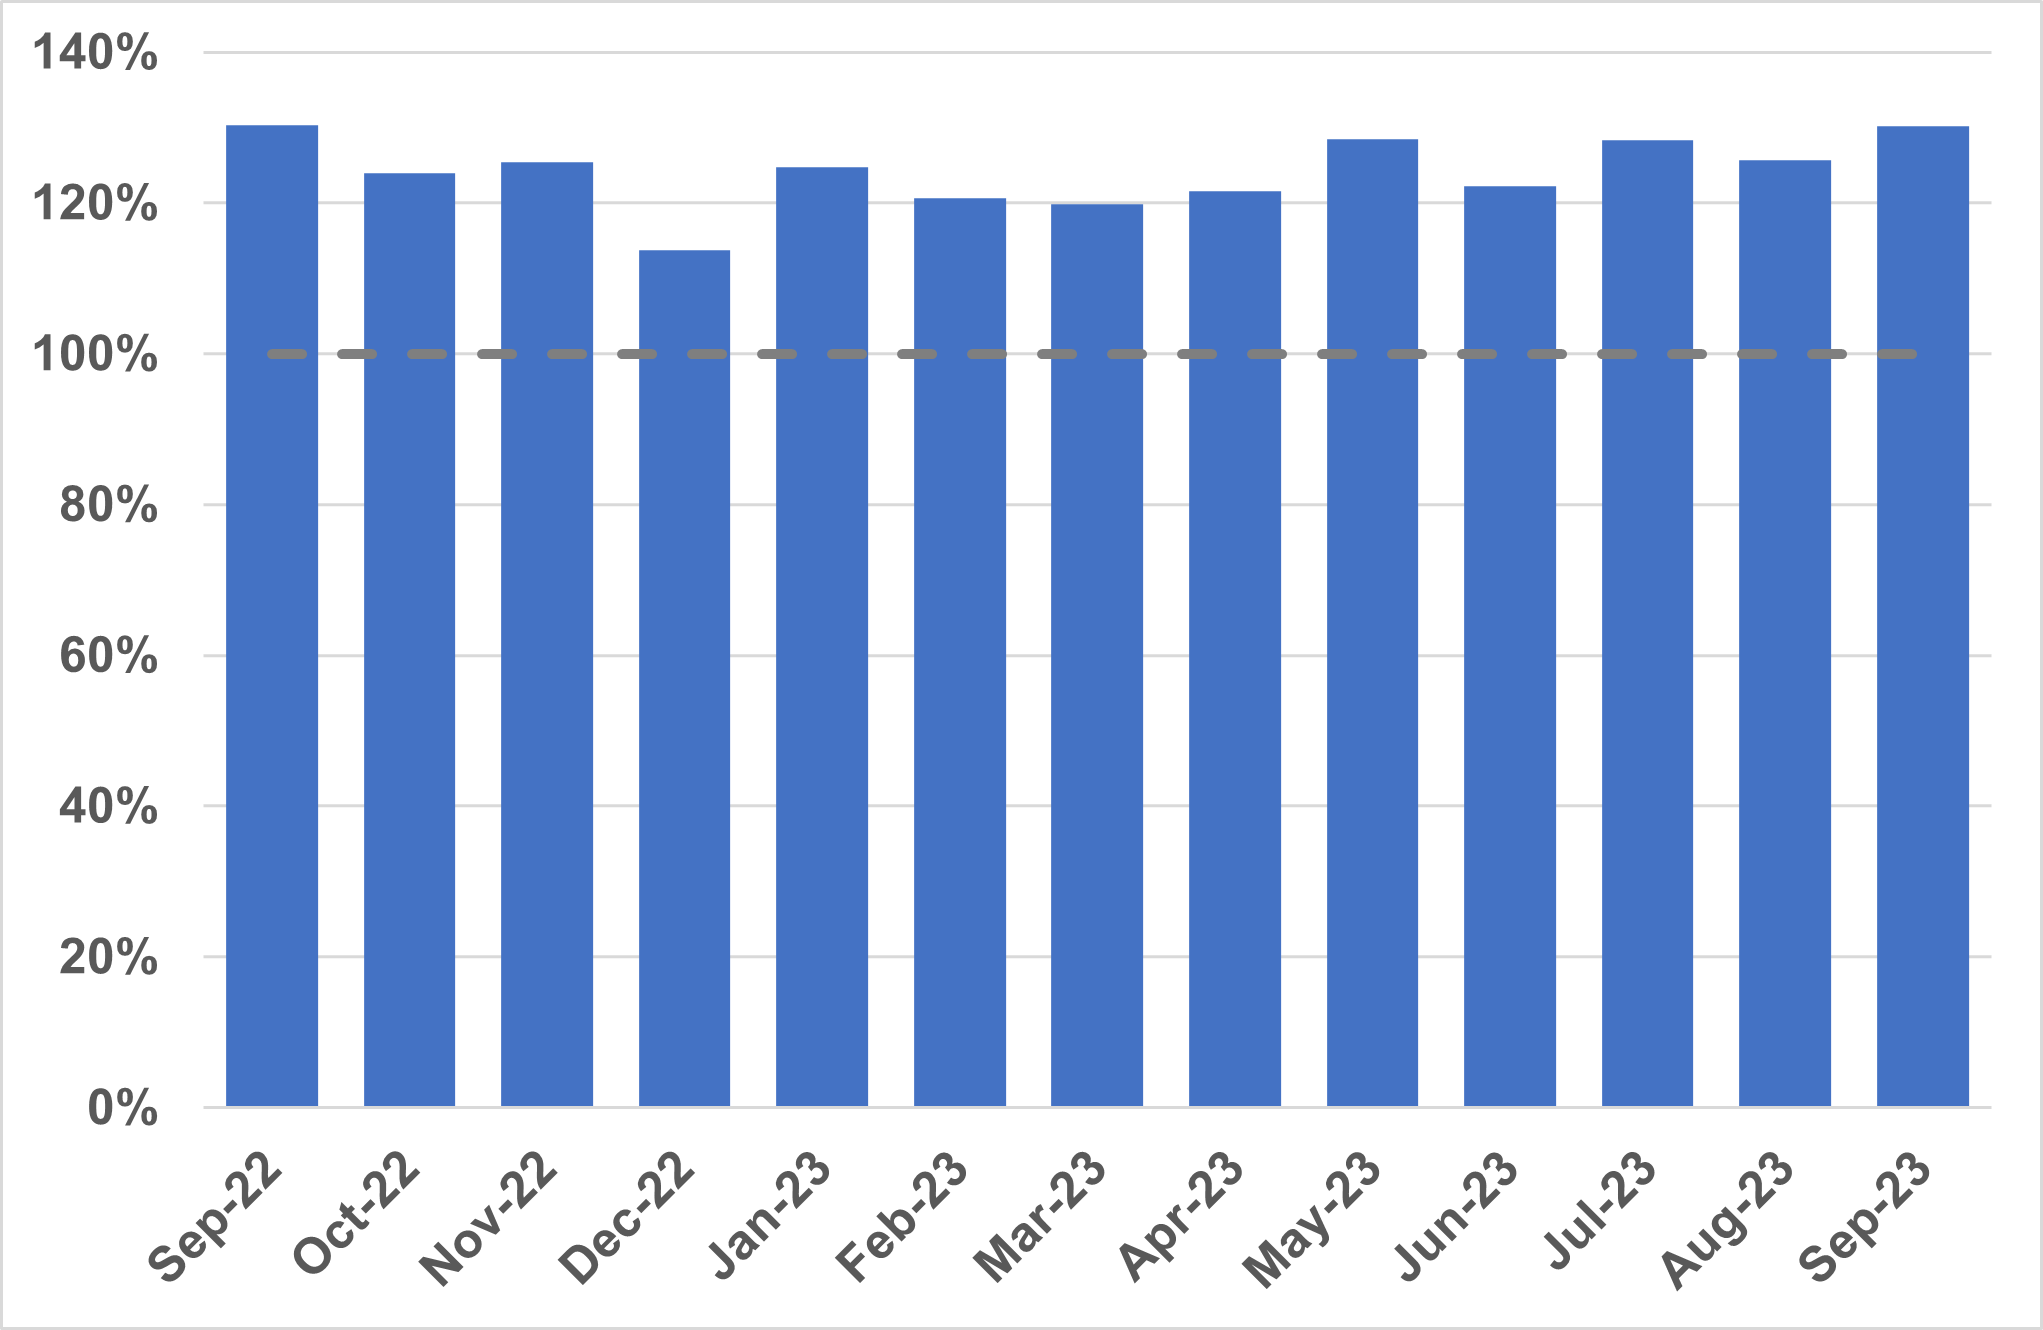
Demand for cancer services continued at record levels in September with the number of urgent suspected cancer referrals at 130% of pre-pandemic levels. To meet high demand, treatment is also at record levels and there has been a reduction in the 62- day cancer backlog as a result.
Urgent suspected cancer referrals first seen
Over 335,000 people received treatment for cancer over the last year between October 2022 and September 2023 – the highest year on record, and up by more than 22,000 on the same period pre-pandemic. GPs have been referring people for urgent cancer checks in record numbers since March 2021. Since then, NHS staff have seen over a million more people than in the same period prior to the pandemic.
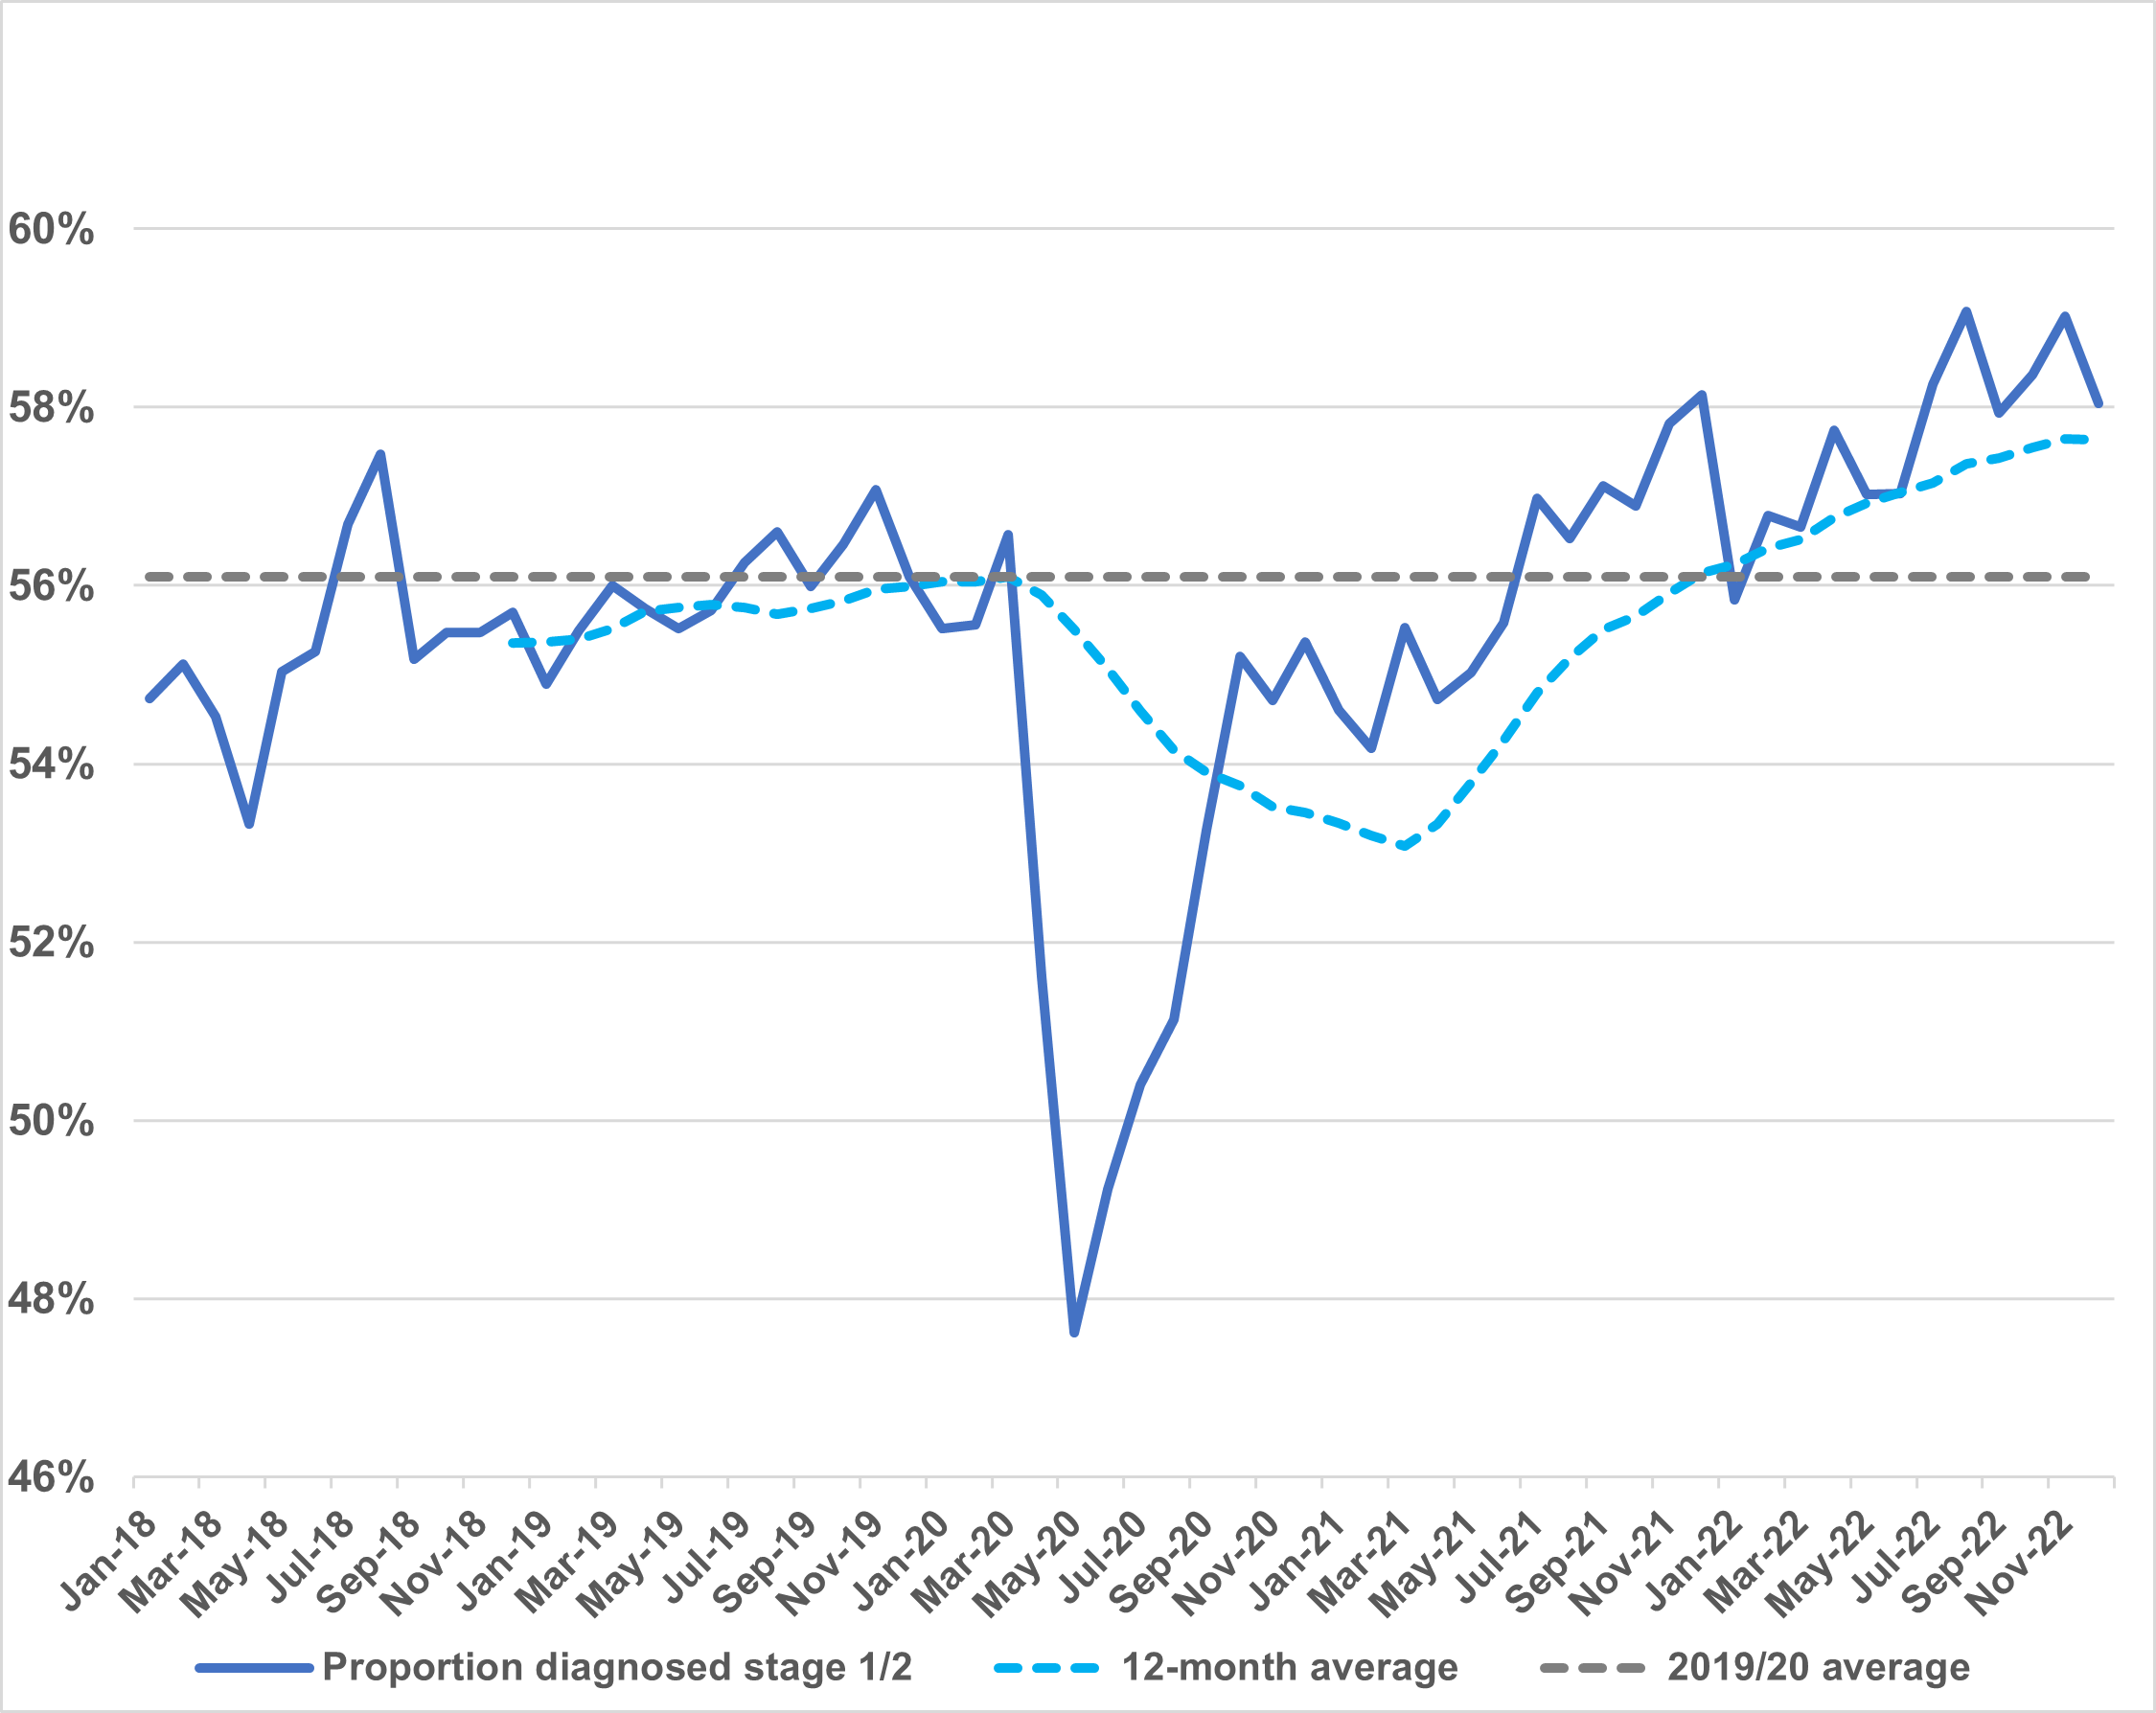
The increase in referrals has contributed to the NHS diagnosing more cancer at an early stage than ever before. We are diagnosing a higher proportion of cancers at an early stage now than ever before – about 2% higher than before the pandemic. Survival is also at an all-time high. In 2023, the Annals of Oncology published findings showing that cancer deaths are around 10% lower in the UK compared to just 5 years ago.
Cancer early diagnosis rate across England
The NHS is working hard to keep up with this increase in demand. It has been accelerating the installation of new diagnostic capacity, much of it in community diagnostic centres. The backlog has already reduced by 14,000 people since its peak last summer, and despite the recent seasonal increase, NHS staff remain focused on ensuring that people who have been waiting longest or who need care most urgently are seen first.
Learning disabilities and autism
The NHS has made progress in reducing the number of people with a learning disability and autistic people in inpatient mental health settings.
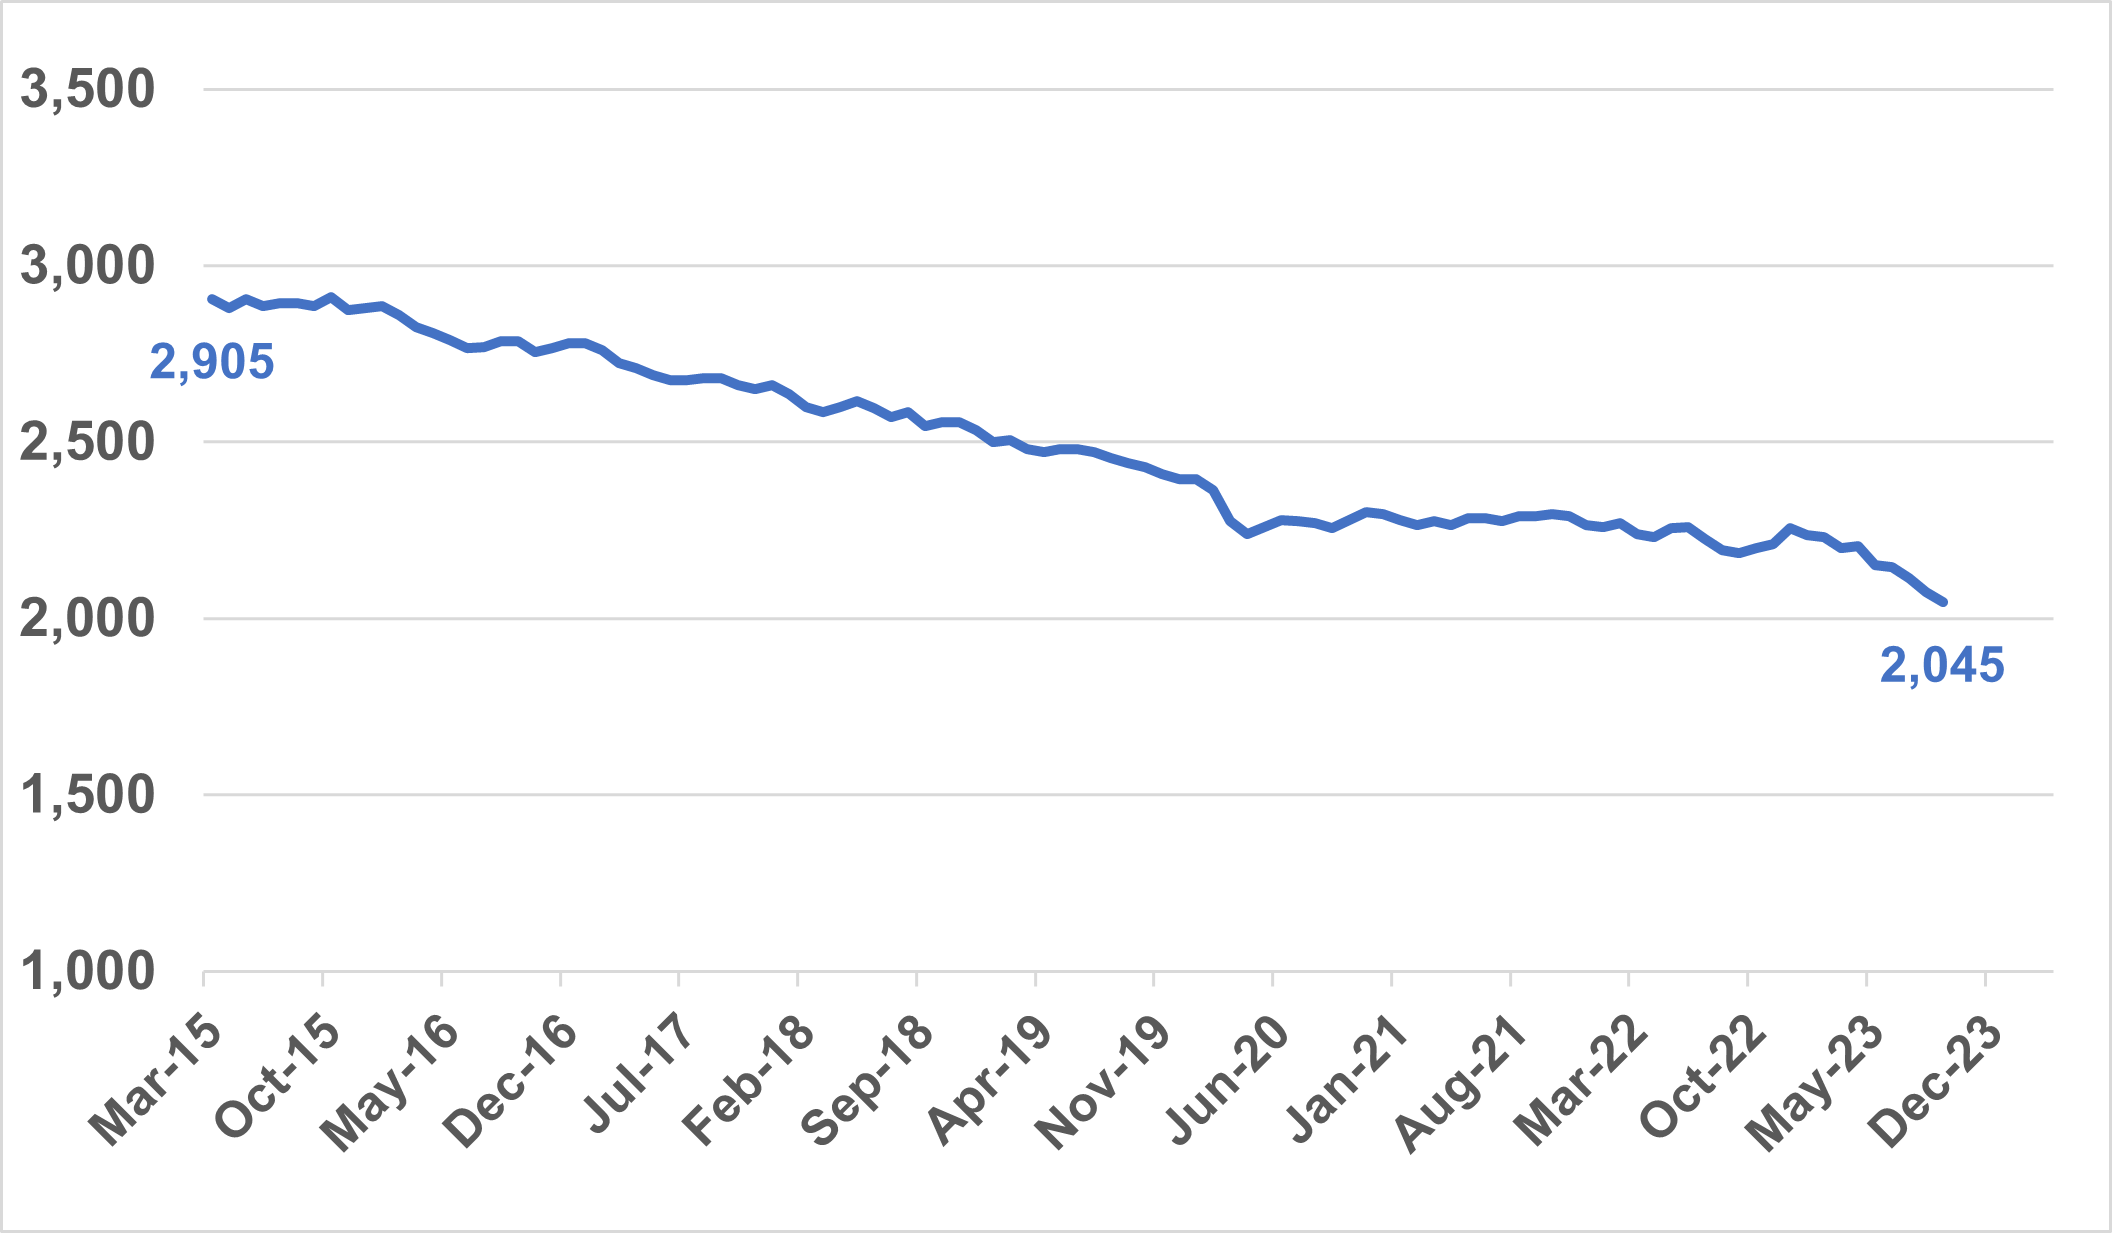
There are currently 2,045 people with a learning disability and autistic people in a mental health inpatient setting, compared to 2,905 in March 2015. This represents a decrease of almost 30% against a commitment to reduce inpatient numbers by 50% by March 2024.
Total people with a learning disability, autism or both (adults and under 18s) in hospital
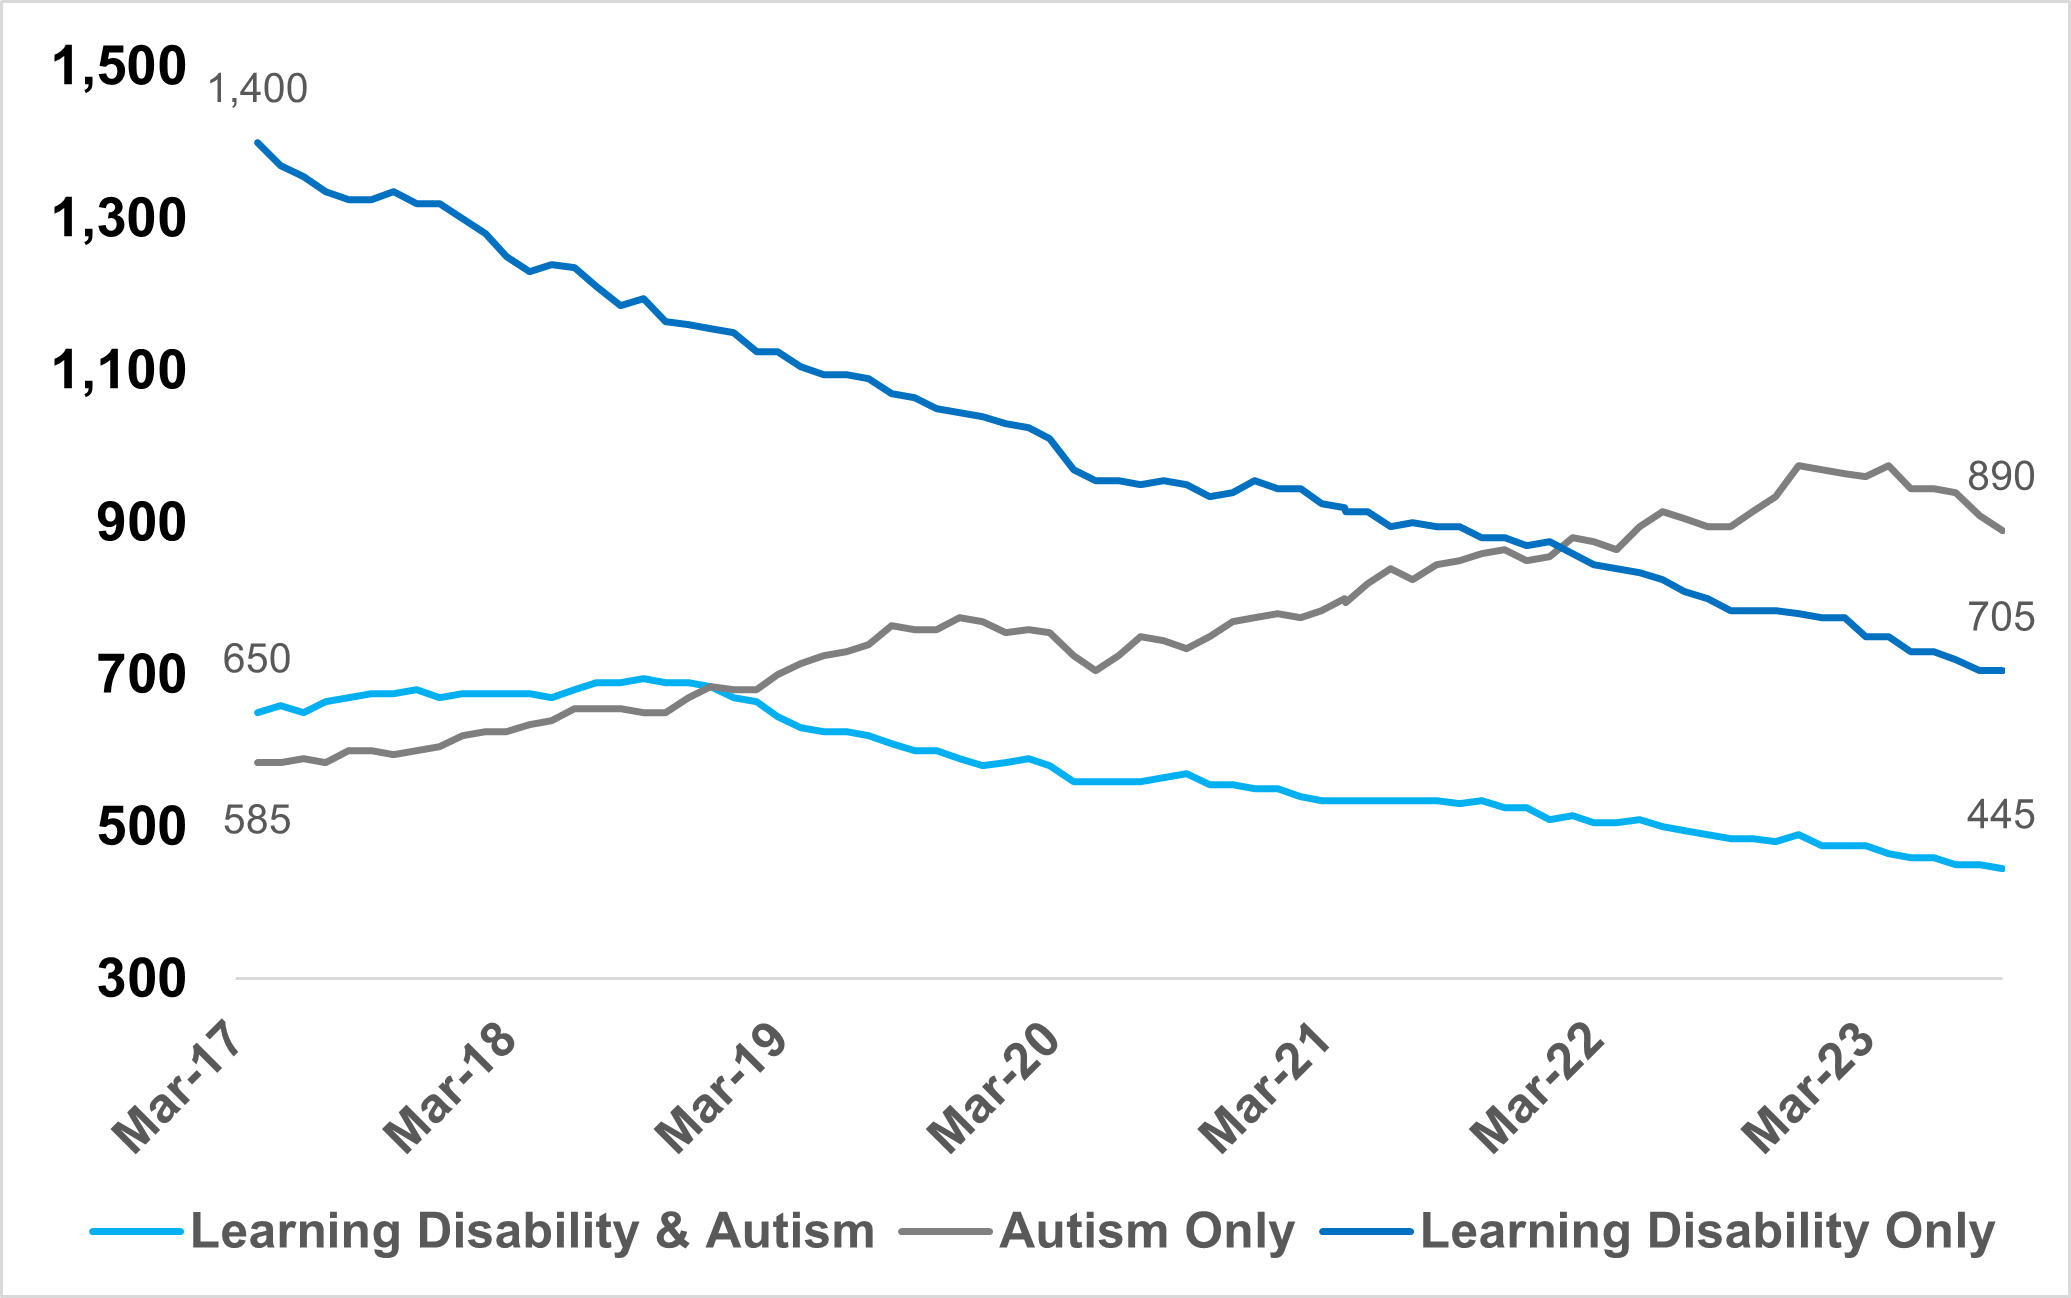
There is a significant difference in the trend in the number of inpatients with a learning disability to the number of autistic patients. For people who have a learning disability and who do not have an autism diagnosis, there has been a 57% reduction in the number of people in hospital since March 2015.
For people who have a learning disability and also have an autism diagnosis, there has been a 33% reduction in the number of people in hospital since March 2015. The number of people with an autism diagnosis in hospital inpatient settings has increased significantly over the same period.
Trends for different groups of people in hospital since March 2017
There are a number of factors behind the increase of people in mental health inpatient services with a diagnosis of autism. Both referrals to autism assessment services and the number of people who receive a diagnosis of autism are increasing rapidly, and more autistic people are being diagnosed during their stay in a mental health hospital. People who are autistic have a higher prevalence of mental ill health compared to the general population and many of these admissions may represent the most appropriate care for people who need mental health care in hospital.
The NHS is committed to ensuring that autistic people in mental health settings receive the right care and support.