
Executive summary
This briefing draws on official statistics published here.
- 72% of patients attending A&E were admitted, transferred or discharged within four hours, which is below the NHS constitutional standard of 95%. This is down from 76.3% in August 2024 but higher than 71.7% in September 2023.
- The average ambulance response time for category 2 calls was 36 minutes and 2 seconds. This has increased from August 2024 and is above the 30 minute target for the year and the NHS constitutional standard of 18 minutes.
- As of the end of August, on the total waiting list there were 6 million waits for procedures and appointments and an estimated 6.3 million people waiting for care. The total waiting list is 100,000 lower compared to August 2023.
- At the end of August, on the diagnostic waiting list there were 1.55 million waits, of which 373,126 had waited 6 weeks or more. The percentage of 6 week waits was 23.9%, down from 27.5% in August 2023.
- Levels of Urgent Suspected Cancer referrals have remained high, with 11,888 patients seen per working day in August 2024. This is 25% more referrals than the NHS was seeing before the pandemic – the equivalent of 2,000 more patients per working day.
- In August, performance against the 62 day Urgent Referral to First Treatment Standard was 69.2%, which was 3.3% higher than at the same point last year, but still well below where we want to see it. The NHS has set the ambition to improve this to 70% to March 2025, as a first step in recovering performance to the 85% standard.
- The Mental Health Services Dataset shows that between June 2024 to August 2024, 7.6 people per 100,000 population in England aged between 18-64 were discharged with a length of stay of 60 days or more. During the same period there were 7.5 people per 100,000 population in England aged 65 or over, discharged with a length of stay of 90 days or more. The current threshold for both metrics is 8 people per 100,000 population, so both are being met during the period June 2024 to August 2024.
Urgent and emergency care
Demand rose for urgent and emergency care (UEC) services in September.
There were a total of 2,214,217 attendances at A&E departments across England in September. The average daily attendances increased to 73,807, this is 5.9% higher than August’s daily average and 2.0% higher than September 2023.
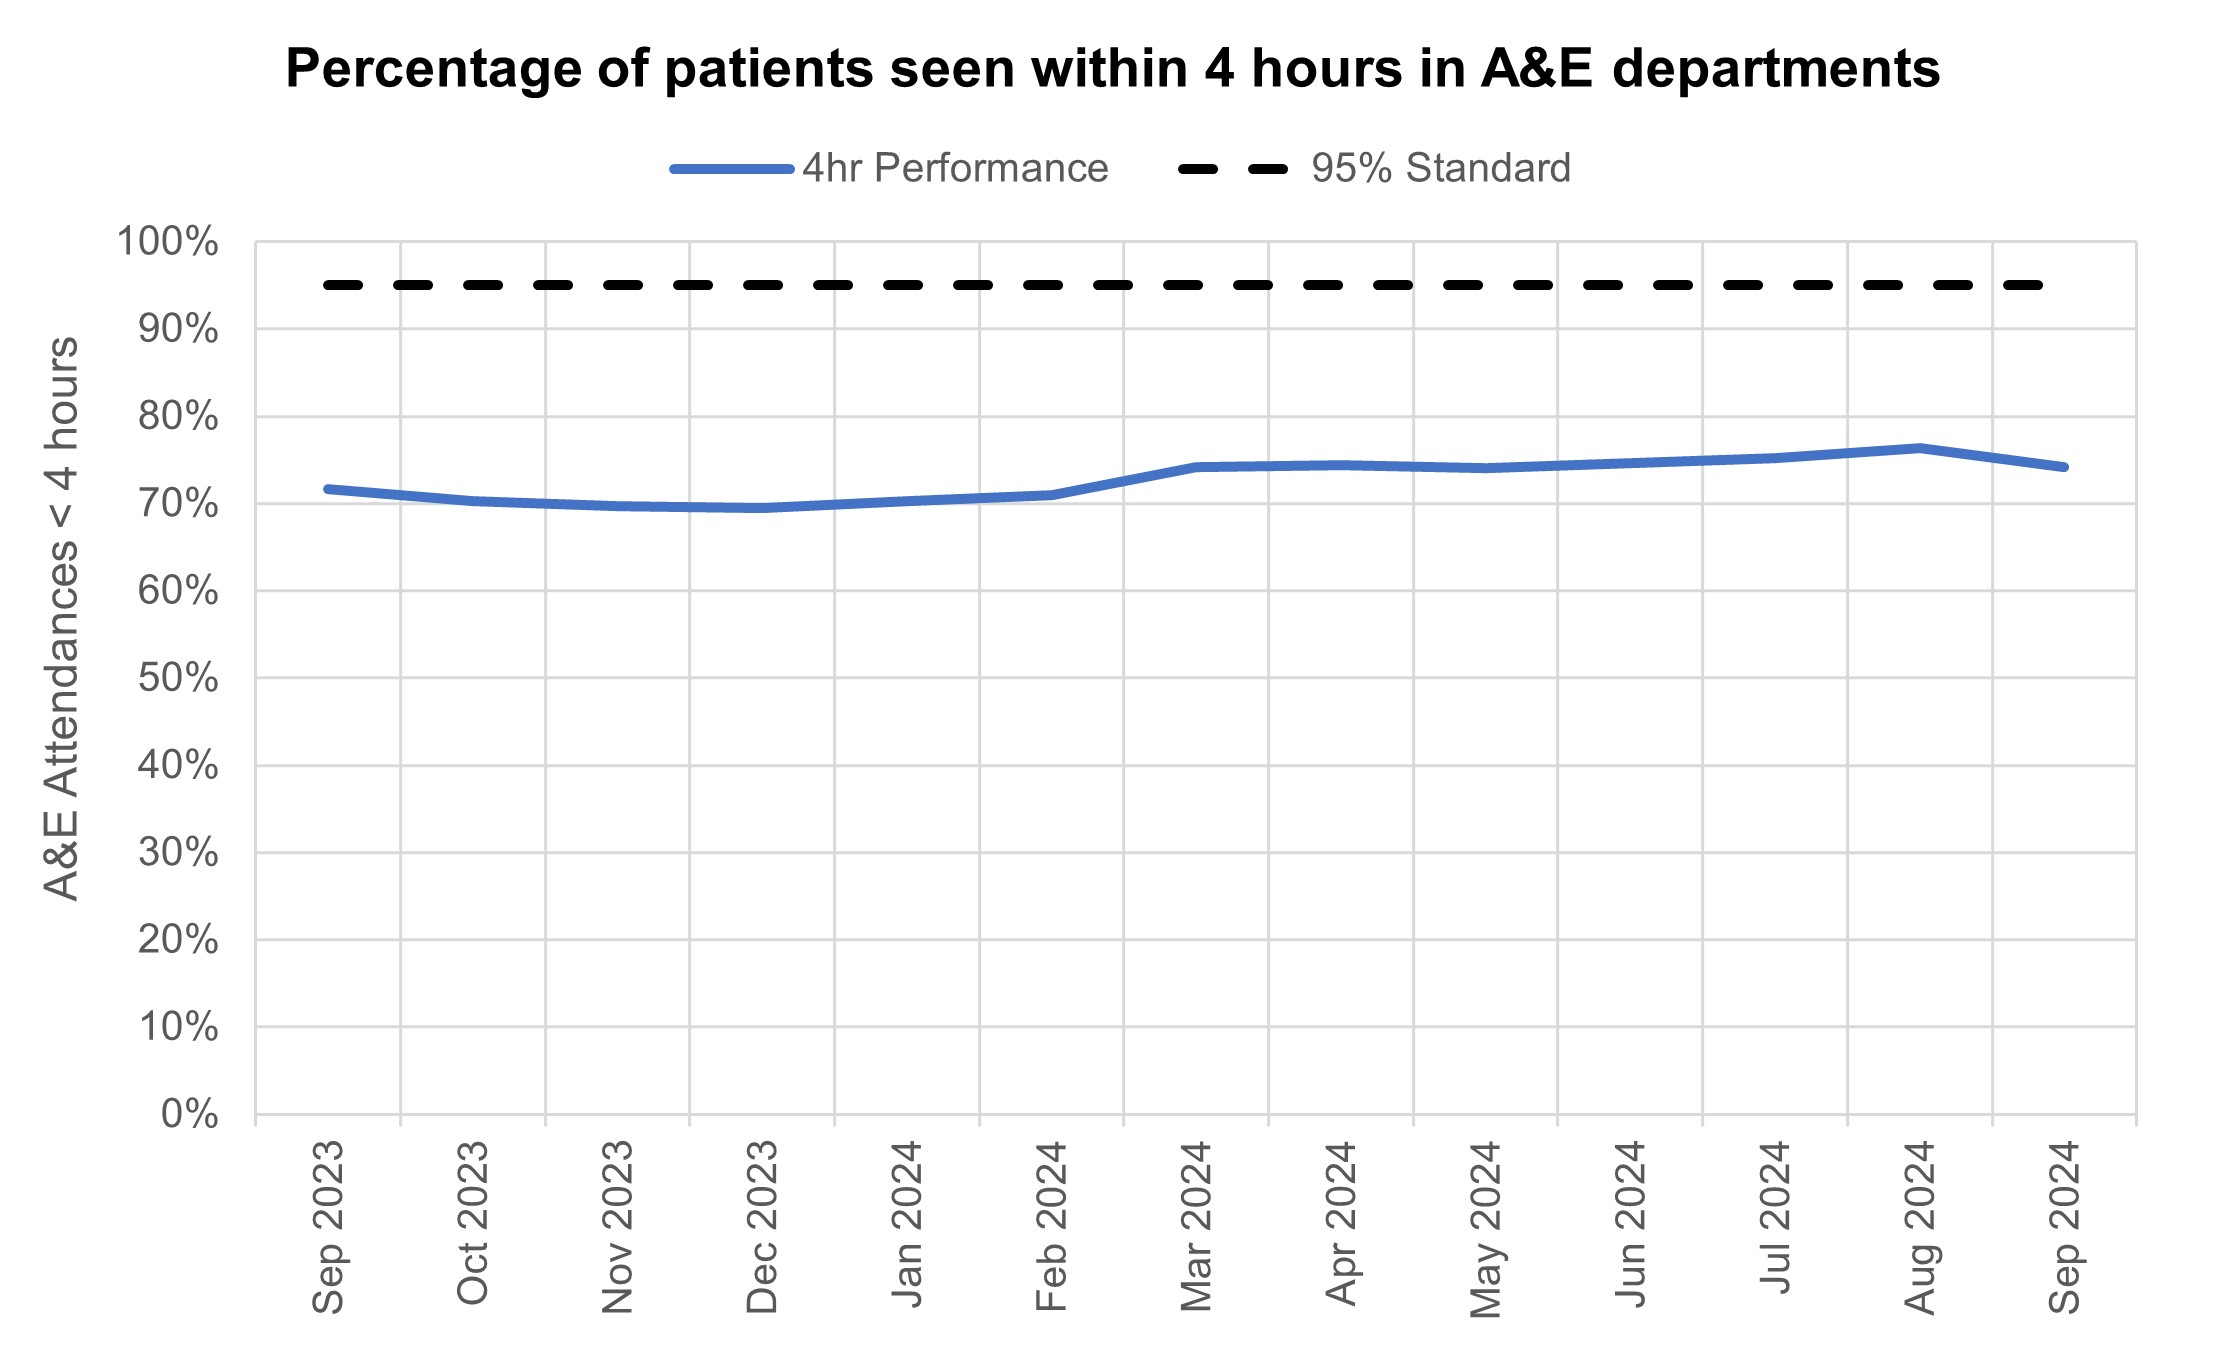
74.2% of patients attending A&E were admitted, transferred or discharged within four hours, which is below the NHS constitutional standard of 95%. This is down from 76.3% in August 2024 but higher than 71.7% in September 2023.
The provisional figures published for September indicate that 9.7% of patients attending a type 1 A&E department spent 12 hours from arrival in A&E. This is up from the finalised figure of 8.5% last month.
Percentage of patients seen within four hours in A&E departments
Ambulance services answered 798,618 calls to 999, or 26,621 per day, a decrease of 3% compared to September 2023 and 9% more than August 2024. There were 363,350 incidents where a patient was conveyed to A&E, 1% more than in September 2023.
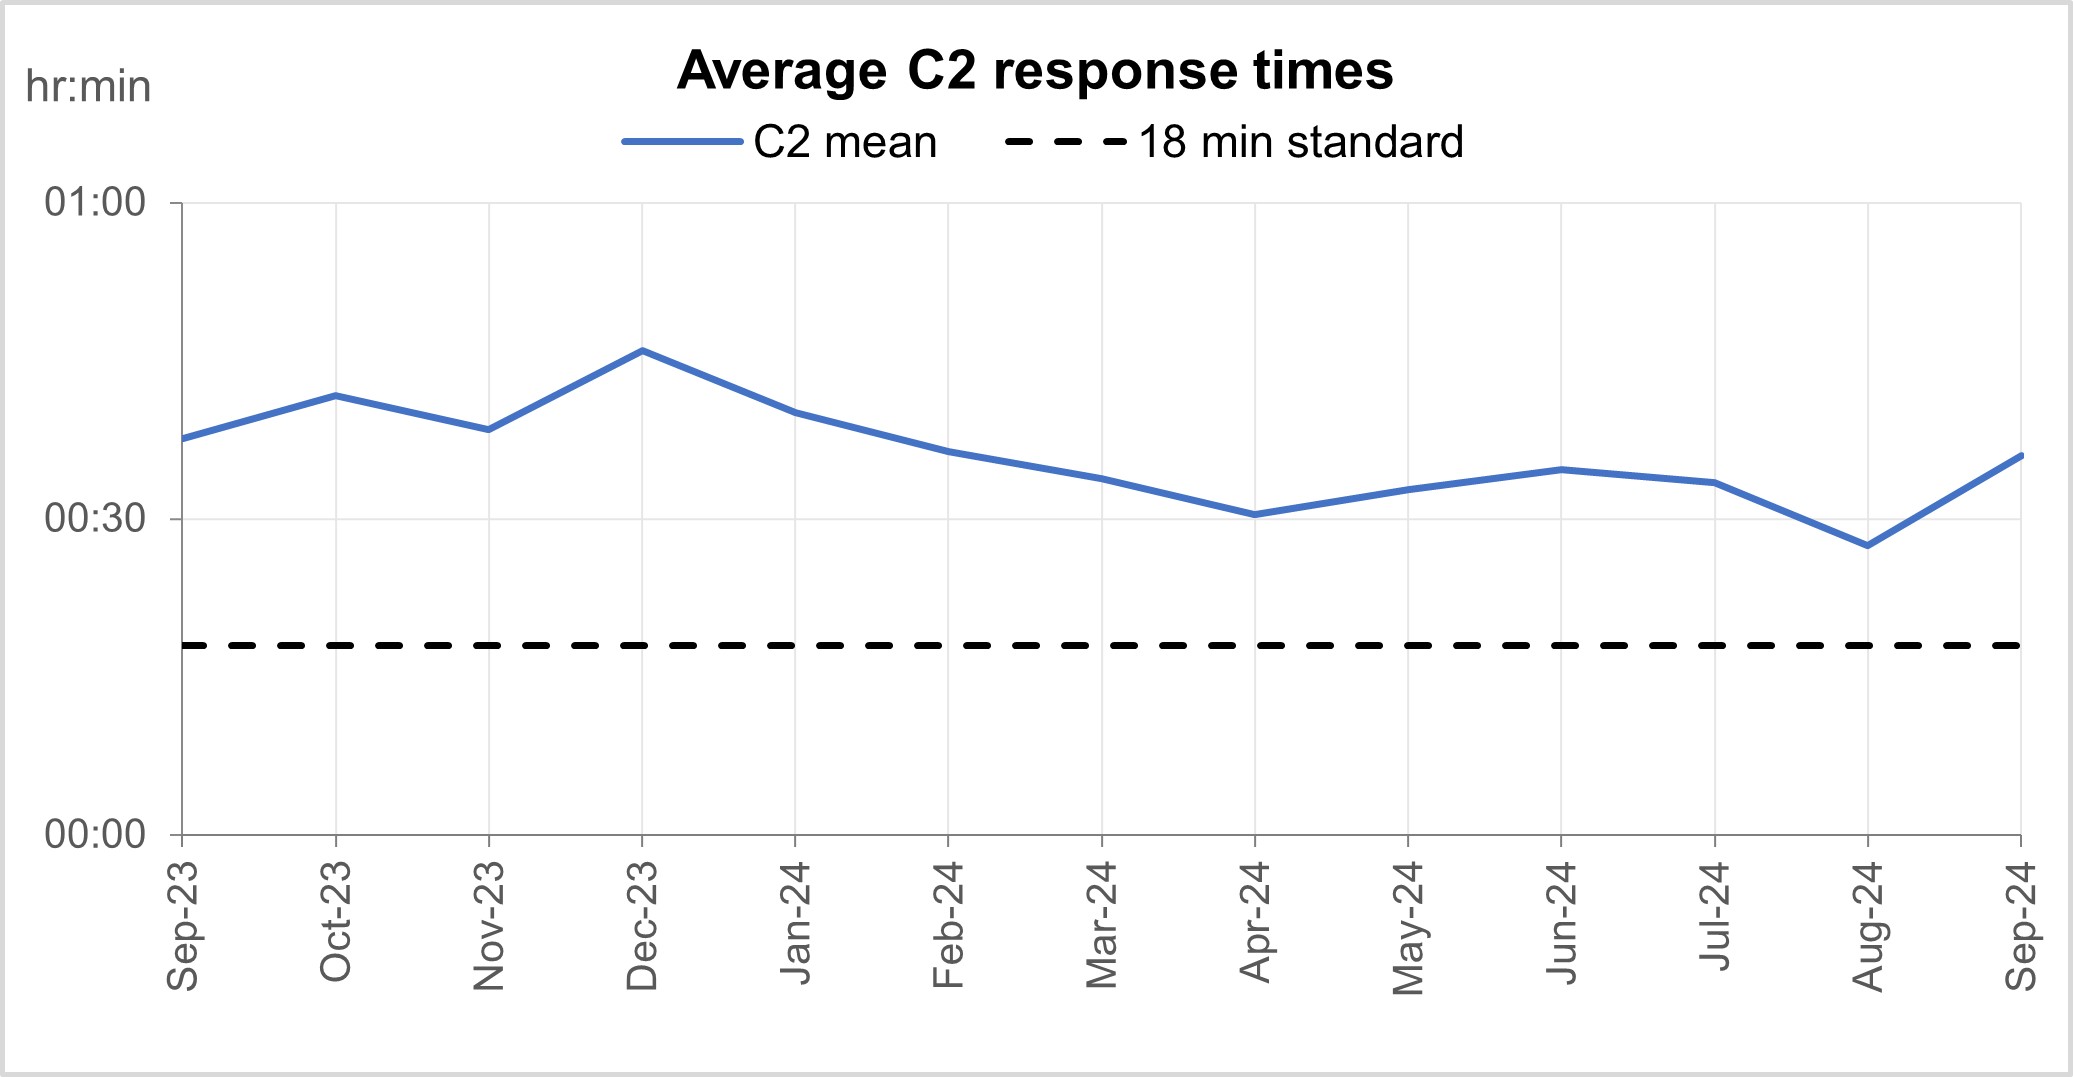
The average ambulance response time for category 2 calls was 36 minutes and 02 seconds. This has increased from August 2024 and is above the 30 minute target for the year and the NHS constitutional standard of 18 minutes.
NHS England are continuing to publish average C2 response times by ICB each month, updating the spreadsheet with data for 2024/25 so far that they published for the first time in August 2024.
Average category 2 response times
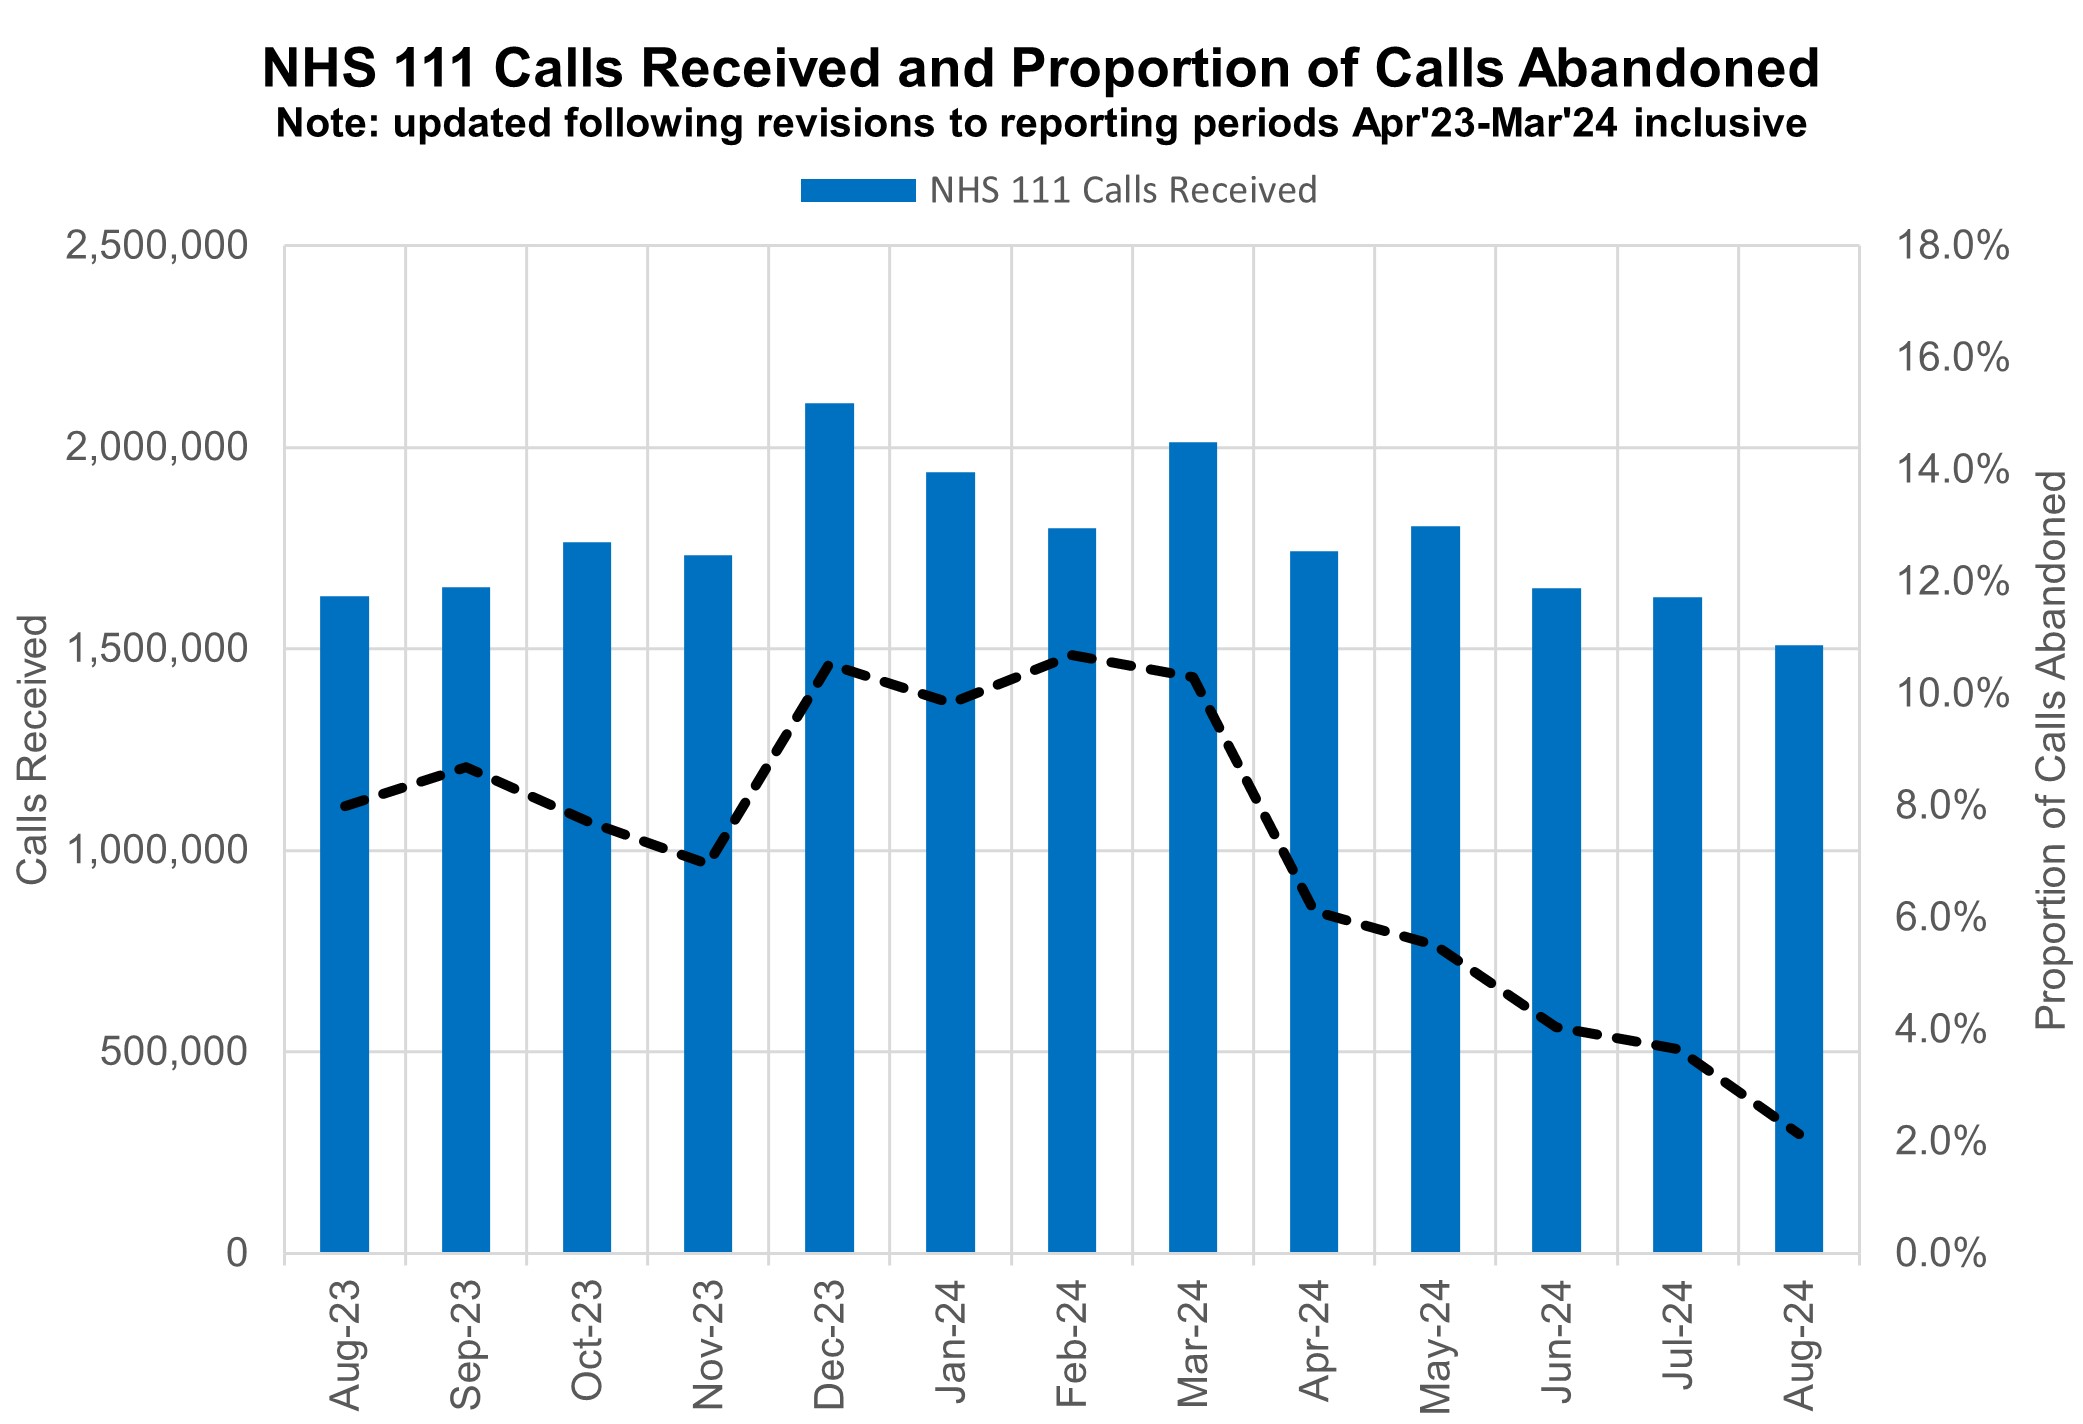
NHS 111 received 1.5 million calls (c. 48.7 thousand per day) in August 2024. Demand was 7.4% down year on year and 7.2% below volumes received in July 2024.
The proportion of calls abandoned dropped 1.5% percentage points from the previous month (now at 2.1%) and the average speed to answer reduced by 22 seconds to 38.
NHS 111 calls received and proportion of calls abandoned
There has been a change in how the data is collected for the acute discharge sitrep. This is the fourth month of using the new data collection system and not all organisations have been able to submit, there will be a decrease in the data volumes for bed numbers.
Elective recovery
As of the end of August, on the total waiting list there were 7.64 million waits for procedures and appointments and an estimated 6.42 million people waiting for care. The total waiting list is 100,000 lower compared to August 2023. The NHS constitution standard states that patients have a right to start consultant-led treatment within a maximum of 18 weeks from referral for non-urgent conditions.
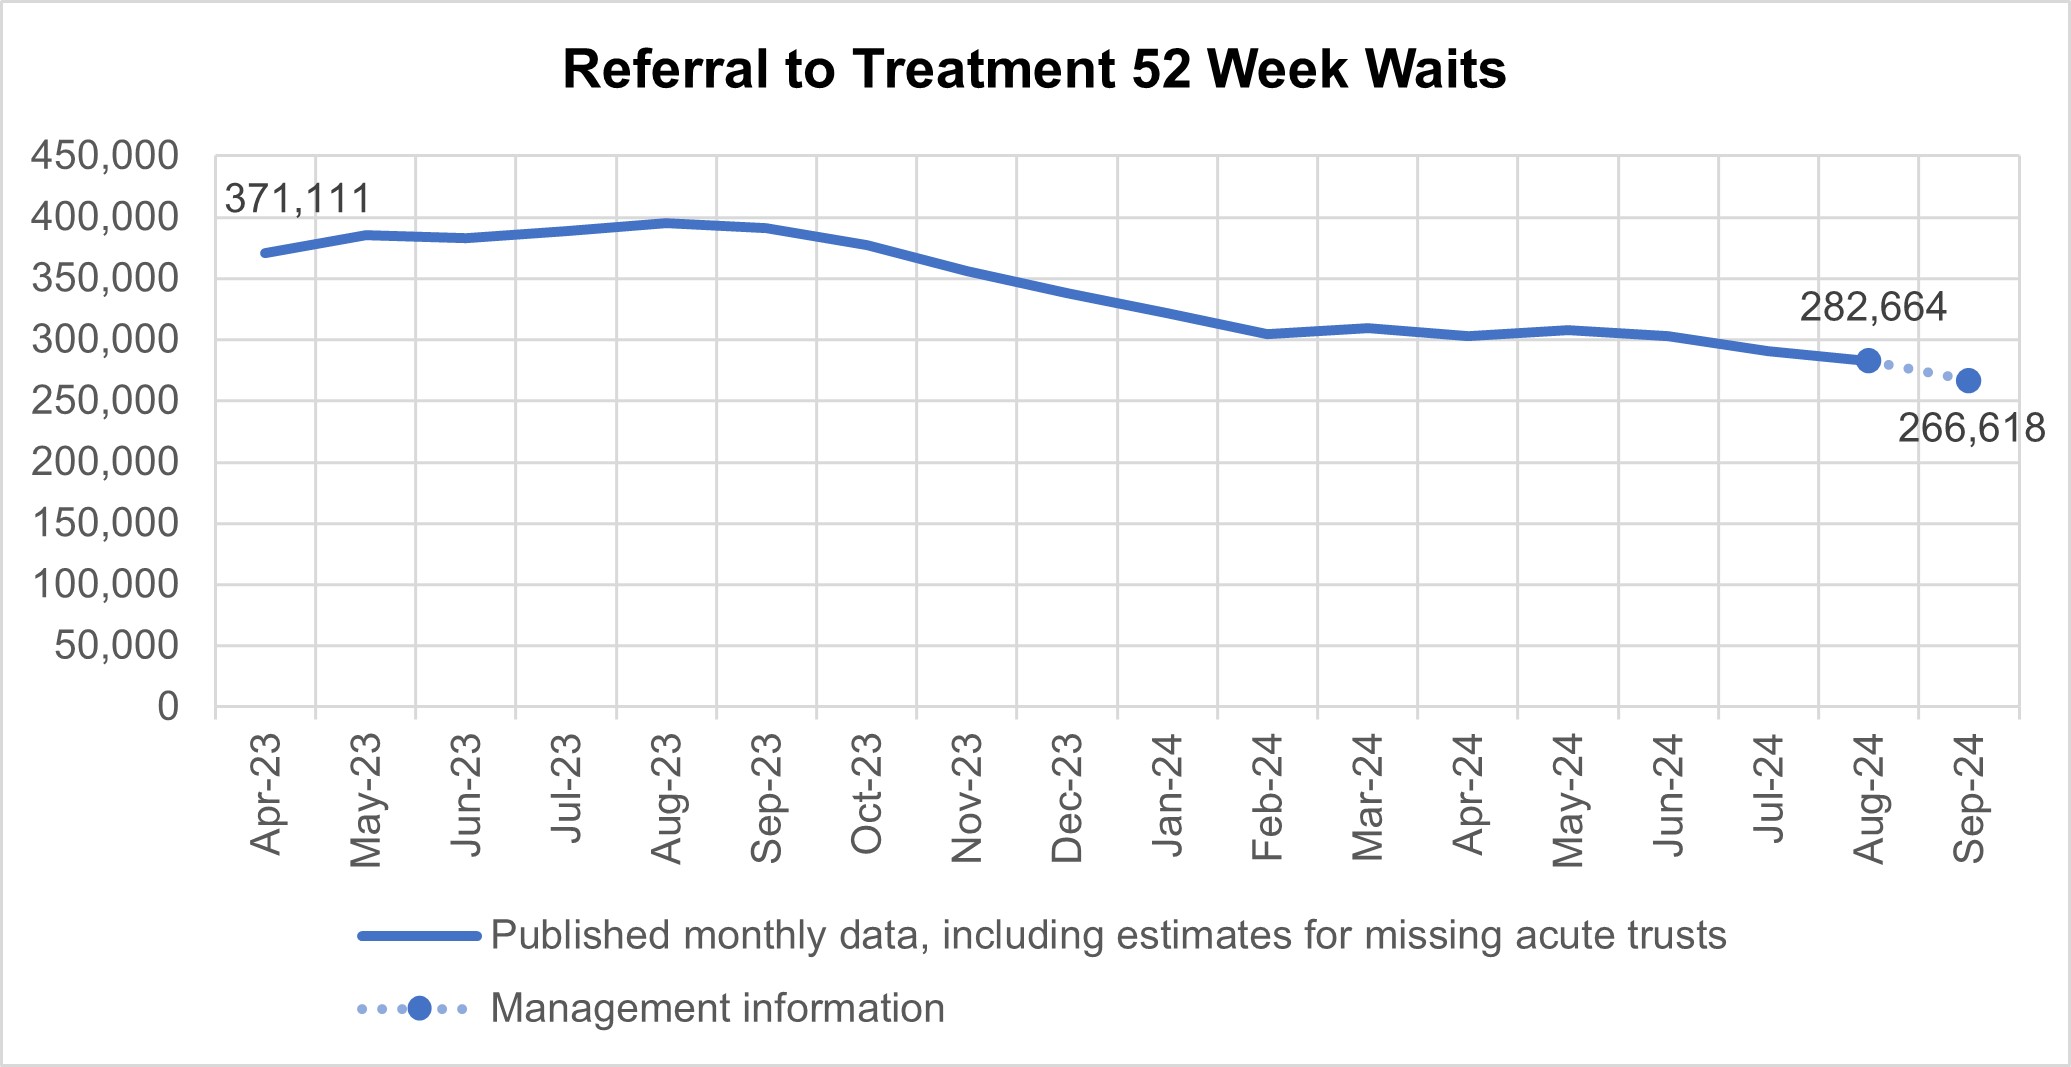
282,664 patients experienced waits of more than 52 weeks for treatment at the end of August, compared to 395,170 at the end of August 2023 (down 28.4%). Additional management data1 suggests that 266,618 patients were waiting more than 52 weeks as of the end of September.
Referral to treatment 52 week waits
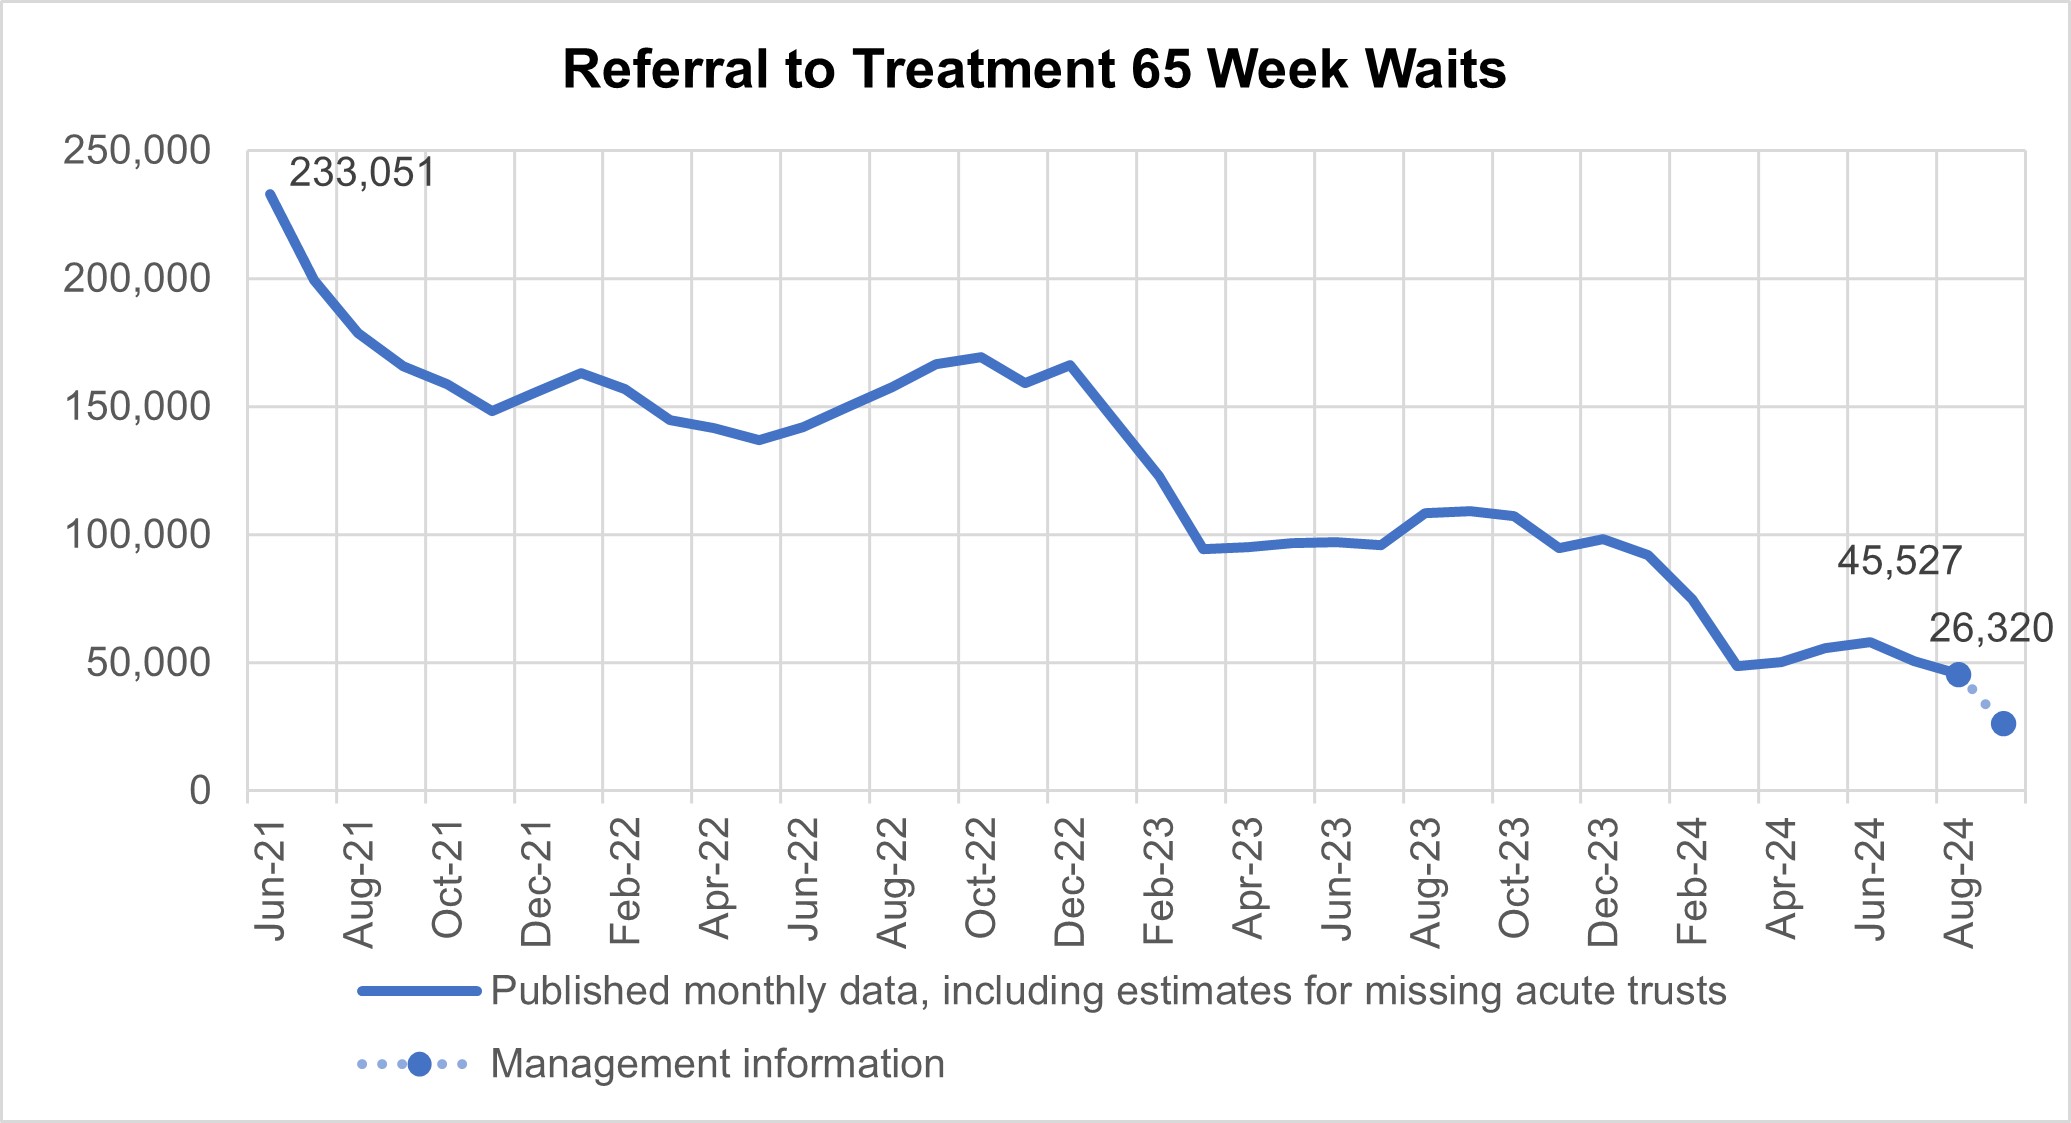
The number of patients waiting more than 65 weeks for treatment was 45,527 at the end of August, compared to 108,679 at the end of August 2023 (down 58.1%). Additional management data* suggests this number has decreased to 26,320 patients waiting more than 65 weeks for treatment as of the end of September.
*Management information for the latest month is taken from the Waiting List Minimum Dataset (WLMDS). Figures include data up to week ending 29 Sep 24. WLMDS data is subject to less validation than the published monthly figures. 133 of 135 acute trusts submitted data for week ending 29 Sep 24 – the figures for this latest week have been adjusted to include the latest available data for the missing acute trusts.
Referral to treatment 65 week waits
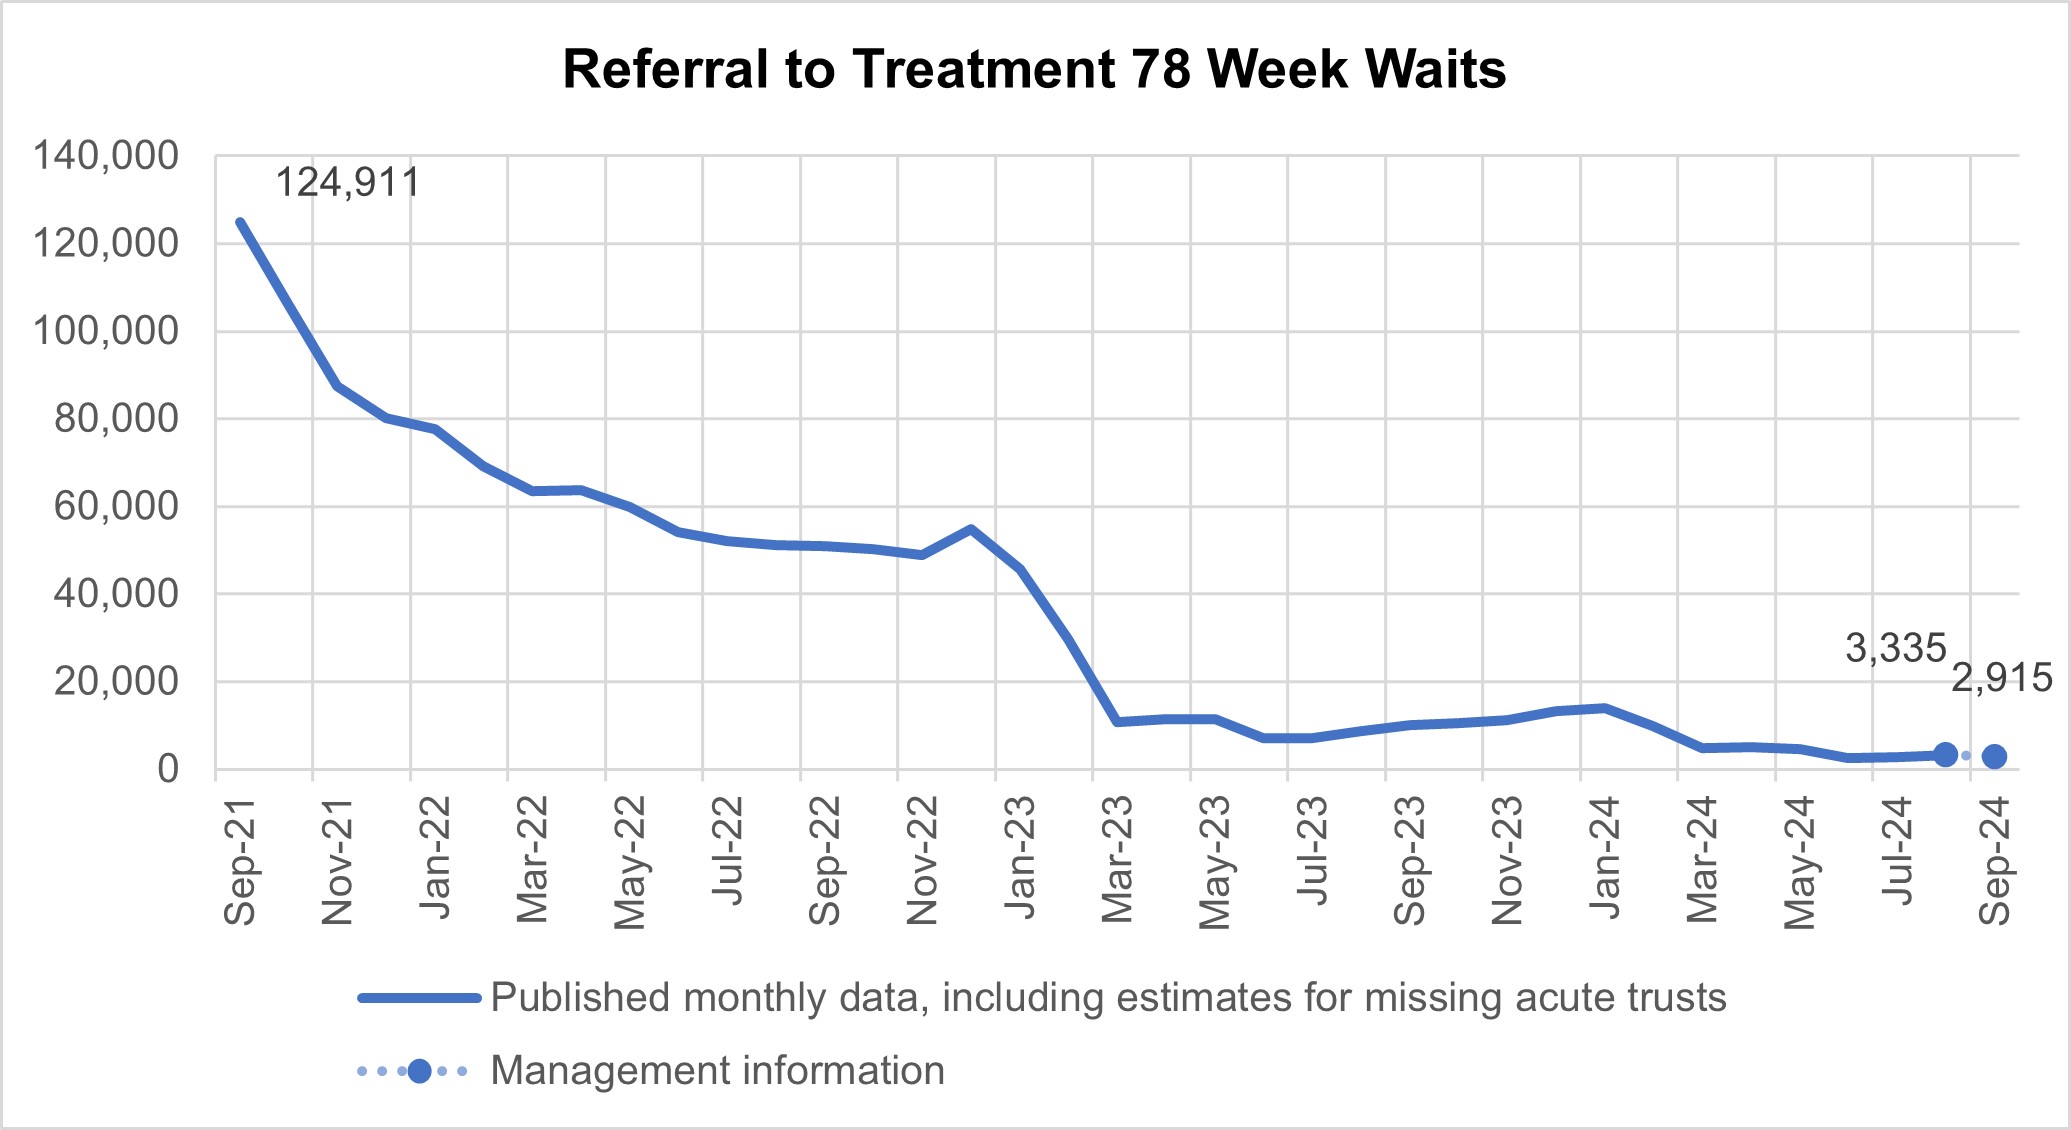
There has been a reduction in the longest waits for care, 3,335 patients were waiting more than 78 weeks for treatment at the end of August, compared to 8,680 at the end of August 23 (down 61.6%). Additional management data suggests 2,915 patients were waiting more than 78 weeks for treatment as of the end of September.
Referral to treatment 78 week waits
Please note the number of patients experiencing waiting times of more than 104 weeks has remained below 150 and will no longer be included in this briefing.
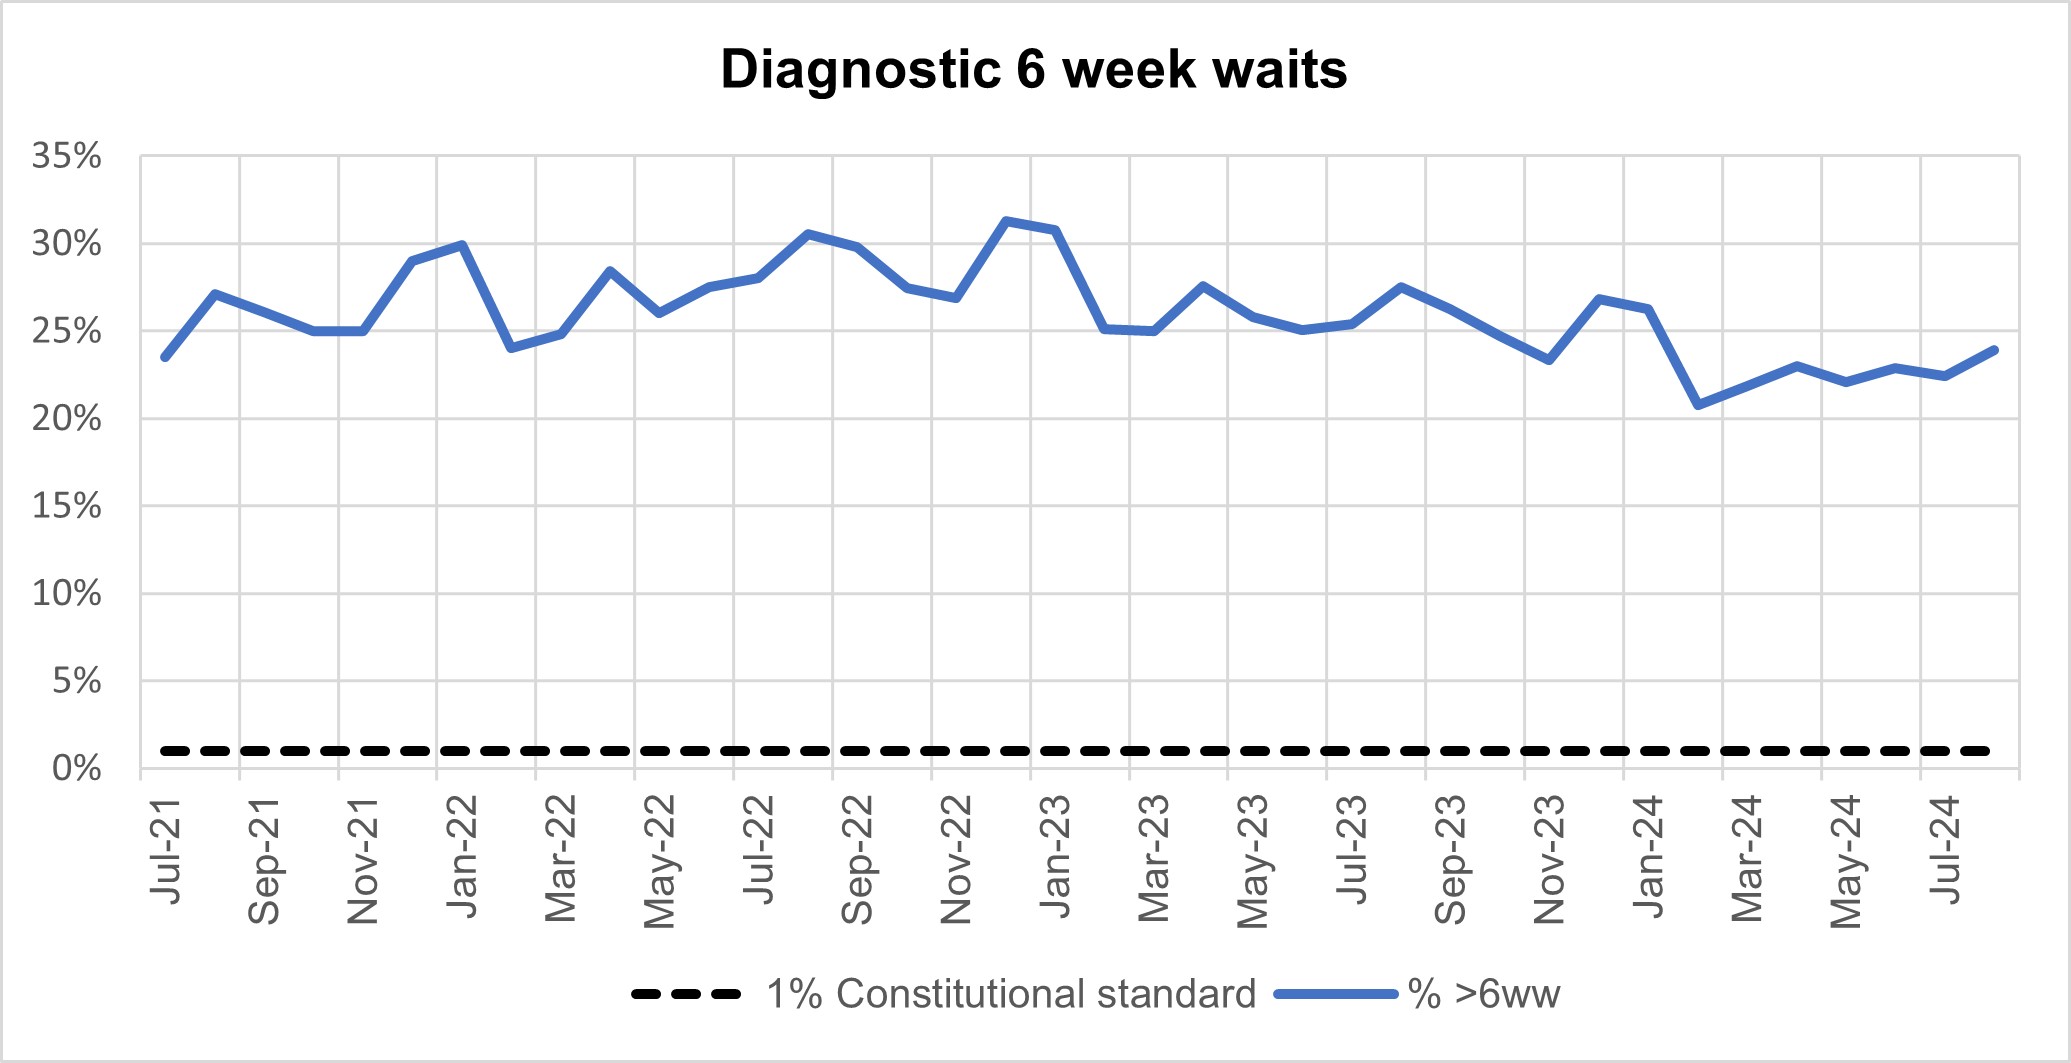
At the end of August, on the diagnostic waiting list there were 1.55 million waits, of which 373,126 had waited 6 weeks or more. The percentage of 6 week waits was 23.9%, down from 27.5% in August 2023. Progress is being made towards the interim recovery target of not more than 5% of the waiting list over 6 weeks and an increased percentage of diagnostic activity is supplied by Community Diagnostic Centres.
Diagnostic 6 week waits
Cancer
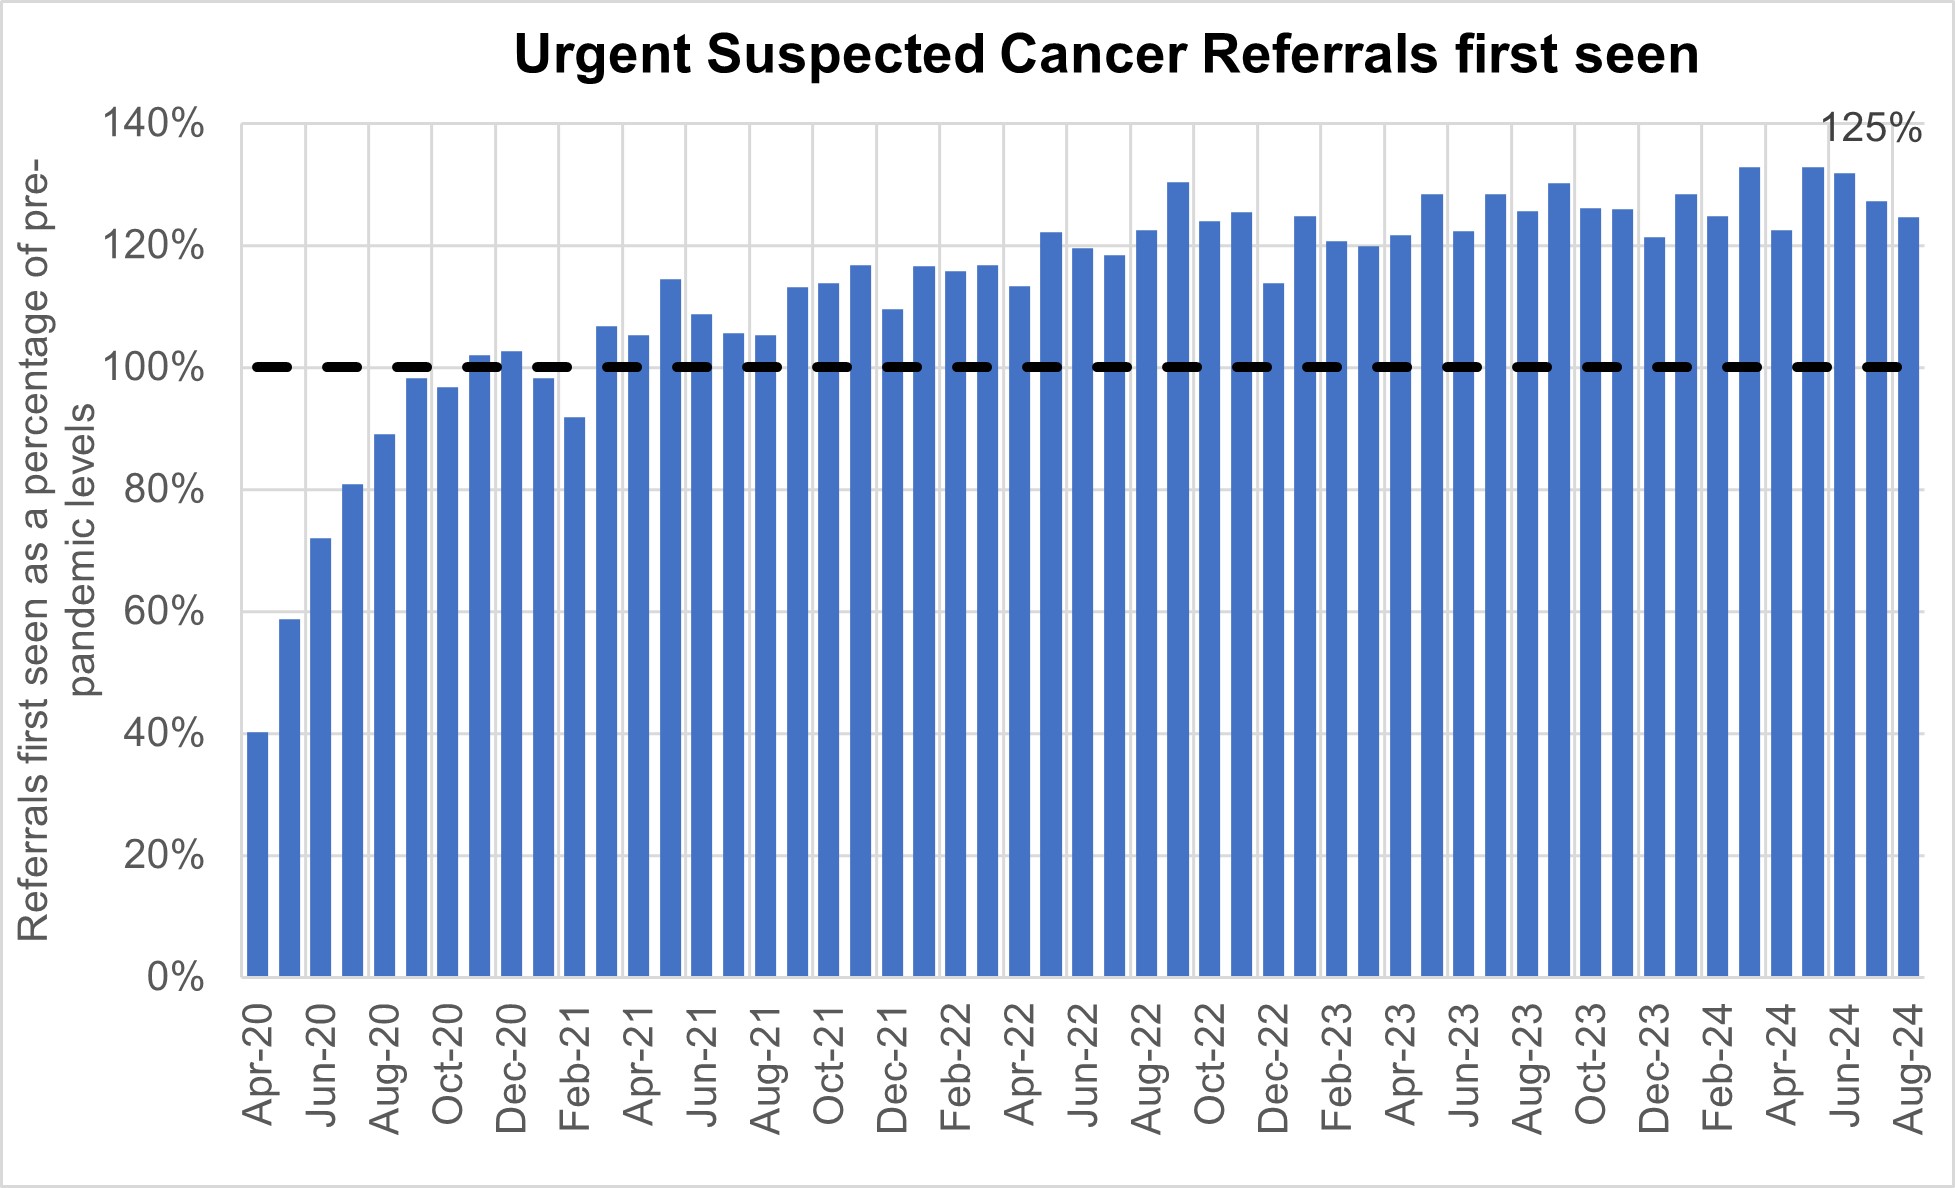
Levels of Urgent Suspected Cancer referrals have remained high, with 11,888 patients seen per working day in August 2024. This is 25% more referrals than the NHS was seeing before the pandemic – the equivalent of 2,000 more patients per working day.
Treatment activity was also at a record high level with over 1,400 patients starting cancer treatment per working day, 14% above pre-pandemic levels.
Urgent suspected cancer referrals first seen
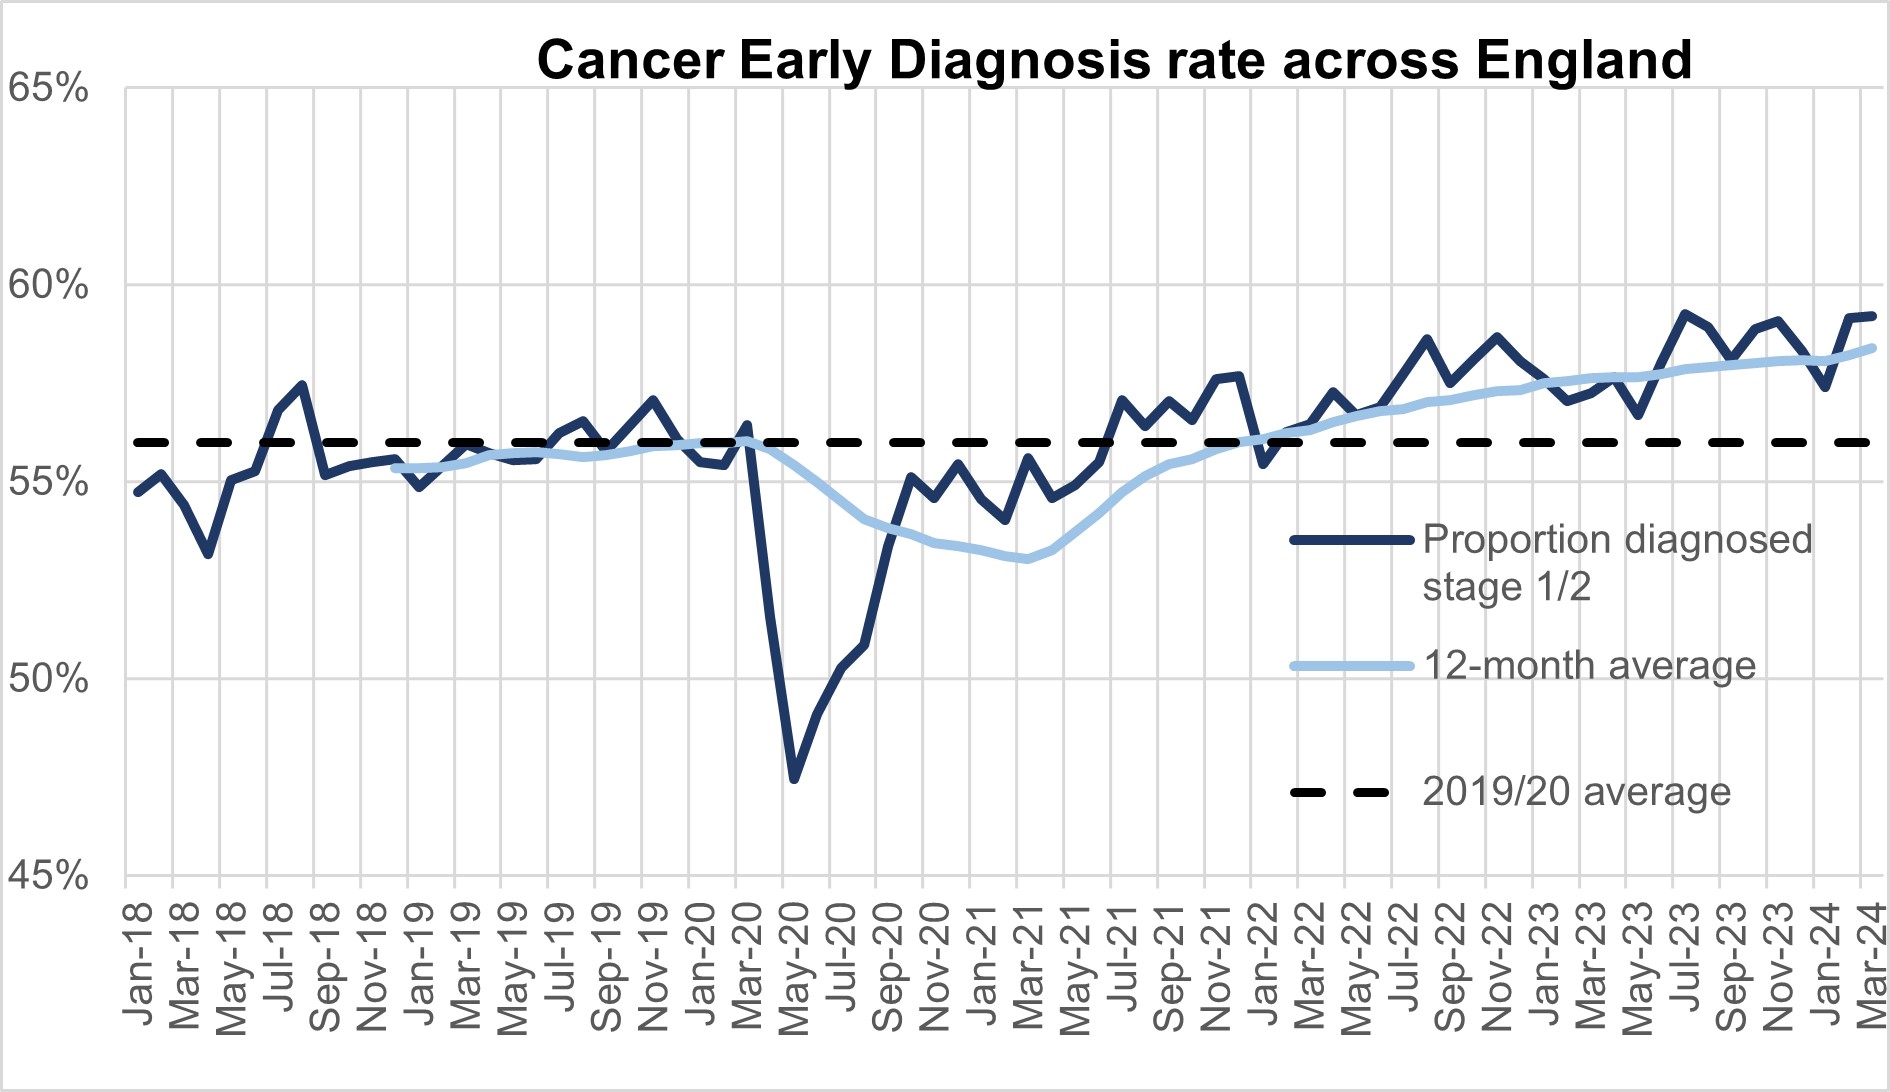
The increase in referrals has also contributed to increases in early diagnosis, which are now about 2 percentage points higher than before the pandemic. Cancer survival also continues to improve. In 2023, the Annals of Oncology published findings showing that cancer deaths are around 10% lower in the UK compared to five years ago.
Cancer early diagnosis rate across England
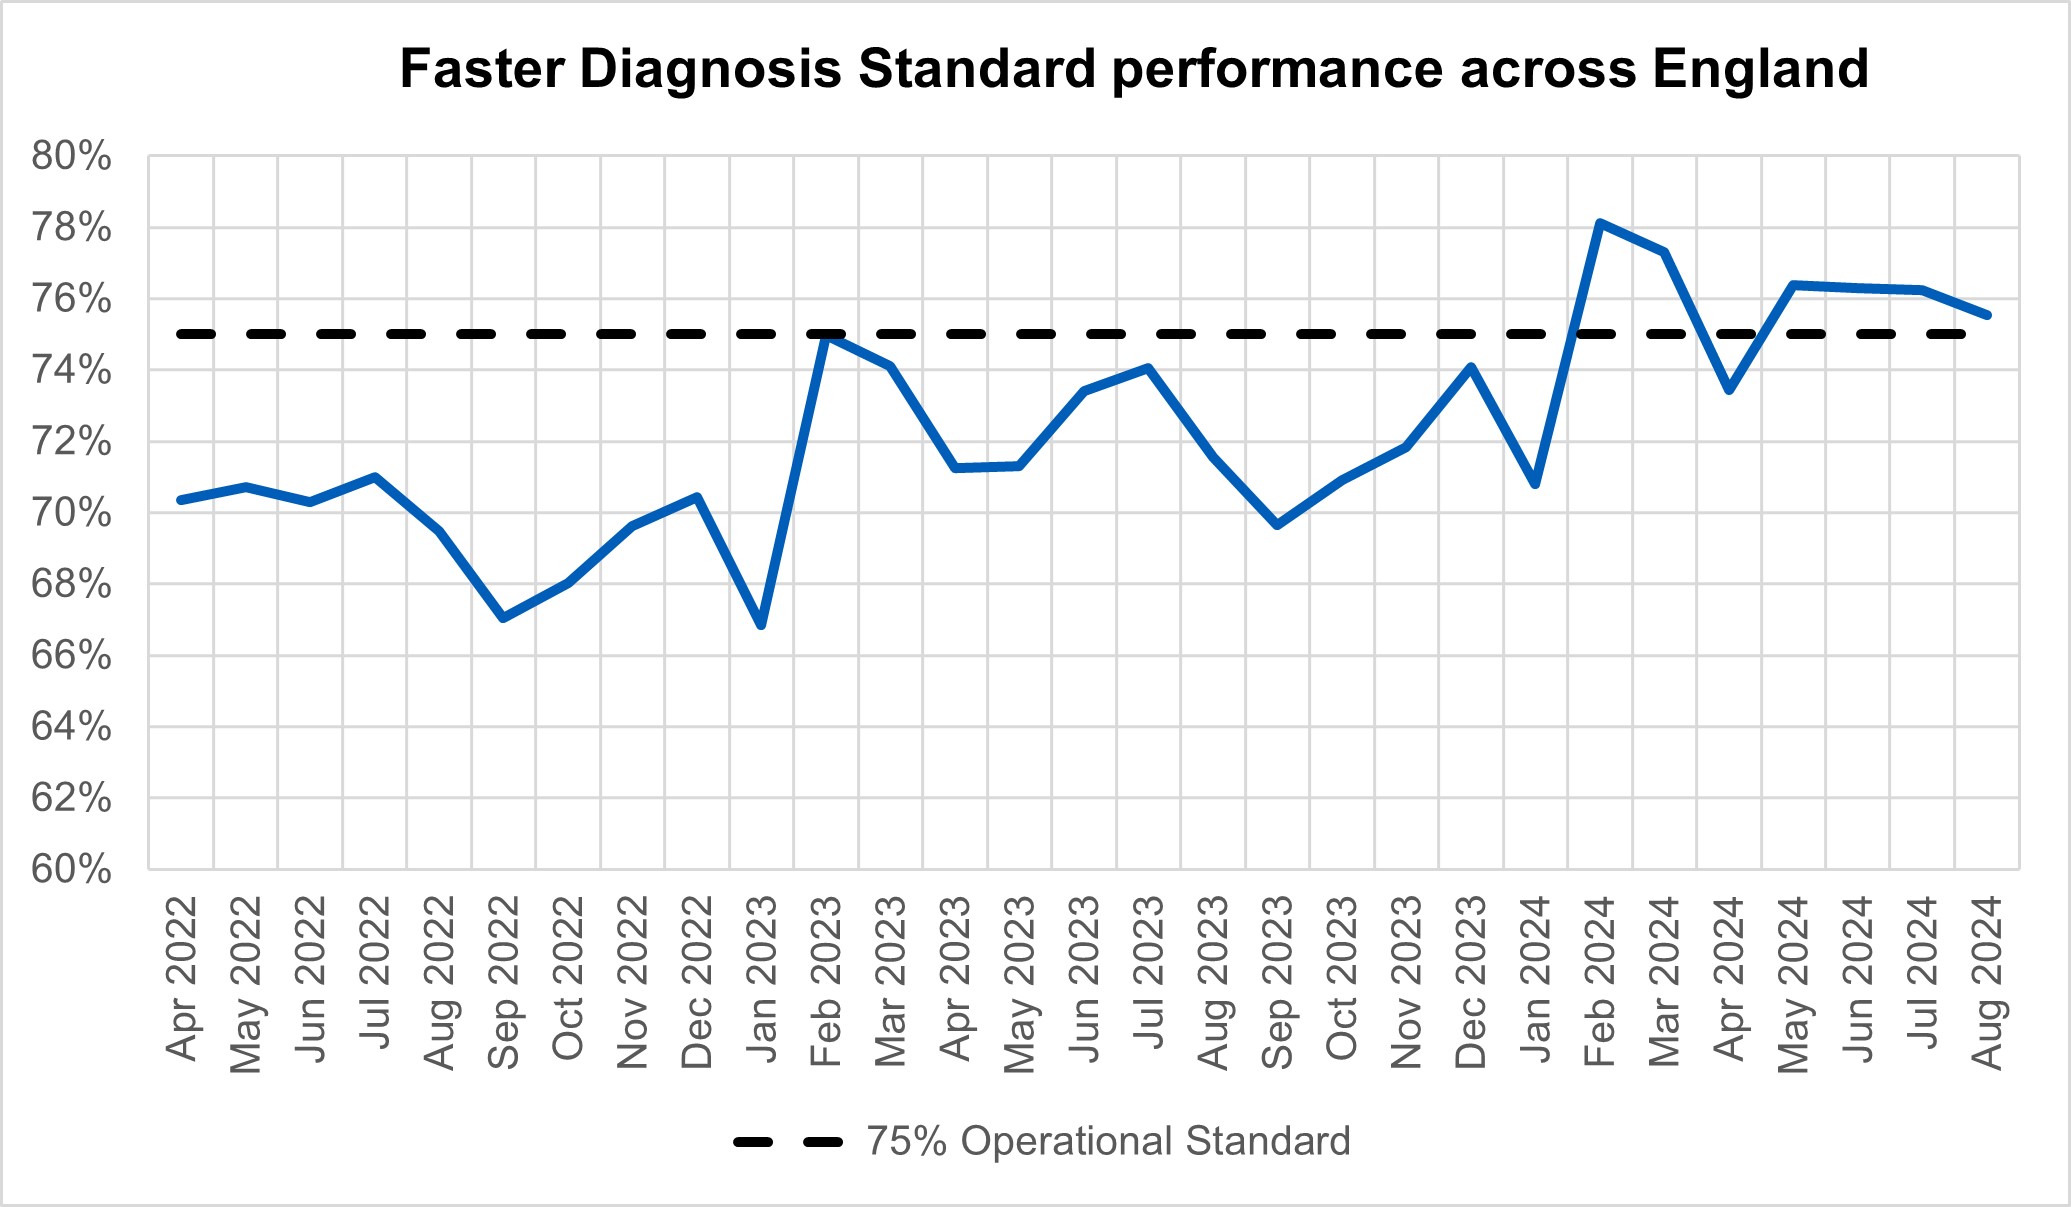
The NHS is working hard to keep up with this increase in demand. It has been accelerating the installation of new diagnostic capacity, much of it in Community Diagnostic Centres. Performance against the Faster Diagnosis Standard in August was 75.5%, the fourth successive month the 75% standard was met. The NHS has announced that this standard will increase to 80% by March 2026.
Faster diagnosis standard performance across England
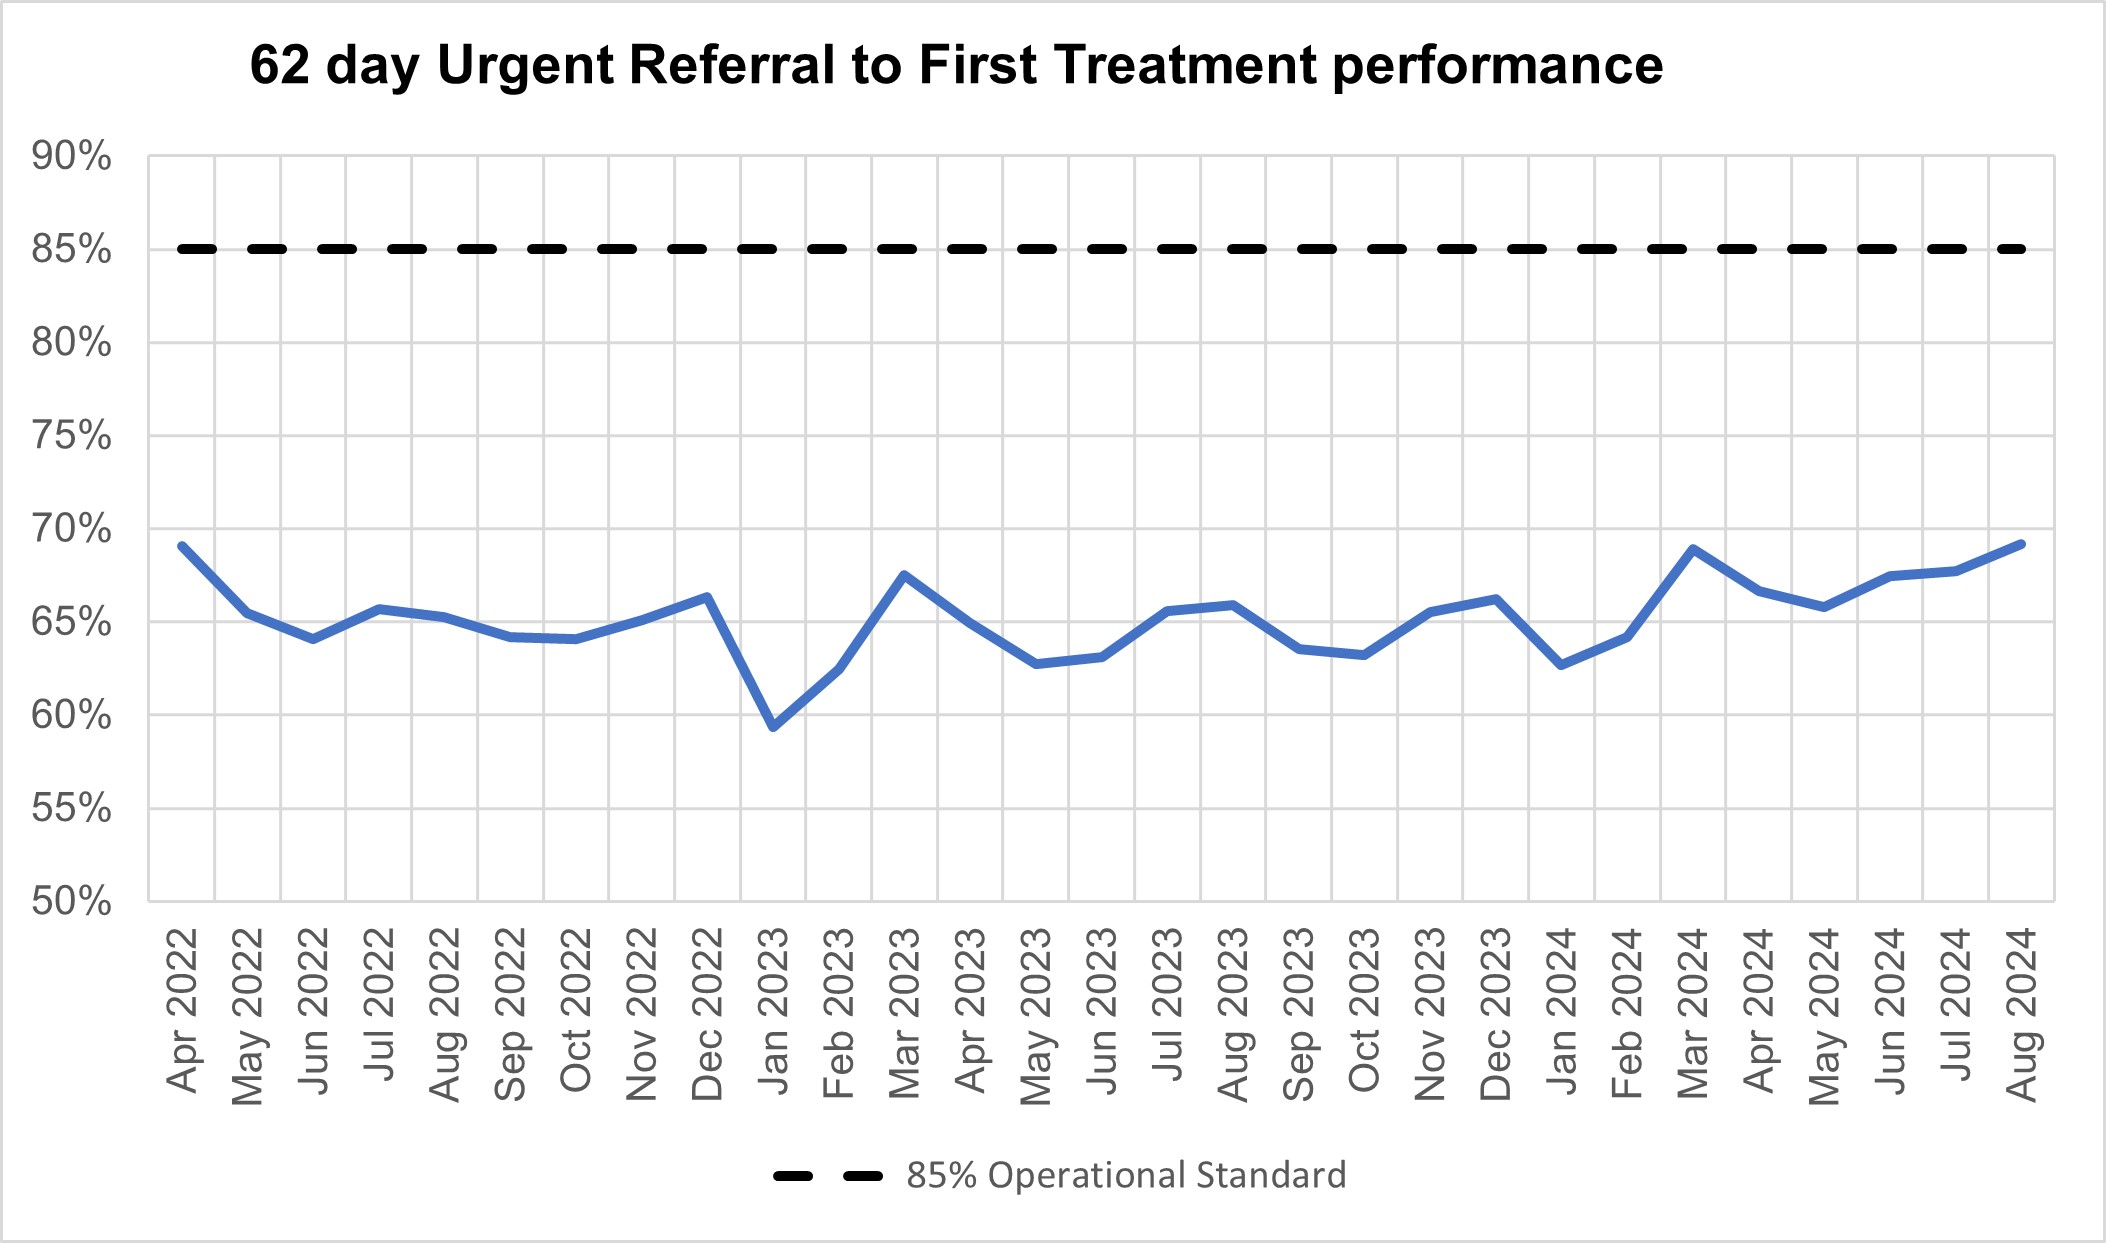
In August, performance against the 62 day Urgent Referral to First Treatment Standard, was 69.2% which was 3.3% higher than at the same point last year, but still well below where we want to see it. The NHS has set the ambition to improve this to 70% to March 2025, as a first step in recovering performance to the 85% standard.
62 day urgent referral to first treatment performance
Mental Health
As service access has expanded, so too has data completeness and quality, which is an important but often overlooked part of service transformation. Over the last three years the number of organisations submitting data to the Mental Health Services Dataset has increased from 298 in January 2021 to 379 submitters in August 2024. These newly submitting providers, often smaller Voluntary Care and Social Enterprise (VCSE) partners, are key to providing patients with integrated community models of mental health provision, and their contribution to the national dataset is a critical step in recognising and demonstrating the value they provide to patients.
Between June 2024 to August 2024, there were 7.6 people per 100,000 population in England aged between 18-64 discharged with a length of stay of 60 days or more, which is 0.1 more than for May 2024 to July 2024 (7.5). During the same period there were 7.5 people per 100,000 population in England aged 65 or over, discharged with a length of stay of 90 days or more, which is the same as the previous period. The current threshold for both metrics is 8 people per 100,000 population, so both are being met for adults 18-64 and 65+ during the period June 2024 to August 2024. The average length of stay (hospital spell) in adult acute beds in August 2024 was 45 days, the same as in August 2023, and down from its peak of 51 days in January 2024 (N.B. these figures do not include adult psychiatric intensive care unit (PICU) beds). For older adult acute beds, the average in August 2024 was 90 days, which is also similar to the 89 days recorded in August 2023.