Introduction
NHS England has published segmentation and ‘league table’ figures for Q2 2025/26 and will continue to do so quarterly.
This is only the second set of data published under the revised NHS Oversight Framework process and so significant care needs to be taken when analysing and interpreting the information provided. As data builds over time we will better understand normal levels of performance variation and the impacts of seasonal performance patterns. However, we can still draw some conclusions from the Q2 2025/26 data with a high degree of confidence and this document provides a summary of these conclusions.
Summary headlines
- At national level there is limited change in overall aggregate performance but movements are seen at individual metric level.
- A total of 38 trusts have seen a change in segment since Q1 of which:
- 6 are as a direct result of a financial override being applied or removed: 4 of these have improved segment and 2 have deteriorated
- 8 are as a result of significant changes in average metric score: 4 of these have improved segment and 4 have deteriorated
- the remaining 24 segment changes do not meet the current threshold to be considered significant. These trusts will be individually reviewed to determine if any changes to support or intervention arrangements are required
- A further 9 trusts have seen changes in average metric score that are deemed to be significant but have not resulted in a change of segment.
Overall change
Segmentation and league table decisions are informed by each organisation’s average metric score, which can range from 1.00 (highest) to 4.00 (lowest).
The average metric score is the total of all metric scores awarded to all organisations divided by the total number of metrics scored across all organisations.
Overall, the average metric score in Q2 2025/26 is 2.37, which is 0.01 points higher than in Q1. The median metric score, the middle value when all trust metric scores are listed in sequential order, has also increased marginally from 2.32 to 2.34. Taken together, these changes indicate it is likely that slightly fewer trusts met objectives in Q2, in particular:
- fewer acute trusts achieved their 18-week elective waiting list plan than in Q1
- more trusts were considered significantly off track against financial plan than in Q1
As NHS performance varies by season we advise against reading too much into these changes. We do not yet have a full year of data from which to start to judge what a ‘normal’ level of change between quarters would be and, therefore, cannot say with certainty if these changes should be considered significant. We provide this information for transparency, to show what has changed and why.
Financial override
There have been material changes for some trusts between Q1 and Q2 due to the application of the financial override. The segment of any organisation determined to be in financial deficit is capped at no better than segment 3.
In Q1 120 trusts were identified as triggering the financial override. Financial data to the end of Q2 shows that 7 of these 120 trusts are no longer determined to trigger the override but a further 6 new trusts are now triggering the override. Q2 therefore shows a net reduction in the number of financial override organisations of one to 119 trusts.
Not all trusts that trigger the override will see a change in their segment, as for trusts already in segment 3 or 4 the financial override has no effect. A total of 6 organisations saw a change in their segment in Q2 as a result of the financial override.
4 trusts improved their segment due to no longer triggering the financial override:
- Chelsea and Westminster Hospital NHS Foundation Trust
- Oxleas NHS Foundation Trust
- South West Yorkshire Partnership NHS Foundation Trust
- West Midlands Ambulance Service University NHS Foundation Trust
Segment deteriorated for 2 trusts as a result of their triggering the financial override:
- London North West University Healthcare NHS Trust
- North East London NHS Foundation Trust
Individual performance change
Excluding the 6 changes in segmentation due to financial override mentioned in the previous section, a total of 32 other trusts have seen a change in segmentation between Q1 and Q2. While this may be significant, we strongly advise against using segmentation changes alone to judge if there has been meaningful performance change. Segmentation is determined by evenly dividing average metric scores into ‘quartiles’ and so trusts whose average scores are close to the quartile boundaries may move between segments as a result of only small changes in performance.
A better way of understanding performance change is to consider changes in average metric score. The nature of average scores mean that most trusts will see some change in score between quarters and so we have designed an initial method to differentiate between meaningful change in scores and normal levels of variation. This considers both the size of the change in average score and the number of metrics the trust submits – as we would expect more variation in the average metric score for trusts with fewer metrics.
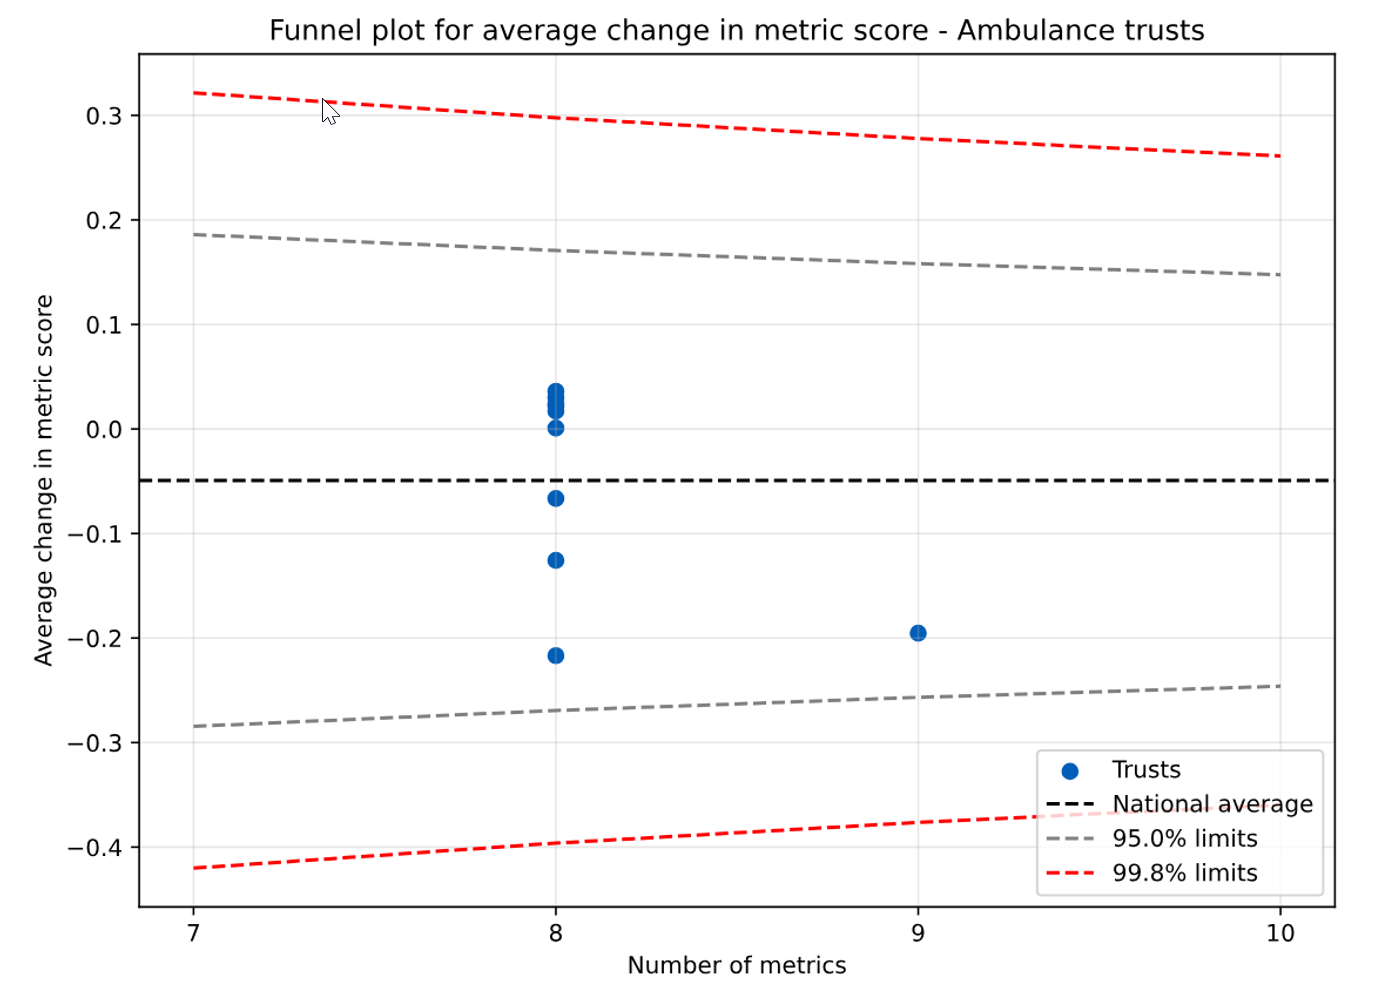
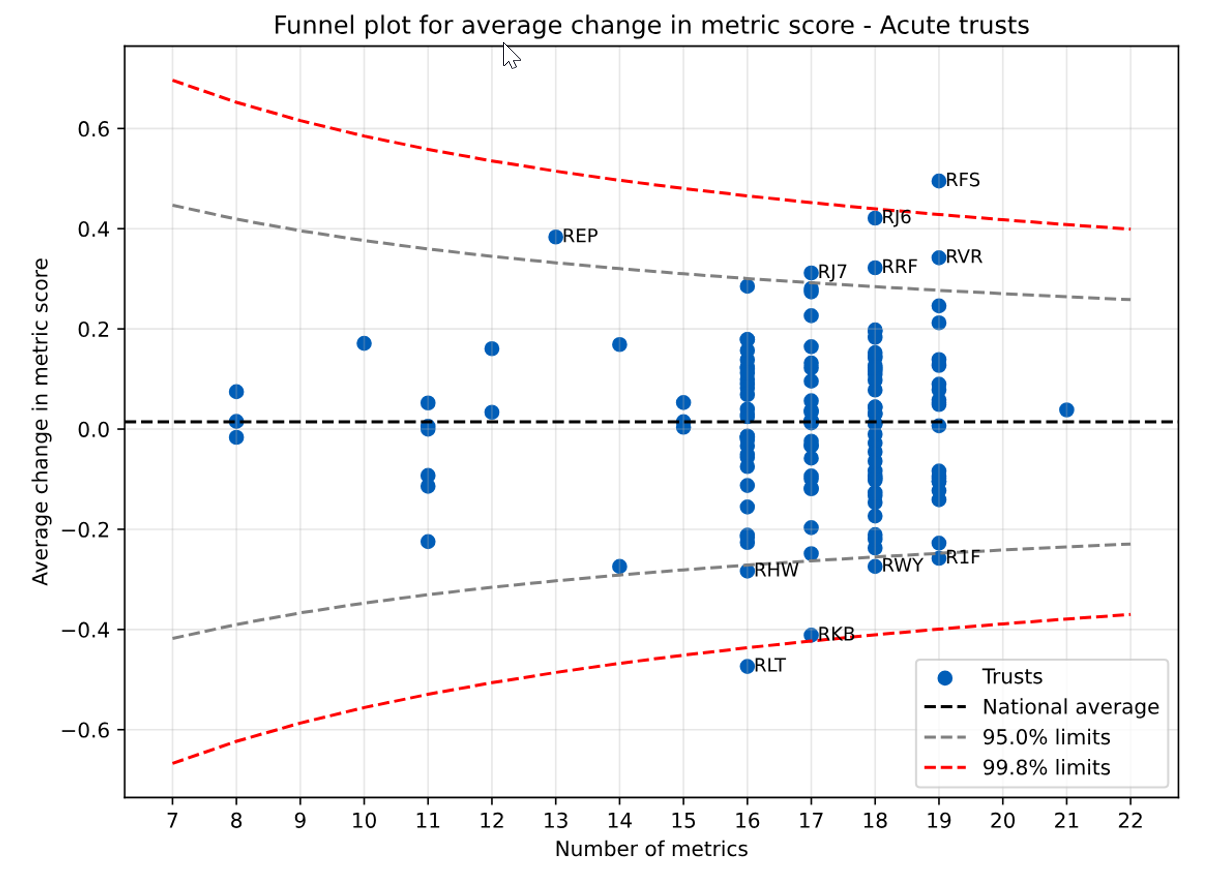
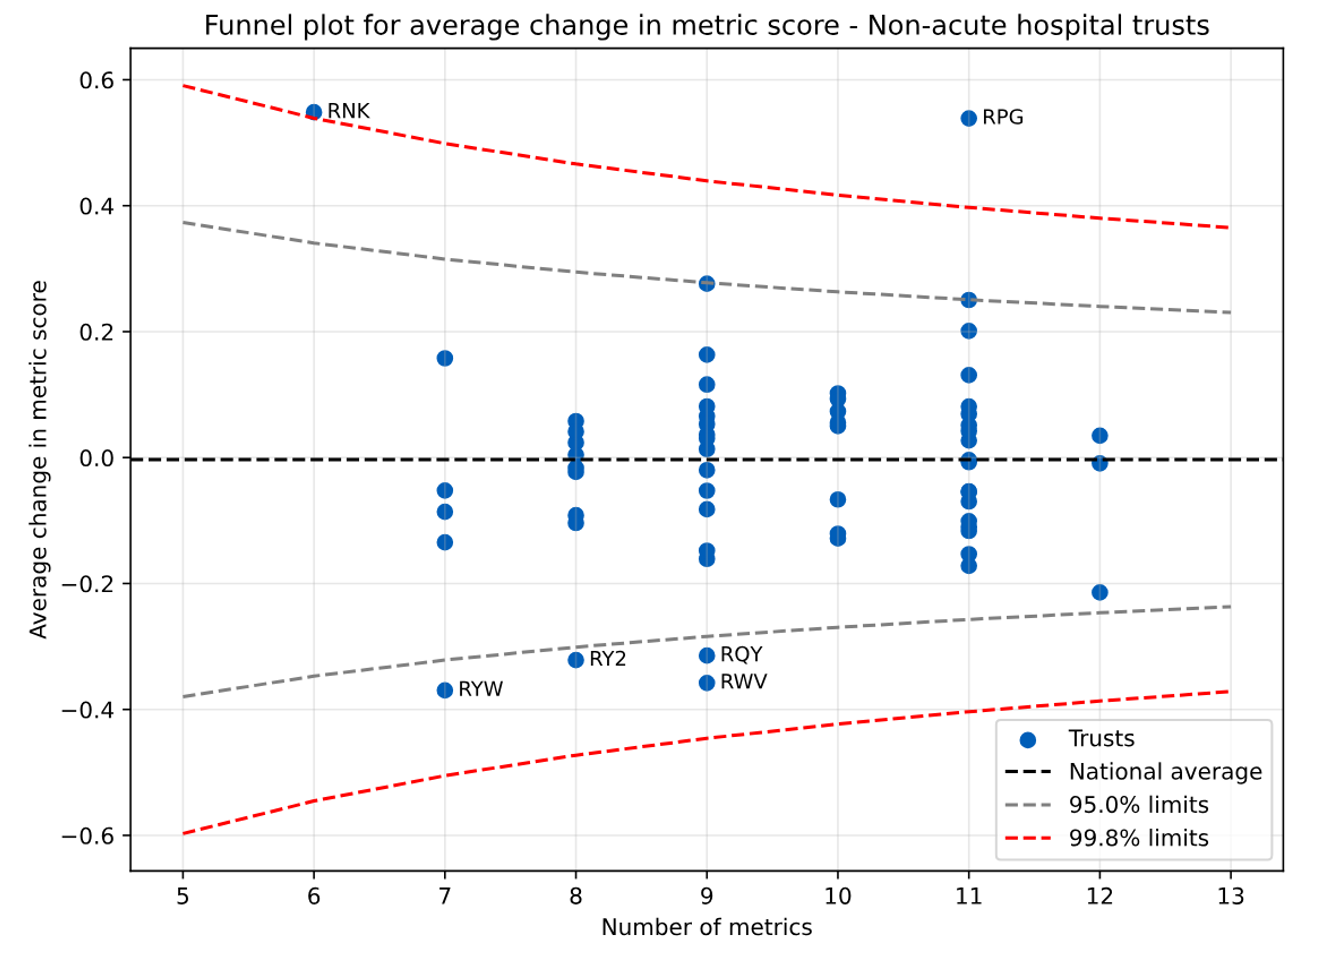
The outcomes of this analysis are input into a graph called a funnel plot (see Annex). This sets upper and lower boundaries beyond which changes should be considered significant. We have applied 2 sets of boundaries at the following levels:
- 95% confidence – the change in score is unlikely to be chance variation
- 99.8% – the change in score is highly unlikely to be chance variation
Other changes are not necessarily insignificant, but those beyond the confidence boundaries are those we are most confident about. As this is only the second iteration of segmentation, some changes in performance will be driven by improving data quality rather than changes in practice.
We provide a short summary below of the drivers of change in those organisations identified as seeing a likely significant change in performance.
Organisations seeing change in average metric score outside 99.8% control limits
- RLT: George Eliot Hospital NHS Trust (improved by 0.47 points) – improvement against multiple access standards
- RFS: Chesterfield Royal Hospital NHS Foundation Trust (deteriorated by 0.50 points) – financial and operational performance have materially deteriorated
- RPG: Oxleas NHS Foundation Trust (deteriorated by 0.54 points) – changes in reporting of waits for certain specialties has significantly increased the size of the trust’s 52-week waiting list
- RNK: Tavistock and Portman NHS Foundation Trust (deteriorated by 0.55 points) – financial position has deteriorated from Q1
Organisations seeing change in average metric score outside 95% control limits but within 99.8% control limits
- RKB: University Hospitals Coventry and Warwickshire NHS Trust (improved by 0.41 points) – improvements in finance and cancer 28-day performance as well as submitting data on community waiting lists that was not submitted in Q1
- RYW: Birmingham Community Healthcare NHS Foundation Trust (improved by 0.37 points) – Q1 data on urgent community response was incomplete so could not be used; a full submission was made in Q2 allowing this metric to be included
- RWV: Devon Partnership NHS Trust (improved by 0.36 points) – improvement in 60-day length of stay and relative cost difference
- RY2: Bridgewater Community Healthcare NHS Foundation Trust (improved by 0.33 points) – improvement in annual growth in children’s and young people’s mental health contacts
- RQY: South West London and St George’s Mental Health NHS Trust (improved by 0.31 points) – improvements in 60-day length of stay and crisis response
- RHW: Royal Berkshire NHS Foundation Trust (improved by 0.28 points) – 18-week elective performance above plan and 4-hour A&E standard met
- RWY: Calderdale and Huddersfield NHS Foundation Trust (improved by 0.27 points) – improvements in urgent community response, staff sickness and implied productivity
- R1F: Isle of Wight NHS Trust (improved by 0.25 points) – improvement in performance against 4 and 12-hour UEC standards and a reduction in ambulance conveyances
- RJ7: St George’s University Hospitals NHS Foundation Trust (deteriorated by 0.31 points) – deterioration in cancer performance including no longer meeting 62-day standard
- RRF: Wrightington, Wigan and Leigh NHS Foundation Trust (deteriorated by 0.32 points) – CQC inpatient satisfaction deteriorated from as expected to worse than expected
- RVR: Epsom and St Helier University Hospitals NHS Trust (deteriorated by 0.34 points) – deterioration in performance on delayed discharge, performance against 18-week elective plan and several access standards
- REP: Liverpool Women’s NHS Foundation Trust (deteriorated by 0.38 points) – deterioration in finance and elective performance
- RJ6: Croydon Health Services NHS Trust (deteriorated by 0.42 points) –deterioration in cancer and UEC performance
Annex A – Acute trust funnel plot for mean change in metric score
Annex B – Mental health and community trust funnel plot for mean change in metric score
Annex C – Ambulance trust funnel plot for mean change in metric score