Introduction
NHS England has released segmentation and league table data covering the third quarter of the 2025/26 financial year. This summary sets out key points to help readers understand the data.
This is the third set of data published under the updated NHS Oversight Framework and should continue to be interpreted with caution. Over time, as more data becomes available, we will develop a better understanding of normal performance variations and seasonal trends.
Even without long-term data, there are conclusions we can confidently draw.
Headline change
Segmentation and league table decisions are informed by each organisation’s average metric score which can range from the highest possible score of 1.00 to the lowest possible score of 4.00.
In Q2, the overall average metric score was 2.39, up slightly from 2.37 in Q2 and 2.36 in Q1. The median score also rose slightly from 2.34 to 2.35. These small changes suggest there was little significant overall change between Q2 and Q3 but there were some changes in individual measures including:
- 27 fewer acute trusts (20%) met their 18-week elective waiting list plan than in Q2
- 12 fewer acute trusts (10%) met the 78% 4-hour A&E target than in Q2
- 23 more trusts (11%) were adjudged to be significantly off track on their financial plan
- 8 more acute trusts (7%) met the 28-day faster diagnosis target and 4 more (4%) met the 62-day cancer standard
Because we don’t yet have a full year of data, these changes should be interpreted cautiously. We cannot yet say if these shifts are significant or simply reflective of normal seasonal movement in these areas.
Financial override
Trusts in financial deficit cannot be segmented above segment 3.. There have been changes in deficit position for some trusts between Q2 and Q3 which has subsequently impacted segmentation.
In both Q2 and Q3, 119 trusts were in financial deficit. While the overall number of trusts in deficit is unchanged there were some changes in the makeup of this cohort. 7 trusts are now in financial deficit in Q3 while 7 other trusts are no longer in deficit having been in deficit in Q2.
Not all trusts who are in deficit see changes in segmentation as trusts already in segment 3 or 4 are unaffected by the override. A total of 8 organisations saw changes to their segmentation in Q3 as a direct result of changes in the financial override.
3 trusts have improved their segment after their financial deficit cap was lifted:
- Hertfordshire Community NHS Trust
- London North West University Healthcare NHS Trust
- The Hillingdon Hospitals NHS Foundation Trust
5 new trusts have seen their segment capped due to entering a financial deficit:
- Maidstone and Tunbridge Wells NHS Trust
- West Midlands Ambulance Service NHS Foundation Trust
- Gloucestershire Hospitals NHS Foundation Trust
- South Warwickshire University NHS Foundation Trust
- Cambridgeshire and Peterborough NHS Foundation Trust
Performance change
Excluding the 8 changes in segmentation due to the financial override, 34 other trusts have moved segments between Q2 and Q3. Segmentation changes do not necessarily reflect performance changes. Trusts near segment boundaries can move with minimal score changes, and significant score changes can occur without affecting segment.
A better measure is to use the average metric score which can show how far each trust’s overall score has changed between quarters. Most trusts will see some degree of change in their score and so analysis is required to differentiate between meaningful and normal levels of change. We assess changes in average metric scores using an approach that considers:
- the size of the change in average score
- the number of metrics each trust submits (Fewer metrics means changes will have a greater effect on overall scores)
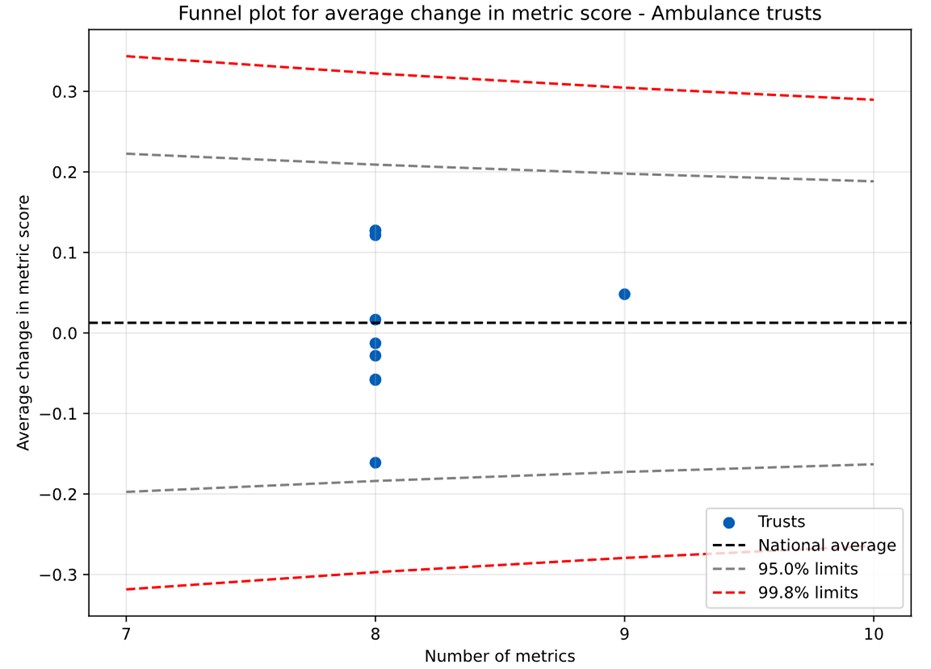
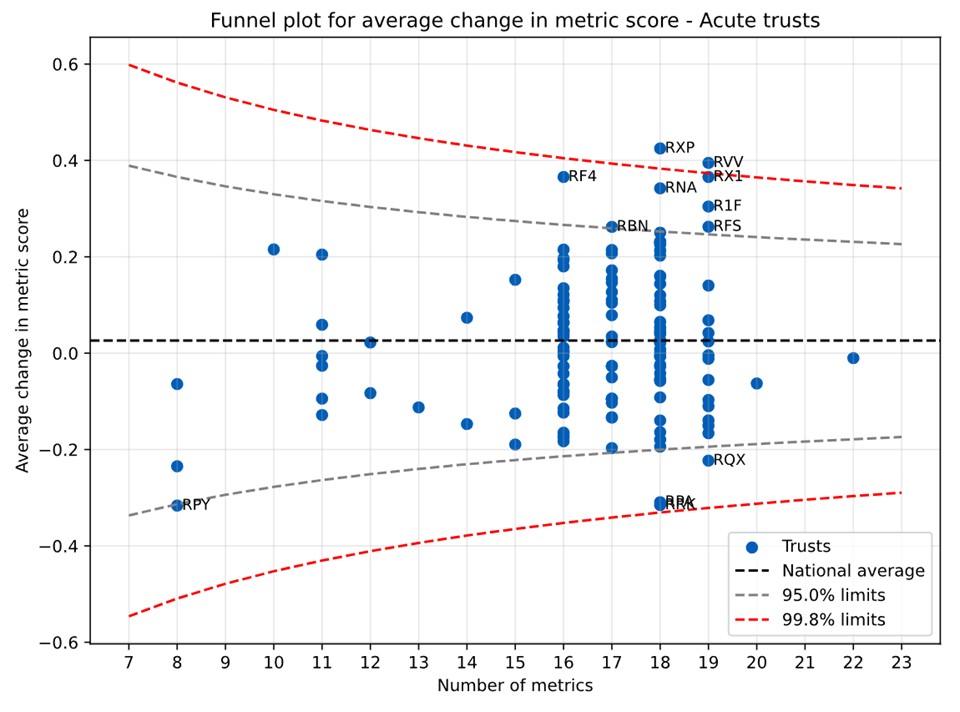
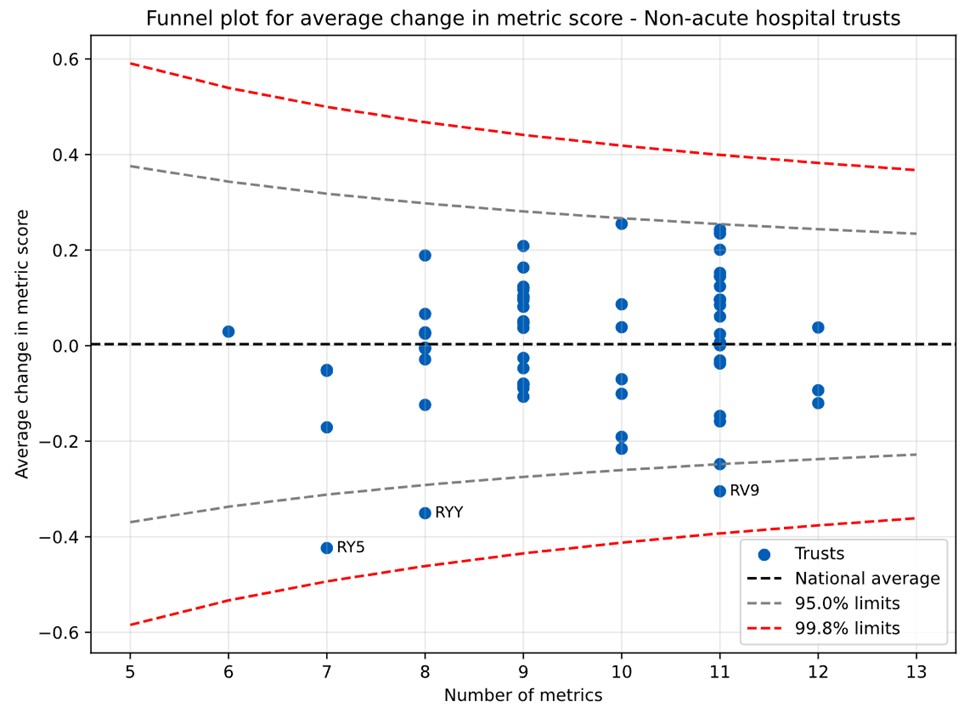
The outcomes of this exercise have been input onto a funnel plot which has confidence bounds set at two levels:
- 95% confidence – the change in score is likely to be significant
- 99.8% confidence – the change in score is highly likely to be significant
This identifies all trusts with a greater than 95% probability of meaningful change – the threshold at which we have the most confidence, though changes below this level are not necessarily insignificant.
We have identified a total of 2 trusts whose level of change between Q2 and Q3 is considered to be significant with 99.8% confidence and a further 13 trusts whose change is considered to be significant with 95% confidence. These changes can be either positive or negative. We have provided a short summary of the drivers of change in those 15 organisations identified as seeing a likely significant change in performance. It should be recognised that in some cases changes will be driven by changes in data reporting rather than necessarily any change in operational performance.
Organisations seeing change in average metric score with above 99.8% confidence
- County Durham and Darlington NHS Foundation Trust (Deteriorated by 0.43 points): Deterioration in urgent care and cancer performance as well as deterioration against plan on 18-week elective performance and finance.
- East Kent Hospitals University NHS Foundation Trust (Deteriorated by 0.40 points): Financial position against plan has deteriorated significantly.
Organisations seeing change in average metric score with above 95% confidence but below 99.8% confidence
Improved
- Lincolnshire Community Health Services NHS Trust (Improved by 0.43 points) All 52-week community waits cleared and improved performance against Urgent Community Response standard.
- Kent Community Health NHS Foundation Trust (Improved by 0.35 points) Improvement against 52-week community waits and urgent community response measures. Additionally, as part of a reconfiguration of services, Children’s and Young Person’s Mental Health activity data, previously reported through the Mental Health Services Dataset, is now being reported through the Community Services Dataset and so this metric is no longer applicable.
- University Hospitals Birmingham NHS Foundation Trust (Improved by 0.32 points) Performance against elective and cancer targets has improved with % of patients waiting over 52 weeks reducing below 1% target. Data quality issues have also prevented Urgent Community Response performance from being calculated this quarter and so this metric cannot be populated.
- The Royal Marsden NHS Foundation Trust (Improved by 0.32 points) Rate of implied productivity has improved.
- Medway NHS Foundation Trust (Improved by 0.31 points) Healthcare Associated Infection rates have improved as has performance against the 62-day cancer standard. This trust no longer has responsibility for community paediatric services and so the 52-week community waits metric is no longer applicable.
- Humber Teaching NHS Foundation Trust (Improved by 0.30 points) All 52-week community waits have been cleared, and Children’s and Young Person’s Mental Health activity data has improved.
- Homerton Healthcare NHS Foundation Trust (Improved by 0.22 points) Children’s and Young Person’s Mental Health activity data has improved.
Deteriorated
- Chesterfield Royal Hospital NHS Foundation Trust (Deteriorated by 0.26 points) Deterioration in 18-week elective and finance performance against plans.
- Mersey and West Lancashire Teaching Hospitals NHS Trust (Deteriorated by 0.27 points) Discharge performance has deteriorated and 18-week elective performance has fallen below
- Isle of Wight NHS Trust (Deteriorated by 0.30 points) Position has deteriorated against financial plan and 12-hour urgent care delays have increased.
- The Dudley Group NHS Foundation Trust (Deteriorated by 0.35 points) Position has deteriorated against financial plan and implied productivity has deteriorated.
- Nottingham University Hospitals NHS Trust (Deteriorated by 0.36 points) Deterioration in urgent and emergency care and elective care performance.
- Barking, Havering and Redbridge University Hospitals NHS Trust (Deteriorated by 0.37 points) Deterioration in elective and cancer performance.
Annex A – Acute trust funnel plot
Annex B – Mental health and community trust funnel plot
Annex C – Ambulance trust funnel plot