Introduction
NHS England has released segmentation and league table data covering the final quarter of the 2025/26 financial year. This summary sets out key points to help readers understand the data.
This is the final set of data published under the 2025/26 NHS Oversight Framework and should continue to be interpreted with caution. From 2026/27 we will, for the first time, have year on year figures which will support richer analysis of performance variations and trends, as more data becomes available.
Even without year-on-year data, however, there are some conclusions we can draw.
Headline change
Segmentation and league table decisions are informed by each organisation’s average metric score which can range from a best possible score of 1.00 to a worst possible score of 4.00.
In Q4, the overall average metric score was 2.30, improved significantly from 2.39 in Q3 and the lowest average metric score of any quarter this year. This improvement is reflective of positive operational and financial performance in the final quarter of the year driven in particular by
- 53% of trusts meeting the ambition to reduce their 52 week elective waiting list to below 1% up from 27% in Q3
- 65% of trusts meeting their 18 week performance plan, improved from 29% in Q3
- 44% of trusts meeting the 80% cancer faster diagnosis ambition, up from 33.9% in Q3
- 18% of trusts being significantly off track to financial plan, compared with 25% in Q3
Due to the effects of seasonality as well as other additional factors these improvements should, while welcome, be interpreted with caution.
Financial override
Trusts in financial deficit cannot be segmented above segment 3. There have been changes in deficit position for some trusts between Q3 and Q4 which has subsequently impacted segmentation.
In Q4, 108 trusts were in financial deficit. This is a reduction of 11 trusts from Q3. 12 trusts are no longer considered to be in financial deficit while 1 new trust entered deficit in Q4.
Not all trusts who are in deficit see changes in segmentation as trusts already in segment 3 or 4 are unaffected by the override. A total of six organisations saw changes to their segmentation in Q3 as a direct result of changes in the financial override. 6 trusts have improved their segment after their financial deficit cap was lifted:
- Barts Health NHS Trust
- Birmingham Women’s and Children’s NHS Foundation Trust
- Gloucestershire Hospitals NHS Foundation Trust
- North East London NHS Foundation Trust
- South Warwickshire University NHS Foundation Trust
- West Midlands Ambulance Service NHS Foundation Trust
No new trusts have seen their segment capped due to entering a financial deficit.
Performance change
Excluding the six changes in segmentation due to the financial override, 48 other trusts have moved segments between Q3 and Q4. Segmentation changes do not necessarily reflect performance changes. Trusts near segment boundaries can move with minimal score changes, and significant score changes can occur without affecting segment.
A better measure is to use the average metric score which can show how far each trust’s overall score has changed between quarters. Most trusts will see some degree of change in their score and so analysis is required to differentiate between meaningful and normal levels of change. We assess changes in average metric scores using an approach that considers:
- the size of the change in average score
- the number of metrics each trust submits (Fewer metrics means changes will have a greater effect on overall scores)
The outcomes of this exercise have been input onto a funnel plot which has confidence bounds set at two levels:
- 95% confidence – the change in score is likely to be significant
- 99.8% confidence – the change in score is highly likely to be significant
This identifies all trusts with a greater than 95% probability of meaningful change – the threshold at which we have the most confidence, though changes below this level are not necessarily insignificant.
We have identified a total of 3 trusts whose level of change between Q3 and Q4 is considered to be significant with 99.8% confidence and a further 15 trusts whose change is considered to be significant with 95% confidence. These changes can be either positive or negative. We have provided a short summary of the drivers of change in those 15 organisations identified as seeing a likely significant change in performance. It should be recognised that in some cases changes will be driven by changes in data reporting rather than necessarily any change in operational performance.
Organisations seeing change in average metric score with above 99.8% confidence
Improved
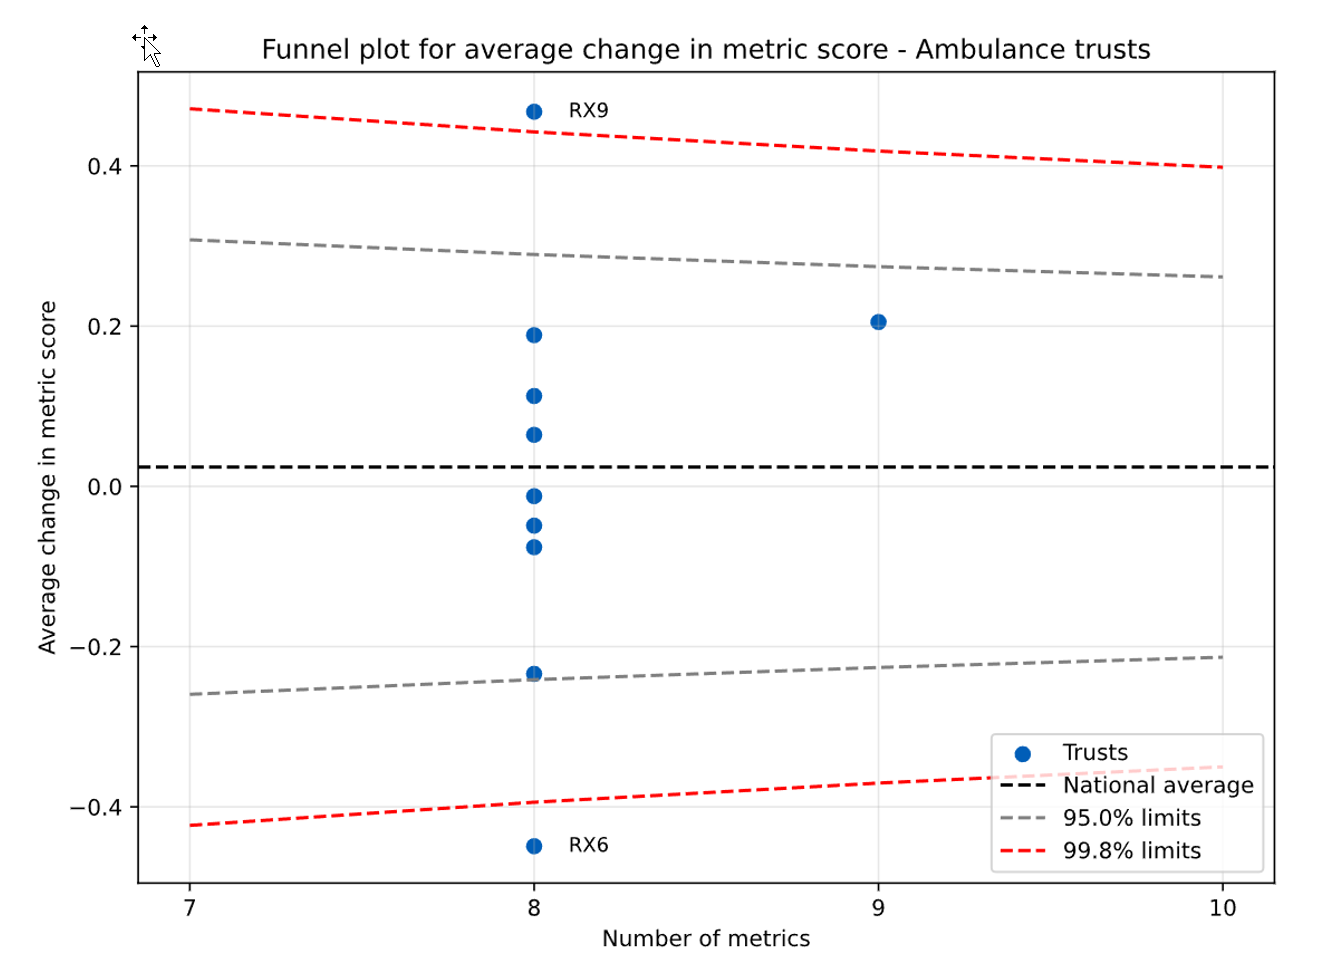
- North East Ambulance Service NHS Foundation Trust – RX6 (Improved by 0.45 points from Q3): Improvement against staff survey metrics
Deteriorated
- East Midlands Ambulance Service NHS Trust – RX9 (Deteriorated by 0.47 points from Q3): Deterioration against staff survey metrics
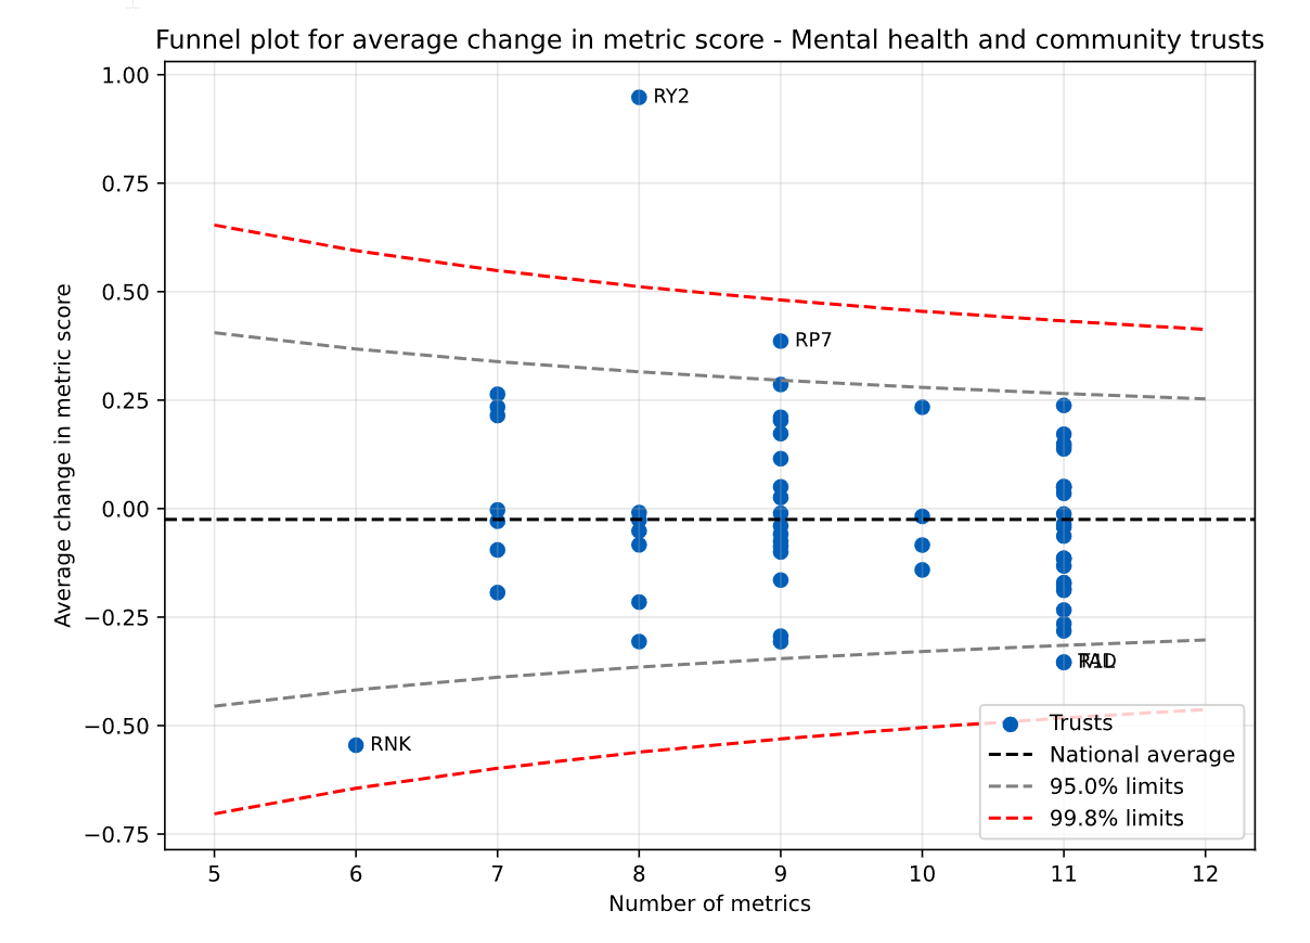
- Bridgewater Community Healthcare NHS Foundation Trust – RY2 (Deteriorated by 0.95 points from Q3): Deterioration in financial performance and staff survey metrics
Organisations seeing change in average metric score with above 95% confidence but below 99.8% confidence
Improved
- Tavistock and Portman NHS Foundation Trust – RNK (Improved by 0.55 points from Q3): Improvement in financial position
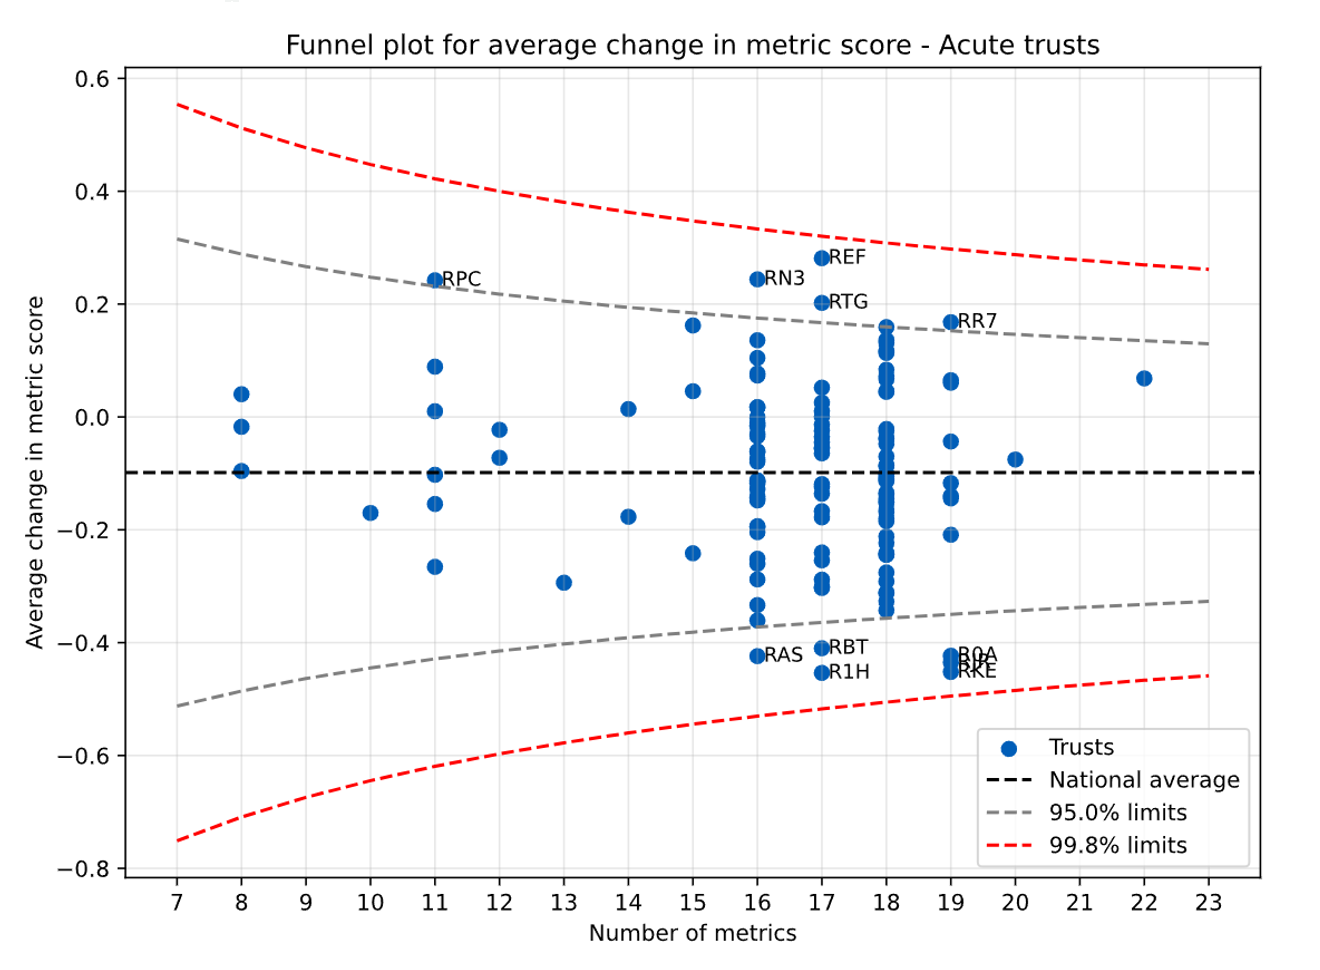
- Barts Health NHS Trust – R1H (Improved by 0.45 points from Q3): Improved financial and elective care performance
- Countess of Chester Hospital NHS Foundation Trust – RJR (Improved by 0.43 points from Q3): Improved financial and elective care performance
- Manchester University NHS Foundation Trust – R0A (Improved by 0.42 points from Q3): Improvement in elective care and cancer performance
- The Hillingdon Hospitals NHS Foundation Trust – RAS (Improved by 0.42 points from Q3): Improved position on elective care and staff survey
- Whittington Health NHS Trust – RKE (Improved by 0.42 points from Q3): Improved financial and elective care performance
- Mid Cheshire Hospitals NHS Foundation Trust (Improved by 0.41 points from Q3): Improved financial and elective care performance
- Bradford District Care NHS Foundation Trust – TAD (Improved by 0.36 points from Q3): Improvement in 24 hour mental health crisis response
- Essex Partnership University NHS Foundation Trust – R1L (Improved by 0.35 points from Q3): Improvement in financial position
Deteriorated
- Gateshead Health NHS Foundation Trust – RR7 (Deteriorated by 0.17 points from Q3): Deterioration against cancer standards and deteriorated staff survey results
- University Hospitals of Derby and Burton NHS Foundation Trust – RTG (Deteriorated by 0.20 points from Q3): Reduction in productivity and staff survey results
- Queen Victoria Hospital NHS Foundation Trust – RPC (Deteriorated by 0.24 points from Q3): Deterioration in elective care performance
- Great Western Hospitals NHS Foundation Trust – RN3 (Deteriorated by 0.25 points from Q3): Deterioration against elective and urgent care standards
- Royal Cornwall Hospitals NHS Trust – REF (Deteriorated by 0.28 points from Q3): Deterioration against elective and cancer targets
- Lincolnshire Partnership NHS Foundation Trust – RP7 (Deteriorated by 0.38 points from Q3): Deterioration against staff survey metrics
Annex A – Acute trust funnel plot
Lower average metric score change is better.
Annex B – Mental health and community trust funnel plot
Lower average metric score change is better.
Annex C – Ambulance trust funnel plot
Lower average metric score change is better.