
Foreword
Through the ambitions of the People Plan and the People Promise, the NHS declared a commitment to creating and maintaining a compassionate and inclusive culture where diversity is valued and celebrated as a critical component, and not just a desirable one.
Similarly, the Messenger review of NHS leadership published in June 2022 highlighted within its recommendations the importance of equality, diversity and inclusive leadership. Pursuing racial equality in the NHS is a core component of making these ambitions a reality and must span the entirety of the NHS. Creating a compassionate and inclusive culture is the responsibility of us all, particularly of our leaders, and requires concerted action to change structures and processes which embed discrimination and to challenge inequality wherever we see it.

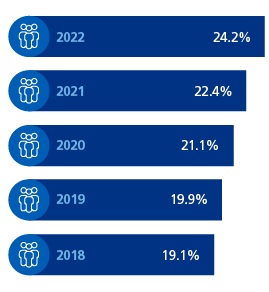
Getting this right is a priority and the need strengthened by the positive increase in the last year in the number of black and minority ethnic (BME) staff in the workforce – an increase of 27,500, with representation within the workforce now at 24.2%.
Evidence increasingly suggests an association between staff experience and patient outcomes, meaning there is not just a moral case for improving the experience of our colleagues from minority communities and backgrounds – it also benefits patients, productivity and performance. For example, the percentage of staff believing that their trust provides equal opportunities for career progression or promotion (WRES indicator 7) is a predictor of higher levels of patient satisfaction. With the data this year showing that only 35% of staff from a black background share this belief, the case for improving this number – and thereby improving patient satisfaction is clear. Work to improve the inclusivity of recruitment and promotion practices has shown promising results in some regions, notably the south east; our challenge is now replicating these successes so that the welcome change in this indicator (from 1.61 in 2021 to 1.54 in 2022) becomes a downward trend.

The data this year also reveals differences by gender and ethnicity, but also between clinical and non-clinical roles. Disaggregating data in this way will support systems and employers to target local interventions on specific issues, for example gender and ethnicity pay gaps. The presentation of the data also recognises organisations where sustained progress has been made, to encourage the sharing and adoption of successful policies and practice.
As with clinical variation, it is just as important to eliminate significant, unwarranted variation in race equality. WRES data continues to be an important tool to inform actions at national, regional and local level to reduce disparities and inequalities. We must continue to be curious about the data and bold in our efforts to create positive change so that all our colleagues from BME backgrounds have an equal and positive experience at work.
Key findings
Summary of WRES indicators for NHS trusts in England: 2016–2022
There has been a big jump in the number of BME staff. An increase of over 27,500 was seen in the last year, with BME representation in the workforce increasing from 22.4% to 24.2%.
Since 2018 the number of BME staff has increased by over 100,000 (with BME representation increasing from 19.1% to 24.2%). An increase in internationally educated nurses (IENs) and international medical graduates (IMGs) is likely to be a significant contributor to this. Although BME representation increased by 1.8% percentage points from 22.4% to 24.2%.
- As at 31 March 2021, 22.4% (309,532) of staff working in NHS trusts in England were from a BME background. This is an increase from 19.1% in 2018. There were 74,174 more BME staff and 71,296 more white staff in 2020 compared to 2018.
- The total number of BME staff at very senior manager level has increased by 69.7% since 2018 from 201 to 341.
- 93.5% – the proportion of trusts, where a higher proportion of BME staff compared to white staff experienced harassment, bullying or abuse from staff in the last 12 months.
- The number of BME board members in NHS trusts increased by 128 (38.1%) between 2020 and 2022.
- BME staff were 1.14 times more likely to enter the formal disciplinary process compared to white staff. This is the same as in 2021. There is a significant improvement from 2016 when the likelihood ratio was 1.56. BME staff were more than 1.25 times more likely to enter the formal disciplinary process at just under half of trusts.
- 1 in 4 staff experienced abuse or harassment from the public, and as many from other staff.
The difference is that the abuse or harassment from the public affects both white and BME staff (this varies by region).
Abuse or harassment from other staff is mostly a problem of harassment for BME staff (and is seen in all regions). - White applicants were 1.54 times more likely to be appointed from shortlisting compared to BME applicants; this is lower than 2021. There has been year-on-year fluctuation but no overall improvement over the past seven years.
- 42.8% of women from a white Gypsy or Irish Traveller background experienced harassment, bullying or abuse from patients, relatives or the public in the last 12 months.
- Women from a black background (19.8%) and women from an Arabic background (18.4%), experienced high levels of discrimination from a manager/team leader or other colleagues in the last 12 months.
- 35.4% of staff from a black background believed their trust provides equal opportunities for career progression or promotion, with levels below those of other ethnic groups since at least 2015, irrespective of gender.
Introduction
Action to improve equality must be targeted and data-driven. The WRES has evolved to provide detailed analysis to enable employers to understand how their staff experience compares with others in their region and with similar specialism. Producing disaggregated datasets is a core part of how the WRES programme is working with trust, integrated care boards (ICBs) and regional leads. A key part of this data presentation is to understand trends over time in order to provide deeper understanding of which strategies are effective in creating change.
Provider organisations in the NHS are all at different and individual stages in this journey to racial equality: there is variation according to metropolitan or rural location, size of trust, nature of organisation (specialist hospital, community trust, ambulance service, etc) and their ambition for change. No single organisation features in the top decile of all indicators, but some have shown progression on individual indicators.
In this year’s report, the new data display in Appendix B is the scatter plots for the subjective report data. This shows the best and worst performing trusts, but also allows identification of disparities by region and by trust type. For example, staff in acute trusts report highest rates of discrimination from other staff; and ambulance staff experience the highest levels of bullying and harassment from the public. Helping regionaland organisational leads have greater clarity on their particular areas of concern from the data will allow sharper focus to target the actions that need to be prioritised for action.
Methodology
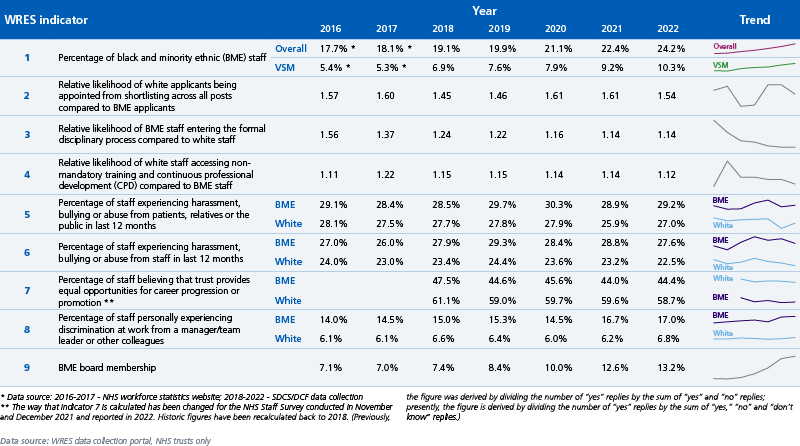
The WRES requires NHS trusts to self-assess against nine indicators of workplace experience and opportunity. Four indicators relate specifically to workforce data, four are based on data from the national NHS staff survey questions, and one considers BME representation on boards. Short definitions of the nine WRES indicators are presented in Annex A of this report.
The detailed definition for each indicator can be found in the WRES technical guidance. The technical guidance also includes the definitions of “white” and “black and minority ethnic”, as used throughout this report and within the narrative for the WRES indicators. This report presents data for all NHS trusts in England, against all nine WRES indicators, and where possible, makes comparisons to the WRES data back to 2016.
Data sources
WRES data for 2021/22 was collected through individual NHS trust submissions via the Data Collection Framework (DCF). A return rate of 100% for trusts was achieved.
Data analyses
For the purpose of data analyses and presentation, organisations have been grouped by the seven NHS geographical regions – East of England, London, Midlands, North East and Yorkshire, North West, South East and South West. Trend data analysis will be limited to 2017 data due to the better quality and reliable data starting that year.
For indicators 2, 3 and 4, statistical analyses included the “four-fifths” rule. The “four-fifths” (“4/5ths” or “80 percent”) rule is used to highlight whether practices have an adverse impact on an identified group, e.g. a subgroup of gender or ethnicity. For example, if the relative likelihood of an outcome for one sub-group compared to another is less than 0.80 or higher than 1.25, then the process would be identified as having an adverse impact.
Data caveats
- This report only contains data for NHS trusts.
- Indicator 1 data comes from two different data sources:
- 2016 and 2017 data are from the NHS workforce statistics website
- 2018 – 2022 data is from the Data Collection Framework (DCF).
- Indicator 3 (staff entering the formal disciplinary process). The calculation has been changed from using a two-year rolling average to using the year end figure. Both the numerator and denominator have changed for this calculation, thus, current figures remain comparable to historical figures.
- Four of the WRES indicators (5 to 8) are drawn from questions in the national NHS staff survey. The reliability of the data drawn from those indicators is dependent upon the overall size of samples surveyed, the response rates to the survey questions, and whether the numbers of BME staff are large enough to not undermine confidence in the data.
- For the national level staff survey based WRES indicators that compare white and BME respondents, a weighting is applied to each trust’s contribution to the national score. This weighting ensures that each trust’s results have an impact according to the number of staff employed, rather than according to the number of survey respondents. However, for the regional breakdowns, and for breakdowns looking at ethnicity in more detail or those considering ethnicity and gender, unweighted data are used and respondents are pooled across trusts without adjusting for differing trust sizes.
- Some NHS trusts may have revised their WRES data returns since their submission via DCF. The results in this report are based on the latest figures returned to NHS England via DCF and will not necessarily incorporate any updates a trust has made to WRES related publications on organisations’ websites.
- The way that indicator 7 is calculated has been changed for the NHS Staff Survey conducted in November and December 2021 and reported in 2022. Historic figures have been recalculated back to 2017. (Previously, the figure was derived by dividing the number of “yes” replies by the sum of “yes” and “no” replies; presently, the figure is derived by dividing the number of “yes” replies by the sum of “yes,” “no” and “don’t know” replies.)
WRES indicator 1
Percentage and number of staff in NHS trusts by ethnicity
National, March 2022
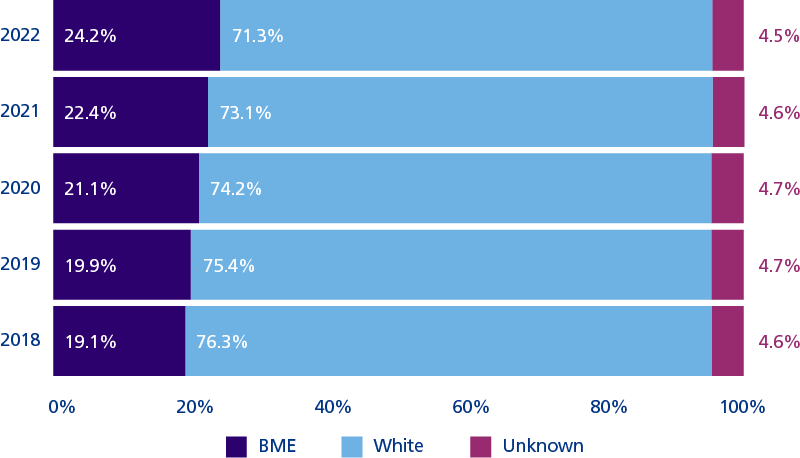
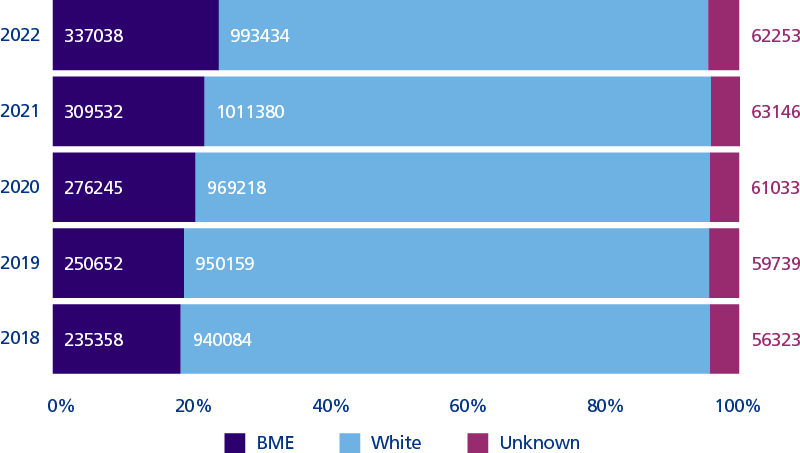
In March 2022, 24.2% of the workforce across NHS trusts came from a BME background (337,038 people).
Across all NHS trusts there were 101,680 more BME staff in 2022 compared to 2018 (equating to 43.2%). Over the same period, the number of white staff increased by 53,350 (equating to 5.7%).
Percentage and number of staff in NHS trusts by ethnicity; regional breakdowns
Regional, March 2022
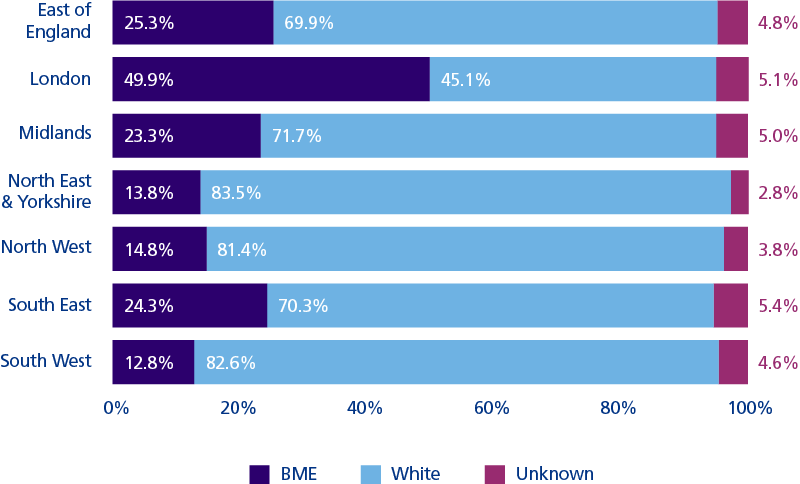
Figure 3
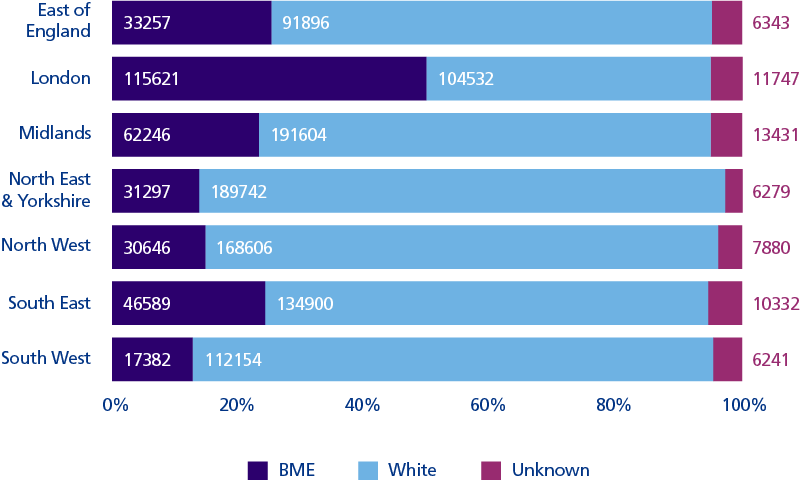
Figure 4
London had the highest percentage of BME staff at 49.9%, whilst the South West had the lowest percentage of BME staff at 12.8%.
Over a third of all BME NHS staff work in the London region; in comparison, a sixth of the overall NHS workforce in England is situated in London.
Percentage representation by ethnicity at each Agenda for Change (AfC) pay band, for staff in NHS trusts
National, March 2022
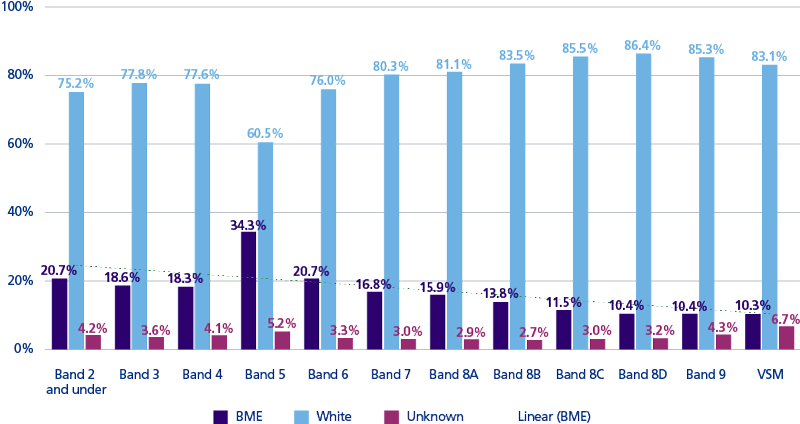
Figure 5
Overall % BME workforce
34.3% of the workforce at AfC band 5 was from a BME background. BME representation fell after AfC band 5 to a low of 10.3% at the Very Senior Manager level.
The sustained non-disclosure rates of approx. 4% is especially notable at the highest and lowest bands, potentially skewing that data more.
Percentage representation by ethnicity at each AfC pay band, amongst non-clinical staff in NHS trusts
National, March 2022
Non-clinical staff
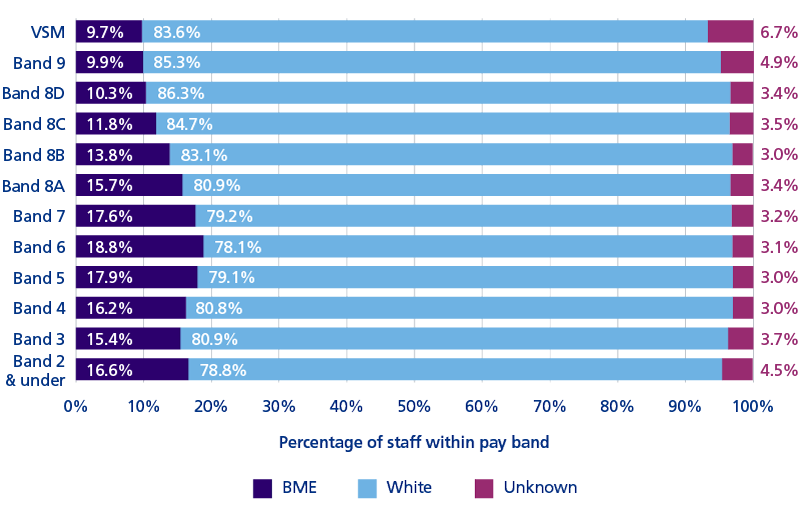
Figure 6. AfC bands: non-clinical (percentage representation)
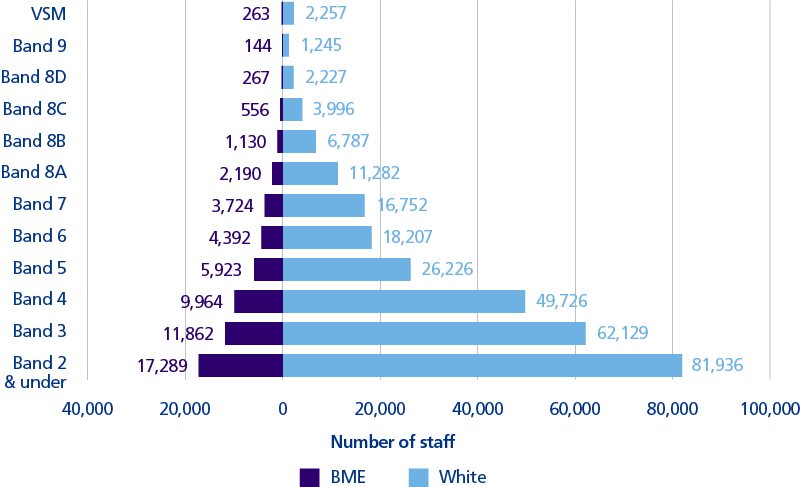
Figure 7. AfC bands: non-clinical (headcount)
In non-clinical roles, BME representation was at 16.3% overall. BME representation peaked at 18.8% at AfC band 6, underrepresentation occurs from AfC band 8A (15.7%) and above.
BME representation fell from band 8a and above to a low of 9.7% at Very Senior Manager level.
Percentage representation by ethnicity at each AfC pay band, amongst clinical staff outside of doctors, in NHS trusts
National, March 2022
Clinical staff outside of medicine
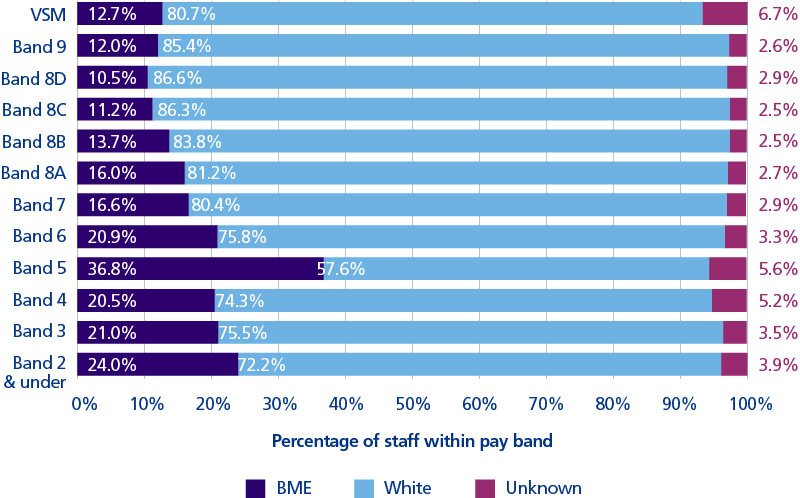
Figure 8. AfC bands: Clinical (percentage representation)
In clinical roles outside of medicine, BME representation was at 24.2% overall. The clinical workforce can be considered in two sections. Staff at AfC band 4 and under, including health care support workers and nursing assistants, and staff at AfC band 5 and above, mainly registered nurses, but also including staff such as physiotherapists, psychologists and pharmacists.
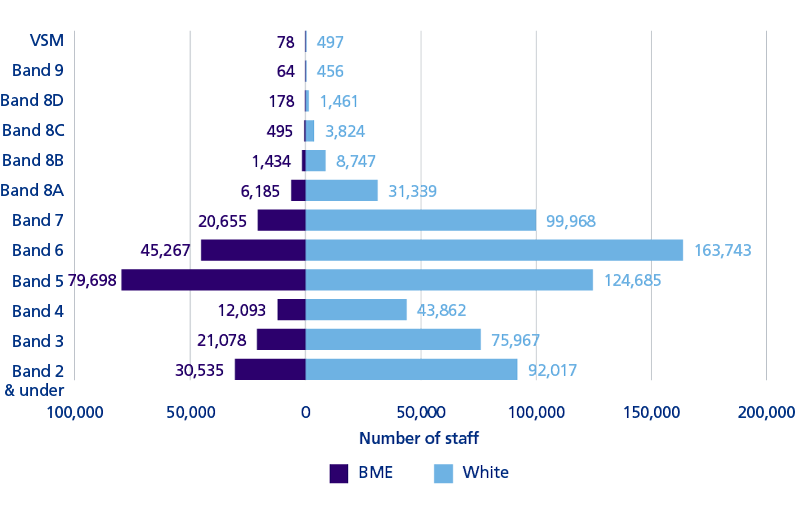
Figure 9. AfC bands: Clinical (headcount)
BME representation was highest at clinical AfC band 5 (36.8%) the base grade for registered nurses. Progression above that falls dramatically, to 20.9% at AfC band 6 and 16.6% at AfC band 7, levels that include charge nurses and nurse managers.
Percentage representation by ethnicity and level of seniority for doctors in NHS trusts
National, March 2022
Medical staff
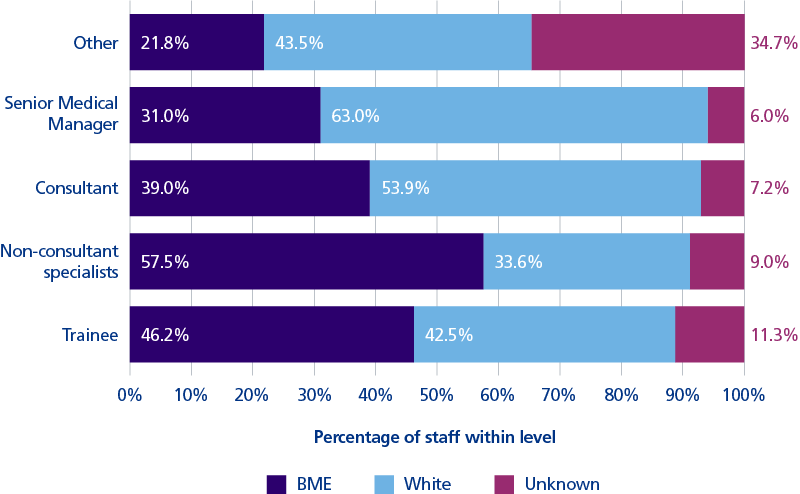
Figure 10. Medical (percentage representation)
Within medicine BME representation was at 44.3% overall.
BME representation peaked in non consultant grades at 57.5%, falling to 39.0% amongst consultants, falling further to 31.0% amongst senior medical managers.
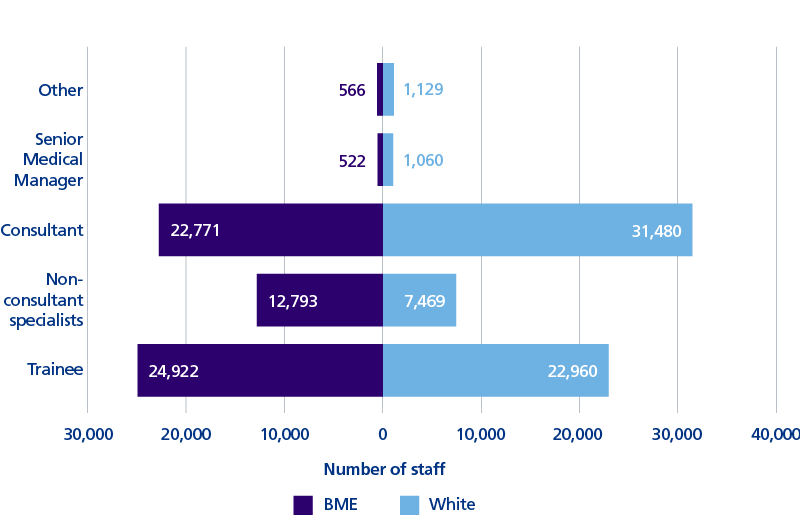
Figure 11. Medical (headcount)
Race disparity ratios
National, March 2022, AfC staff
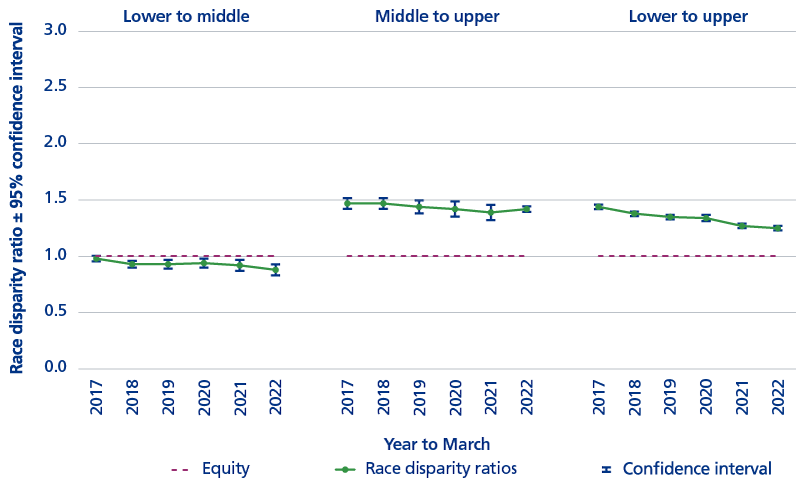
Figure 12. Non-clinical (White/BME)
The disparity ratio is a reflection of staff distribution in terms of representation through the AfC pay bands, comparing BME with white staff. Lower bands refer to band 5 and below, middle bands 6 and 7, higher bands 8a and above. A ratio of 1 reflects parity of progression, and values higher than ‘1’ reflect inequality, with a disadvantage for BME staff.
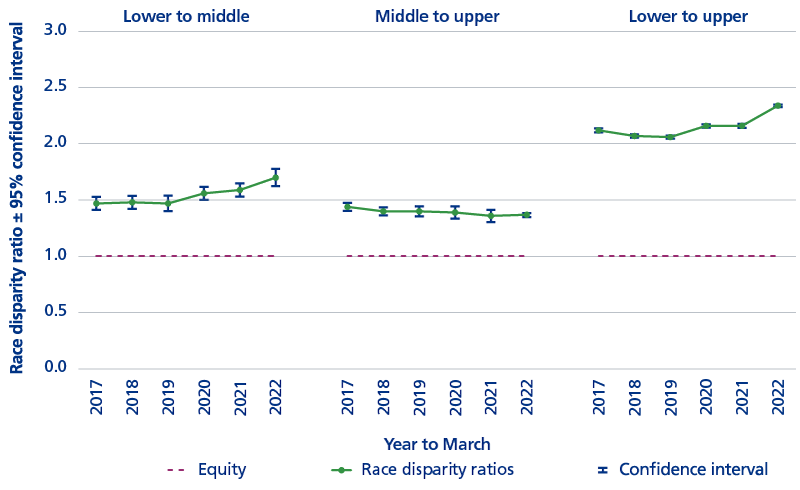
Figure 13. Clinical (White/BME)
In non-clinical roles, the gap between BME and white representation has been decreasing each year in terms of the lower to upper levels. However, in clinical roles (outside of medicine), the gap between BME and white progression has been widening over the past three years, particularly in terms of the lower to middle levels.
Race disparity ratios
Regional, March 2022, AfC staff
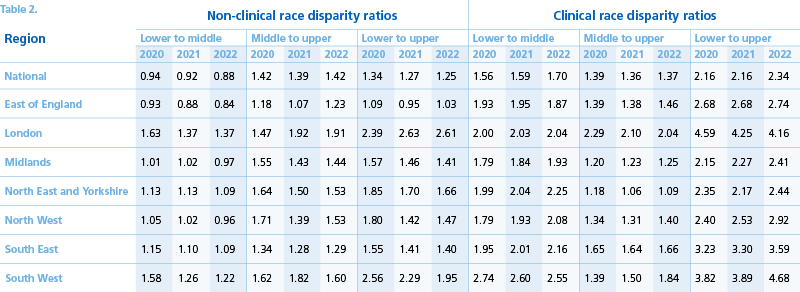
There were regional variations in the race disparity ratios. Race disparity ratios were higher, reflecting greater inequality, in clinical staff roles. This is most striking in clinical roles, where the particular issue is with progression from band 5 to 6 and above.
The highest levels of disparity were seen in the London and South West regions, respectively the regions with the largest and smallest BME representation. These two regions have a four- to almost five-fold disparity in the representation of BME clinical staff at higher levels compared to the lower bands.
WRES indicator 2
The relative likelihood of white applicants being appointed from shortlisting compared to BME applicants
National and regional, March 2022
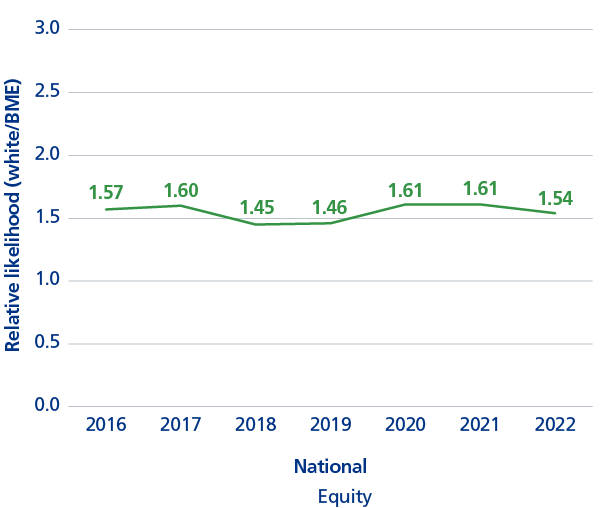
Figure 14
At 72% of trusts white applicants were significantly more likely than BME applicants to be appointed from shortlisting. This is similar to the 71.5% last year, and it is clear that there are trends which differ between regions, with year on year improvements in South East and North West, and progressive deterioration in East of England and North East & Yorkshire.
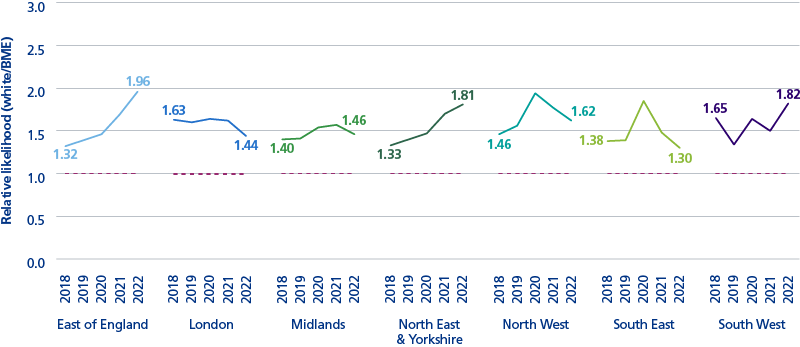
Figure 15
Recruitment from interview remains the most difficult to change metric, with the likelihood ratio not having changed much since the inception of the WRES. The SE region is the one that bucks the trend on this indicator with a continuing improvement.
WRES indicator 3
The relative likelihood of BME staff entering the formal disciplinary process compared to white staff
National and regional, March 2022
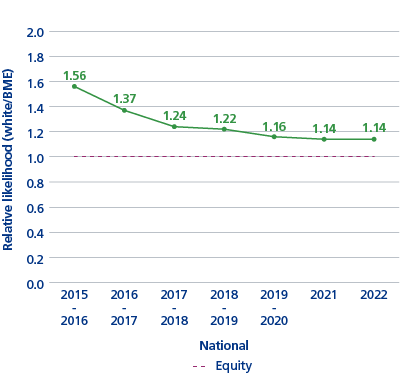
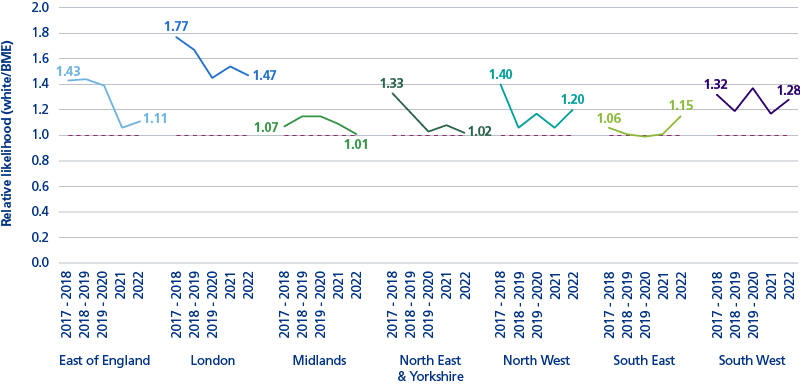
Figure 17
At just under half of NHS trusts BME staff were more than 1.25 times more likely than white staff to enter the formal disciplinary process similar to last year.
London region is consistently the most challenged in this indicator. The East of England has maintained the improvements it made last year.
WRES indicator 4
The relative likelihood of white staff accessing non–mandatory training and CPD compared to BME staff
National and regional, March 2022
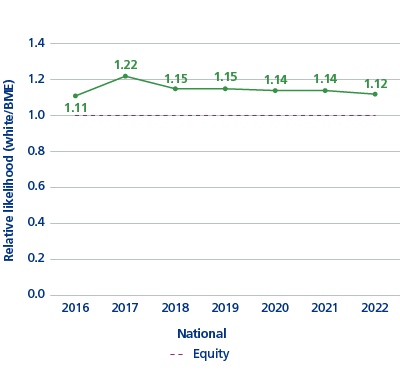
Figure 18
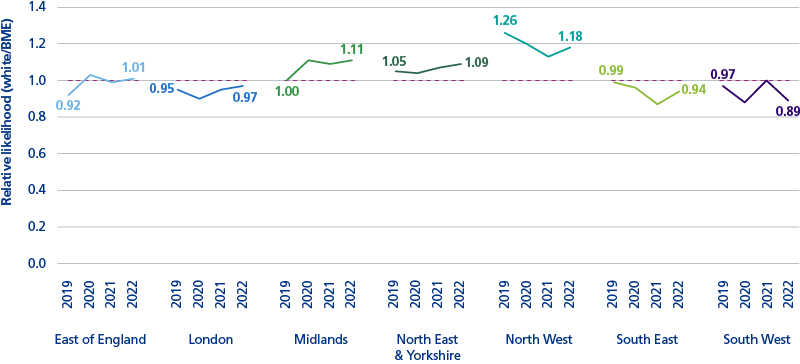
Figure 19
For all regions the indicator fell within the non-adverse range of 0.80 to 1.25.
WRES indicator 5
Percentage of staff experiencing harassment, bullying or abuse from patients, relatives or the public in last 12 months: 2015 – 2021
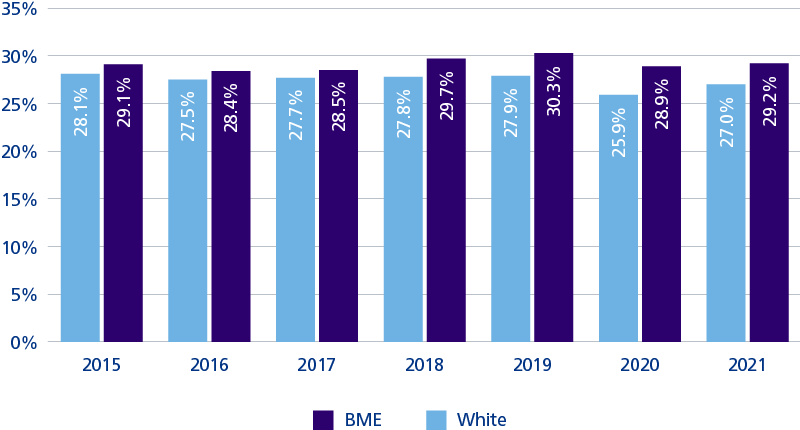
Figure 20
For 71.5% of trusts, a higher proportion of BME staff compared to white staff experienced harassment, bullying or abuse from patients, relatives or the public in the last 12 months. This figure was 72.3% in 2020.
In 2021, a higher percentage of BME staff (29.2%) than white staff (27.0%) have been harassed, bullied, or abused by patients, family, or the general public; a pattern that has been evident since at least 2015. In 2020, levels dropped for both BME staff and White staff, potentially reflecting a reduction in the amount of face-to-face contact between NHS service users and NHS staff during the COVID-19 pandemic. However, in 2021, levels of harassment, bullying, or abuse by patients increased to near pre-pandemic levels.
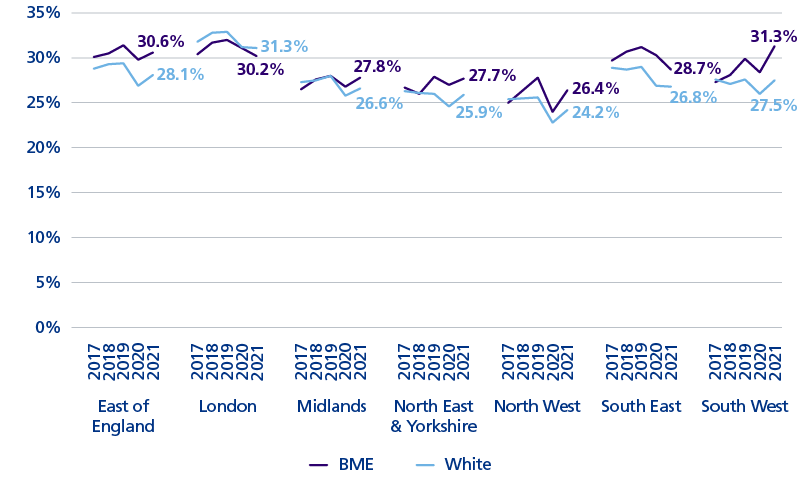
Figure 21
It remains a concern that more than 1 in 4 staff of any ethnicity experience abuse or harassment from the public, and that there is an upward trend for this in most regions.
In all regions except London, a higher percentage of BME staff than white staff have been harassed, bullied, or abused by patients, relatives or the general public. The East of England, Midlands, North East and Yorkshire, North West, and South West regions each exhibited a post-pandemic increase in the levels of harassment, bullying, or abuse by service users.
Ethnicity and gender in detail, 2021 NHS staff survey
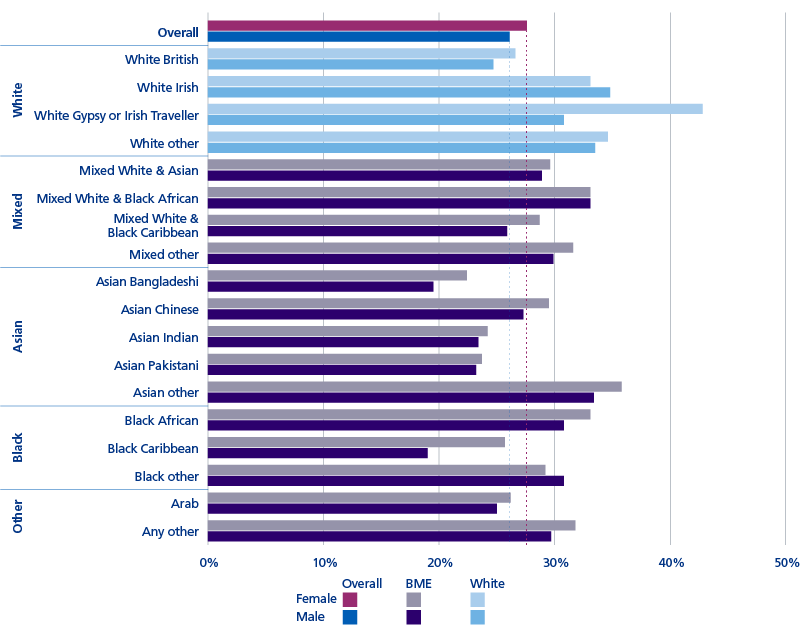
Figure 22
Women (27.6%) were more likely than men (26.1%) to have experienced harassment, bullying or abuse from patients, relatives or the public in the last 12 months.
42.8% of women from a white Gypsy or Irish Traveller background experienced harassment, bullying or abuse from patients, relatives or the public in the last 12 months.
Women (33.1%) and men (33.1%) from mixed white and black African backgrounds, women (35.8%) and men (33.4%) from “other” Asian backgrounds, and women from black African backgrounds (33.1%) also experienced high levels of abuse from patients, relatives or the public in the last 12 months.
Ethnicity, gender and profession, 2015 to 2021 NHS staff surveys
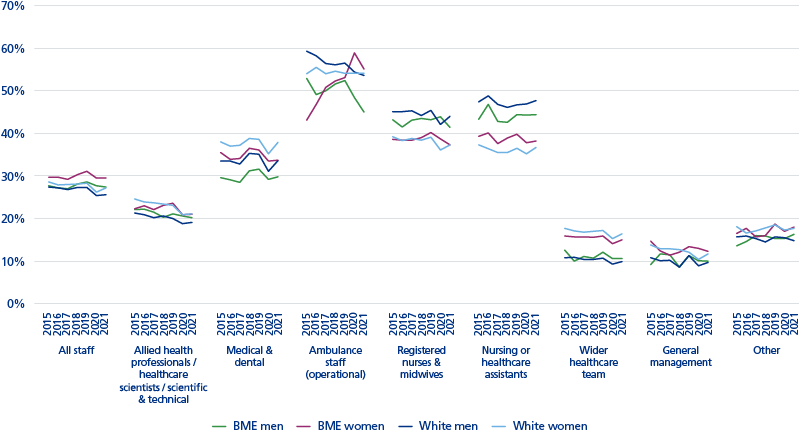
Figure 23
BME women (29.5%) were most likely to have experienced harassment, bullying or abuse
from patients, their relatives or the general public in the last 12 months, a trend that has been evident since at least 2015.
Ambulance (operational) staff (53.7%) experienced the highest level of harassment, bullying or abuse from patients, relatives or the public in the last 12 months.
Meanwhile, amongst registered nurses, white men (44.0%) and BME men (41.4%) were more likely to experience harassment, bullying or abuse from patients, their relatives or the general public in the last 12 months than their female colleagues. A similar trend was seen amongst nursing or healthcare assistants for white men (47.7%) and BME men (44.4%).
WRES indicator 6
Percentage of staff experiencing harassment, bullying or abuse from staff in last 12 months: 2015 – 2021
For 93.5% of trusts, a higher proportion of BME staff compared to white staff experienced harassment, bullying or abuse from staff in last 12 months. This figure was 92.7% in 2020.
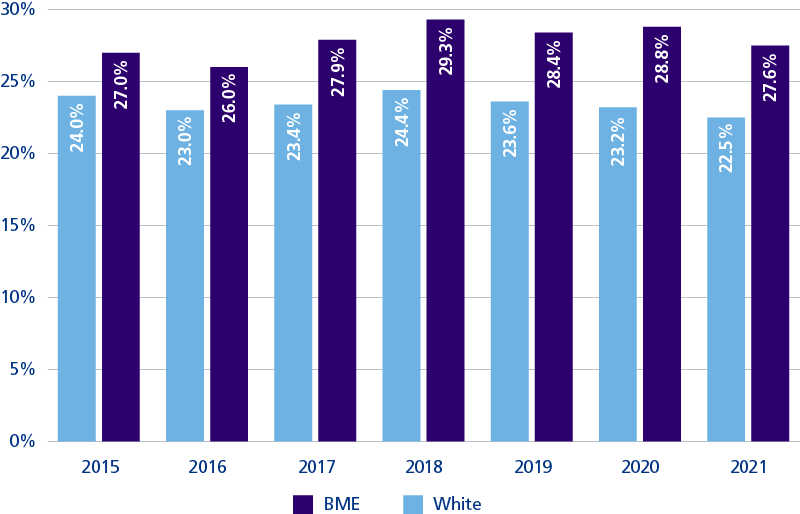
Figure 24
The percentage of staff experiencing harassment, bullying or abuse from other staff in the last 12 months was higher for BME staff (27.6%) than for white staff (22.5%) in 2021. This pattern has been evident since 2015.
Although disparities between the experiences of BME and white staff persist, harassment, bullying and abuse from staff has dropped since last year, and is at its lowest level since 2017.
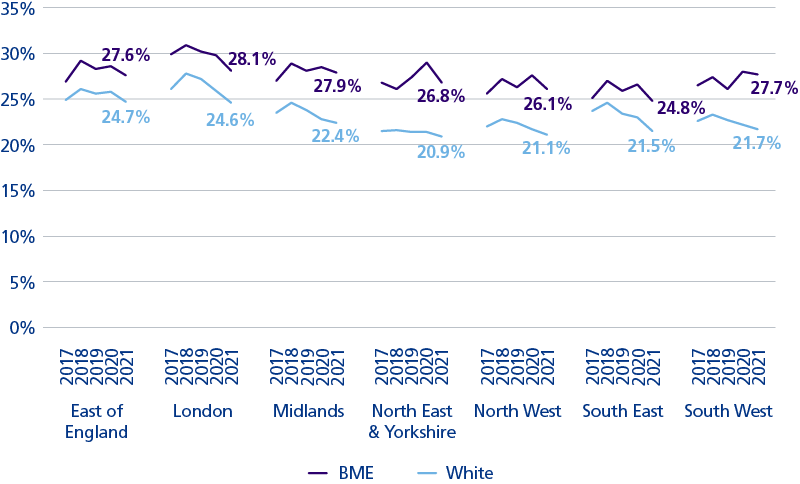
Figure 25
At regional level the proportion of BME and white staff experiencing harassment, bullying or abuse from other staff in the last 12 months dropped in all regions.
However, as with the data on experiencing abuse or harassment from the public, it is clear that a similar proportion of staff endure similar treatment from peers. How this differs from that data is that the experience of BME staff is uniformly worse than white colleagues.
Percentage of staff experiencing harassment, bullying or abuse from staff in last 12 months
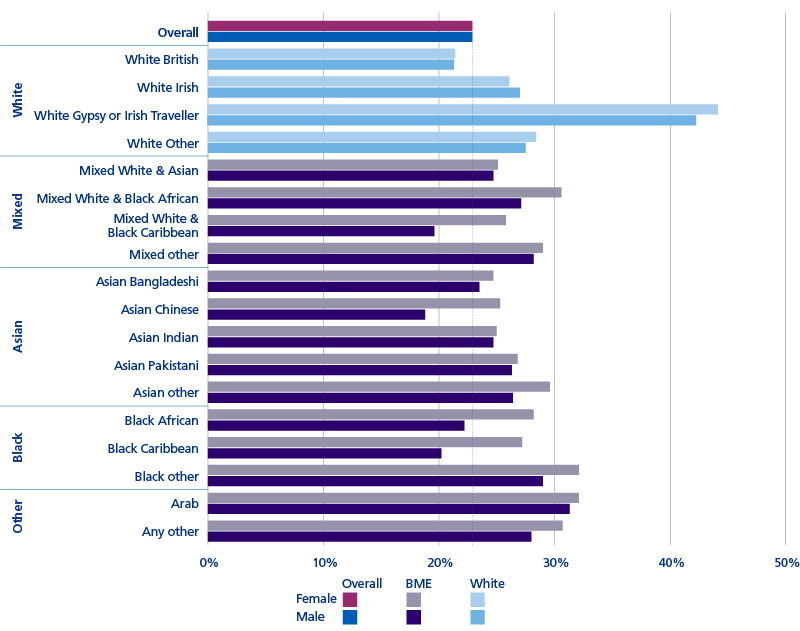
Figure 26. Ethnicity and gender in detail, 2021 NHS staff survey
Women (22.9%) and men (22.9%) were equally likely to have experienced harassment, bullying or abuse from other staff in last 12 months.
White Gypsy or Irish Traveller women (44.2%) and men (42.3%) experienced the highest levels of harassment, bullying or abuse from other staff.
Women from a mixed white and black African backgrounds (30.6%), women from “other” black backgrounds
(32.1%), and women from Arabic backgrounds (32.1%) also experienced high levels of abuse.
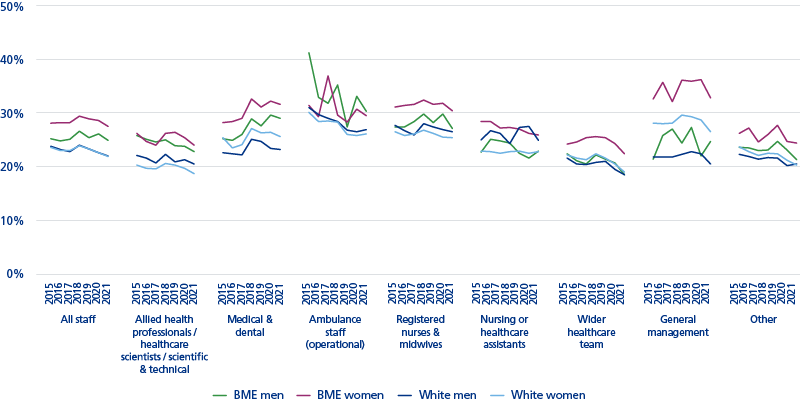
Figure 27. Ethnicity, gender and profession, 2015 to 2021 NHS staff surveys
BME women (27.5%) were most likely to have experienced harassment, bullying or abuse from other staff in the last 12 months, a trend that has been evident since at least 2015. This trend was especially evident for BME women in general management (32.8%), medical and dental (31.6%), and registered nursing and midwifery (30.4%).
WRES indicator 7
Percentage of staff believing that their trust provides equal opportunities for career progression or promotion*
At 99.5% of trusts, a lower percentage of BME staff than white staff felt that their trust provides equal opportunities for career progression or promotion. The figure was 98.6% in 2020.
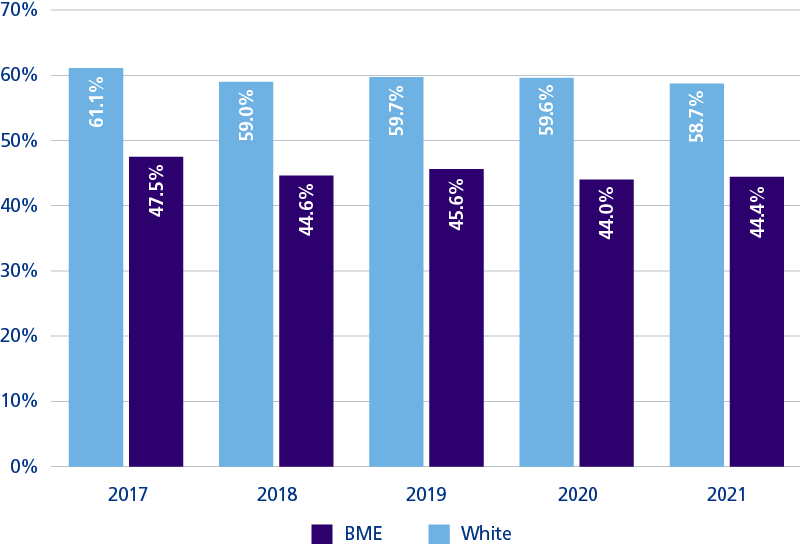
Figure 28
A lower percentage of BME staff (44.4%) than white staff (58.7%) felt that their trust provides equal opportunities for career progression or promotion; a pattern that has been evident since at least 2017 (and at least 2015 based on the previous version of this indicator*).
Overall, the percentage of staff who felt that their trust provides equal opportunities for career progression or promotion has dropped over the past five years, irrespective of ethnicity.
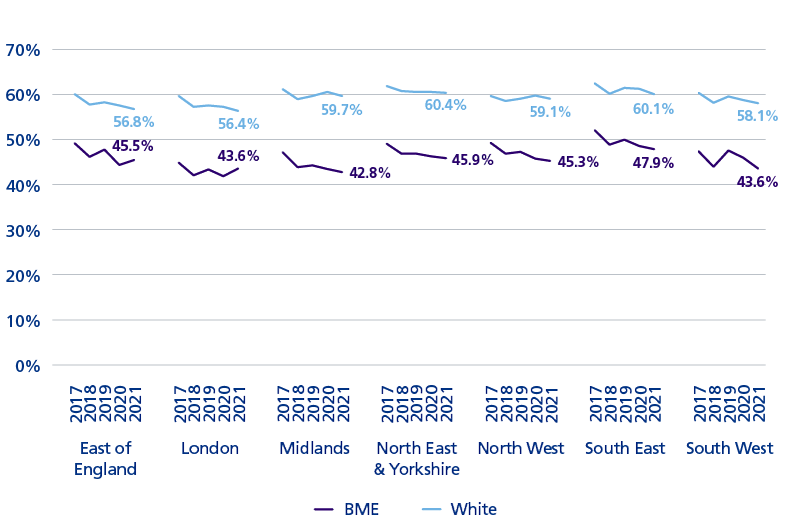
Figure 29
In all regions, a lower percentage of BME staff than white staff felt that their trust provides equal opportunities for career progression or promotion.
Percentage of staff believing that their trust provides equal opportunities for career progression or promotion
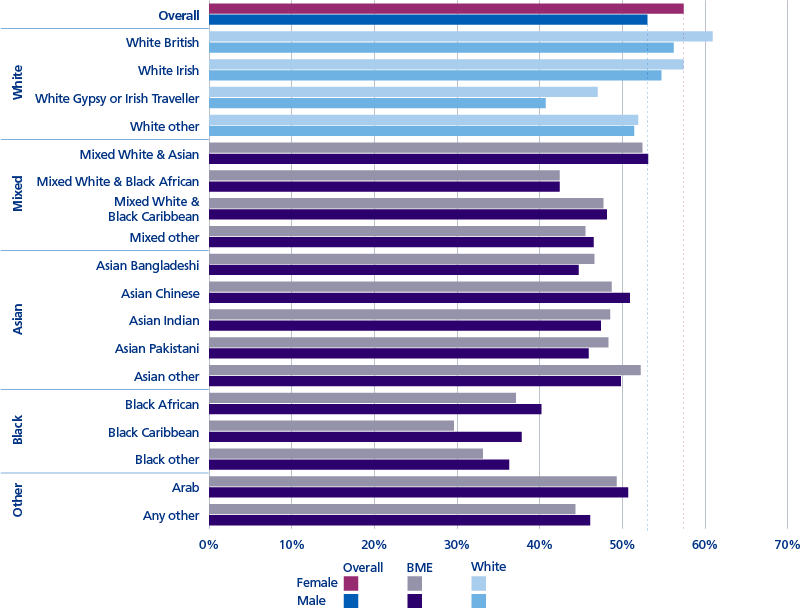
Figure 30. Ethnicity and gender in detail, 2021 NHS staff survey
Men (53.0%) were less likely than women (57.4%) to believe that their trusts provide equal opportunities for career progression or promotion.
Just 35.4% of staff from a black background believed their trust provides equal opportunities for career progression or promotion, with levels below those of other ethnic groups since at least 2015, irrespective of gender.
Only 41.4% of staff from a white Gypsy or Irish Traveller background believed that their trusts provides equal opportunities for career progression or promotion.
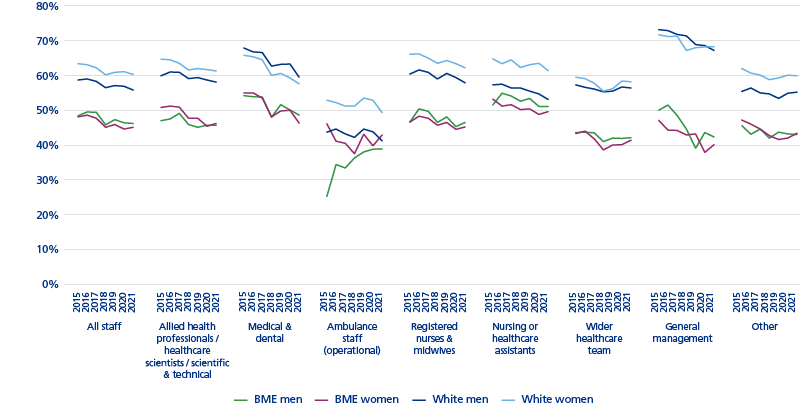
Figure 31. Ethnicity, gender and profession, 2015 to 2021 NHS staff surveys
As a profession, ambulance staff (operational) were least likely to believe that their trust acts fairly with regards to career progression and promotion (53.7%); with especially low levels of belief amongst BME women (42.9%), BME men (38.9%), and white men (41.2%) in this profession.
BME women (41.4%) and BME men (42.1%) in the wider healthcare team also expressed especially low levels of belief, as did BME women (40.1%) and BME men (42.3%)
in general management. In the latter group of staff, the difference between BME and white staff was the most stark.
WRES indicator 8
Percentage of staff experiencing discrimination at work from other staff in the last 12 months
At all trusts, a higher percentage of BME staff than white staff experienced discrimination from a manager/team leader or other colleagues in last 12 months. In 2020 it was 98.6% of trusts.
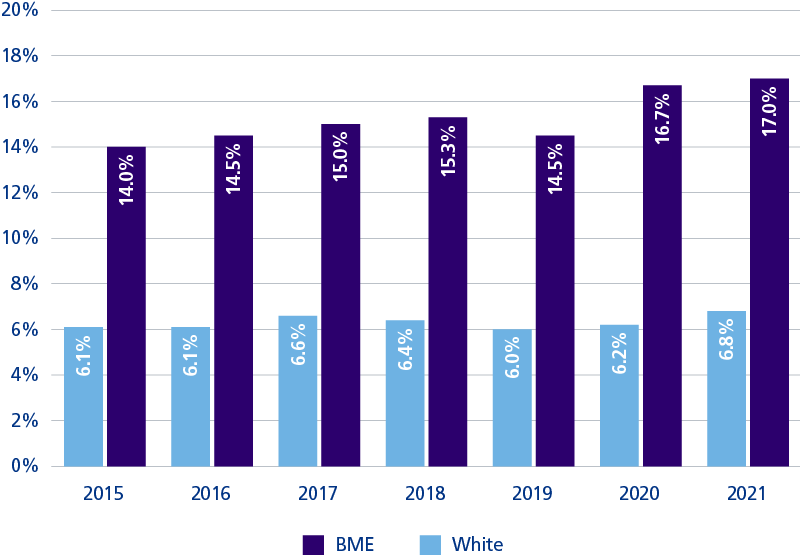
Figure 32
A higher percentage of BME staff (17.0%) than white staff (6.8%) experienced discrimination from other staff; a pattern that has been evident since at least 2015.
The percentage of BME staff who experienced discrimination from other staff increased markedly between 2019 and 2020, and continued to rise in 2021 reaching its highest level since at least 2015.
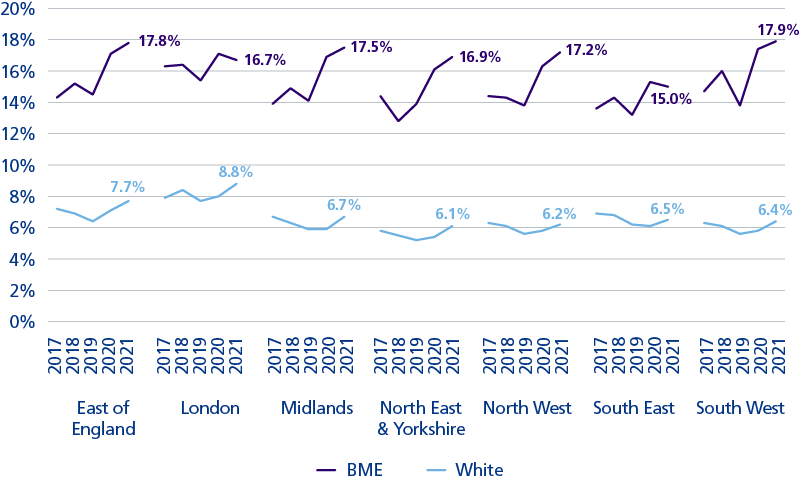
Figure 33
The percentage of BME staff who experienced discrimination from other staff increased markedly in all regions between 2019 and 2020, and remains at an elevated level in all regions at 2021.
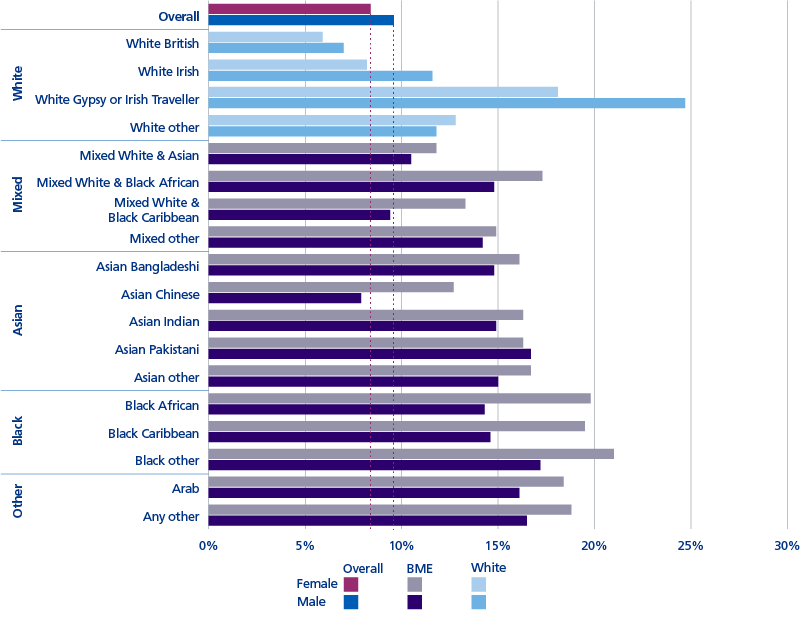
Figure 34. Ethnicity and gender in detail, 2021 NHS staff survey
Men (9.6%) were more likely than women (8.4%) to have experienced discrimination from a manager/team leader or other colleagues in last 12 months.
Men from a white Gypsy or Irish Traveller (24.7%) background were most likely to have experienced discrimination from other colleagues, although levels were also high for women from this background (18.1%).
Women from a black background (19.8%), women from a mixed white and black African background (17.3%) and women from an Arabic background (18.4%), experienced high levels of discrimination from
a manager/team leader or other colleagues in last 12 months.
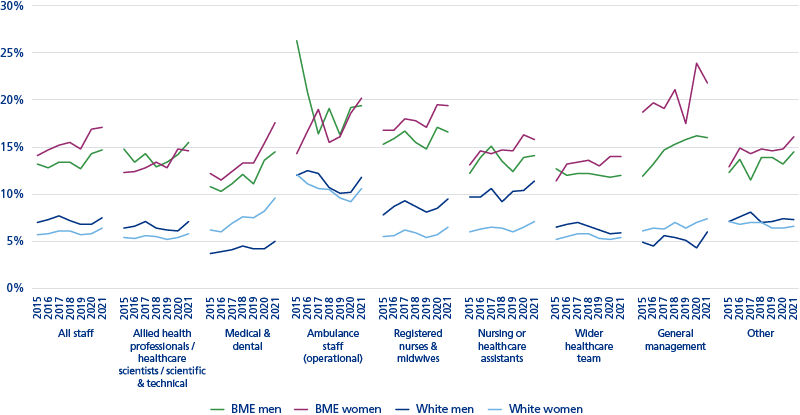
Figure 35. Ethnicity, gender and profession, 2015 to 2021 NHS staff surveys
BME women (17.1%) were most likely to have experienced discrimination from other staff in the last 12 months, a trend that has been evident since at least 2015. However, rates were also high amongst BME men (14.7%).
21.8% of BME women in general management and 19.4% of registered nursing and midwifery staff experienced discrimination from a manager/team leader or other colleagues in last 12 months.
Increasing numbers of staff completing the survey alters the percentage values that are seen, as with the BME men ambulance figures.
Registered nurses and midwives
Indicator 5: Percentage of staff experiencing harassment, bullying or abuse from patients, relatives or the public
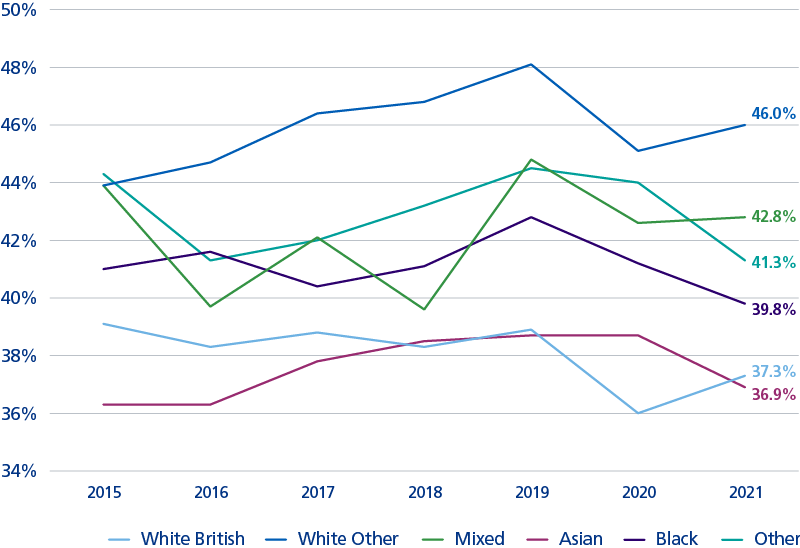
Figure 36
Nurses from “other” white backgrounds experienced the highest levels of harassment, bullying or abuse from patients, relatives or the public, but levels were also high for nurses from mixed, Black British, and “other” backgrounds.
Indicator 6: Percentage of staff experiencing harassment, bullying or abuse from staff
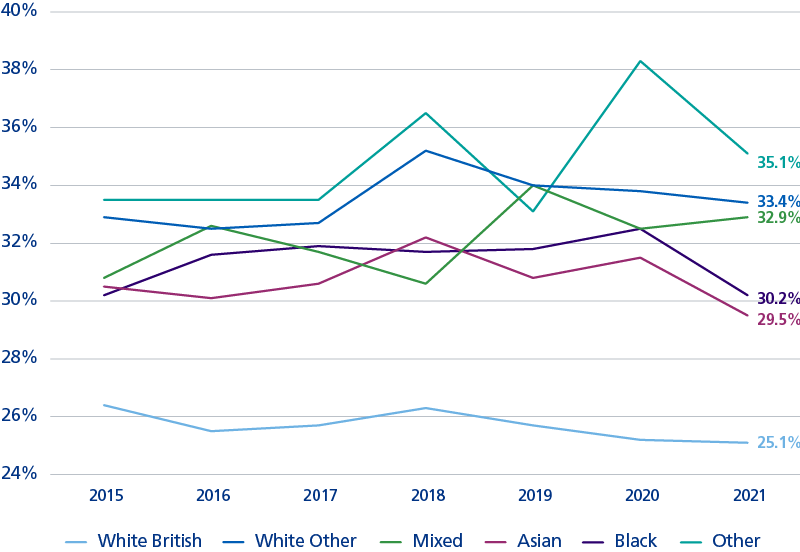
Figure 37
Nurses from all BME backgrounds and from “other” white backgrounds experienced high levels of harassment, bullying or abuse from staff.
Indicator 7: Percentage of staff believing that organisation provides equal opportunities for career progression or promotion
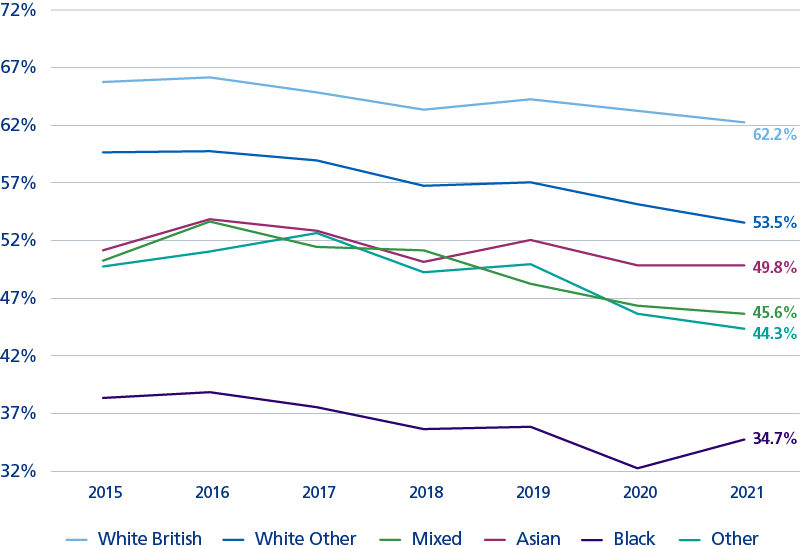
Figure 38
Black British nurses were least likely to feel that their organisation provides equal opportunities for career progression or promotion, but levels were also low for nurses from all BME backgrounds and from “other” white backgrounds.
Indicator 8: In the last 12 months have you personally experienced discrimination at work from staff
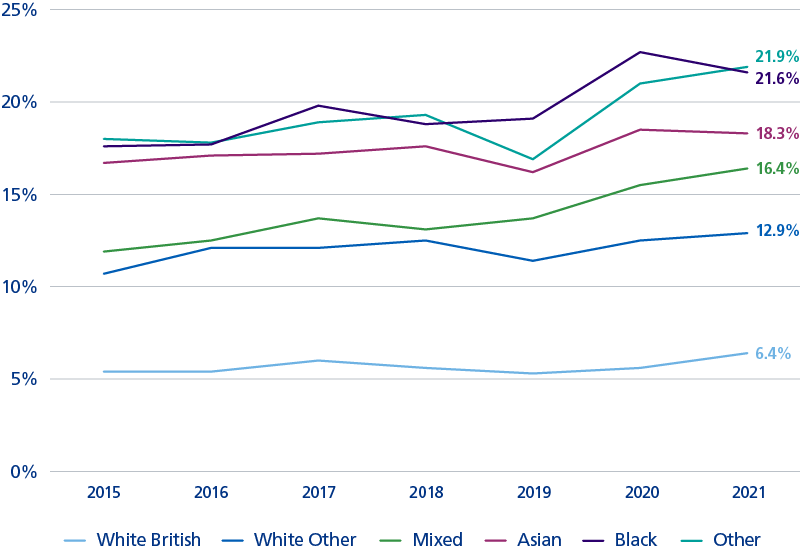
Figure 39
Black British nurses and those from “other” backgrounds were most likely to suffer discrimination from staff, but levels were also high for nurses from all BME backgrounds and from “other” white backgrounds.
In terms of staff experience, it is striking that there is heterogeneity in the experience of BME staff. Most notably for nurses and midwives, the largest part of the workforce, there is a striking disadvantage experienced by black staff who feel the least equality of opportunity and are the largest victims of discrimination.
WRES Indicator 9
The representation of BME people amongst board members
National and regional, March 2022
Nationally, 13.2% of board members recorded their ethnicity as BME, representing an increase of 38.1% (128 individuals) compared to 2021. This 13.2% BME board membership compares with 24.2% BME staff in NHS trusts.
Historic figures have been recalculated in light of amendments made by NHS trusts
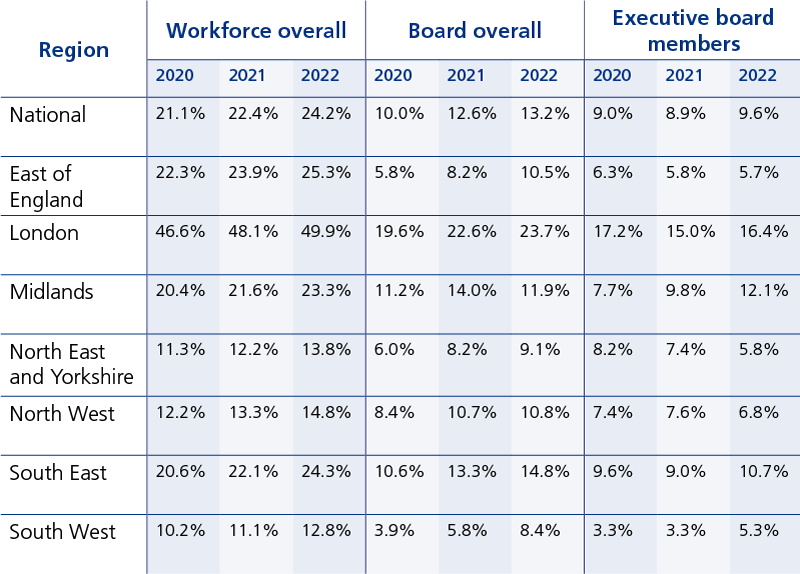
Table 3
In all regions, there was a lower proportion of BME board members compared to the overall percentage of BME staff in the workforce. Although the percentage of board members recording their ethnicity as BME has increased year-on-year at a national level, there were regional variations. London, with almost 50% BME workforce shows the largest disparity with board membership, but a negative trend is seen in all regions.
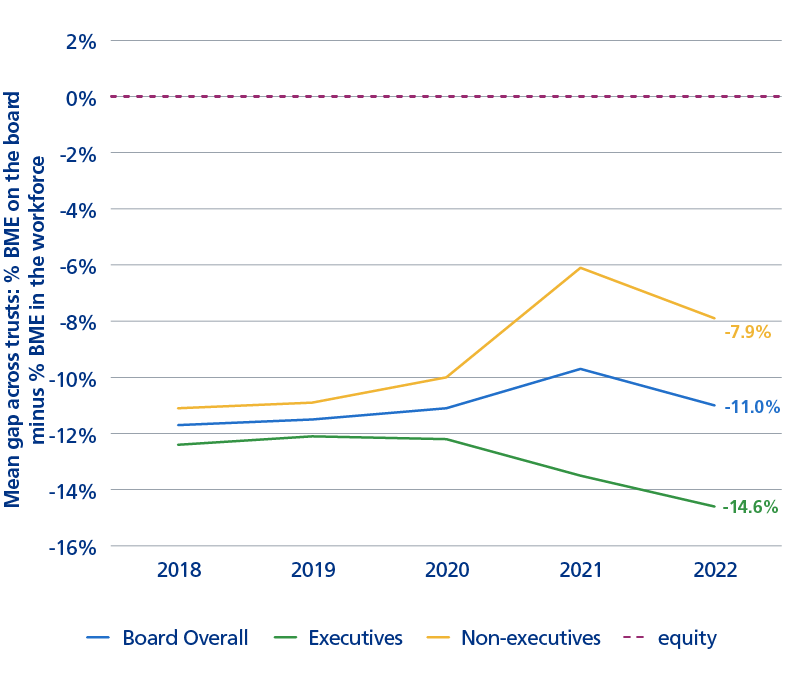
Figure 40
At national level, the rate of increase in the percentage of board members recording their ethnicity as BME was below the rate of increase in the percentage of BME staff in the NHS workforce overall. Consequently, the gap between BME representation on boards and BME representation in workforces has increased from -9.7% in 2021 to -11.0% in 2022. The gap was especially large amongst executive board members at -14.6%.
The representation of BME people amongst all board members compared to the workforce overall
National and regional, March 2022

Figure 41
Nationally, 13.2% of board members recorded their ethnicity as BME, compared to 24.2% of staff in NHS trusts, a gap of 11.0%. In all regions, there was a lower proportion of BME board members compared to the overall percentage of BME staff in the workforce. The percentage of board members recording their ethnicity as BME has increased year-on-year at a national level, and in all regions except the Midlands. London, with almost 50% BME representation in its workforce, had the largest disparity between BME representation in its workforce and at board level, with a gap of 26.1%. At national level, the rate of increase in the percentage of board members recording their ethnicity as BME was below the rate of increase in the percentage of BME staff in the NHS workforce overall. Consequently, the gap between BME representation on boards and BME representation in workforces has increased from 9.7% in 2021 to 11.0% in 2022. However, the pattern varies for non-executive and executive directors, with a larger and increasing gap for executive directors in particular, as discussed over the next two pages.
Historic figures have been recalculated in light of amendments made by NHS trusts
The representation of BME people amongst executive board members compared to the workforce overall
National and regional, March 2022
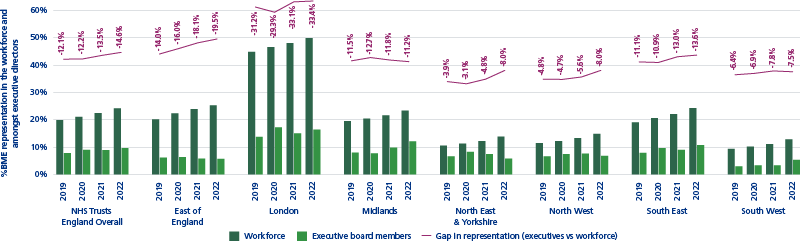
Figure 42
9.6%, of executive directors recorded their ethnicity as BME (lower than the 16.3% for non-executive directors). This represents an increase in BME representation amongst executive directors compared to 2021, when representation was at 8.9%. However, as with non-executive directors, the gap between BME representation in the workforce and on the board has increased, from 13.5% to 14.6%, again reflecting larger increases in BME representation in the workforce (from 22.4% to 24.2%). Unlike amongst non-executive directors, the gap between percentage BME representation amongst executive directors and percentage BME representation in the workforce has increased year-on year since 2019, nationally and in all regions except the Midlands.
Historic figures have been recalculated in light of amendments made by NHS trusts.
The representation of BME people amongst non-executive board members compared to the workforce overall
National and regional, March 2022
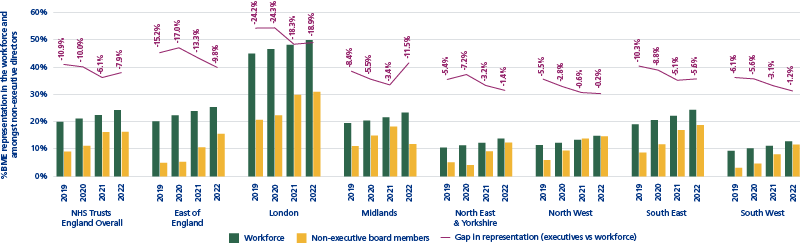
Figure 43
16.3% of non-executive directors recorded their ethnicity as BME in 2022, similar to the 16.2% seen in 2021. However, the gap between BME representation in the workforce and amongst non-executive board members has increased from 6.1% to 7.9%, reflecting larger increases in BME representation in the workforce (from 22.4% to 24.2%). Nonetheless, since 2019, the gap between percentage BME representation amongst non-executive directors and percentage BME representation in the workforce has decreased, nationally and in all regions except the Midlands.
Historic figures have been recalculated in light of amendments made by NHS trusts.
Conclusion and next steps
The WRES has an important role to play in assigning accountability for action and measuring the impact of that action. In October this year, the new operating framework for NHS England was published. The framework describes the responsibility of NHS England in supporting integrated care boards (ICBs), NHS providers and their local partners to deliver their plans. Data such as the WRES will be central to NHS England’s approach to supporting performance improvement and delivery, alongside sharing good practice from systems and organisations who are performing well. The graphs in Appendix A display the distribution of how trusts perform on the individual WRES indicators, but also identify which organisations which are achieving equity, and can be exemplars to learn from.
The challenges we face in improving equality and inclusion are as diverse as the communities which make up the NHS workforce, and diverse challenges require diverse solutions. The introduction of ICBs provides the opportunity for creating an environment of innovation and research, and the WRES supports this ambition by providing nuanced data to enable systems and employers to develop bespoke solutions, targeting their action on the issues of race equality most pertinent to them. System-level reports will enable ICB leaders to understand performance across their system and then use organisational-level data to identify areas for improvement or locate successful interventions. In addition, triangulation of WRES equality data is pivotal to supporting ICBs’ statutory aim of tackling health inequalities, measuring the extent to which NHS staff are representative of their place and have a sense of belonging to their organisations.
NHS England will continue working with stakeholders, partners and systems at national and regional levels to coordinate work across several areas to improve the experience of our colleagues from black and minority ethnic communities. Delivering the recommendations of the Messenger review is one component of this. We also continue working with regions and systems to improve the processes and structures which can often entrench inequality and disadvantage, such as in recruitment and promotion.
Ongoing dialogue with systems and employers is essential in ensuring they have the data and tools they need to help them effectively tackle inequality and discrimination. The WRES will continue evolving to meet the needs of systems and employers on the journey to a more equal and inclusive NHS, providing detailed data to support targeted action.
Report produced by the WRES team
Data source: WRES data collection portal, NHS trusts only
* Data source: 2016-2017 – NHS workforce statistics website; 2018-2022 – SDCS/DCF data collection