
Organisation objective
- statutory item
Executive summary
This briefing draws on official statistics published on the NHS England website.
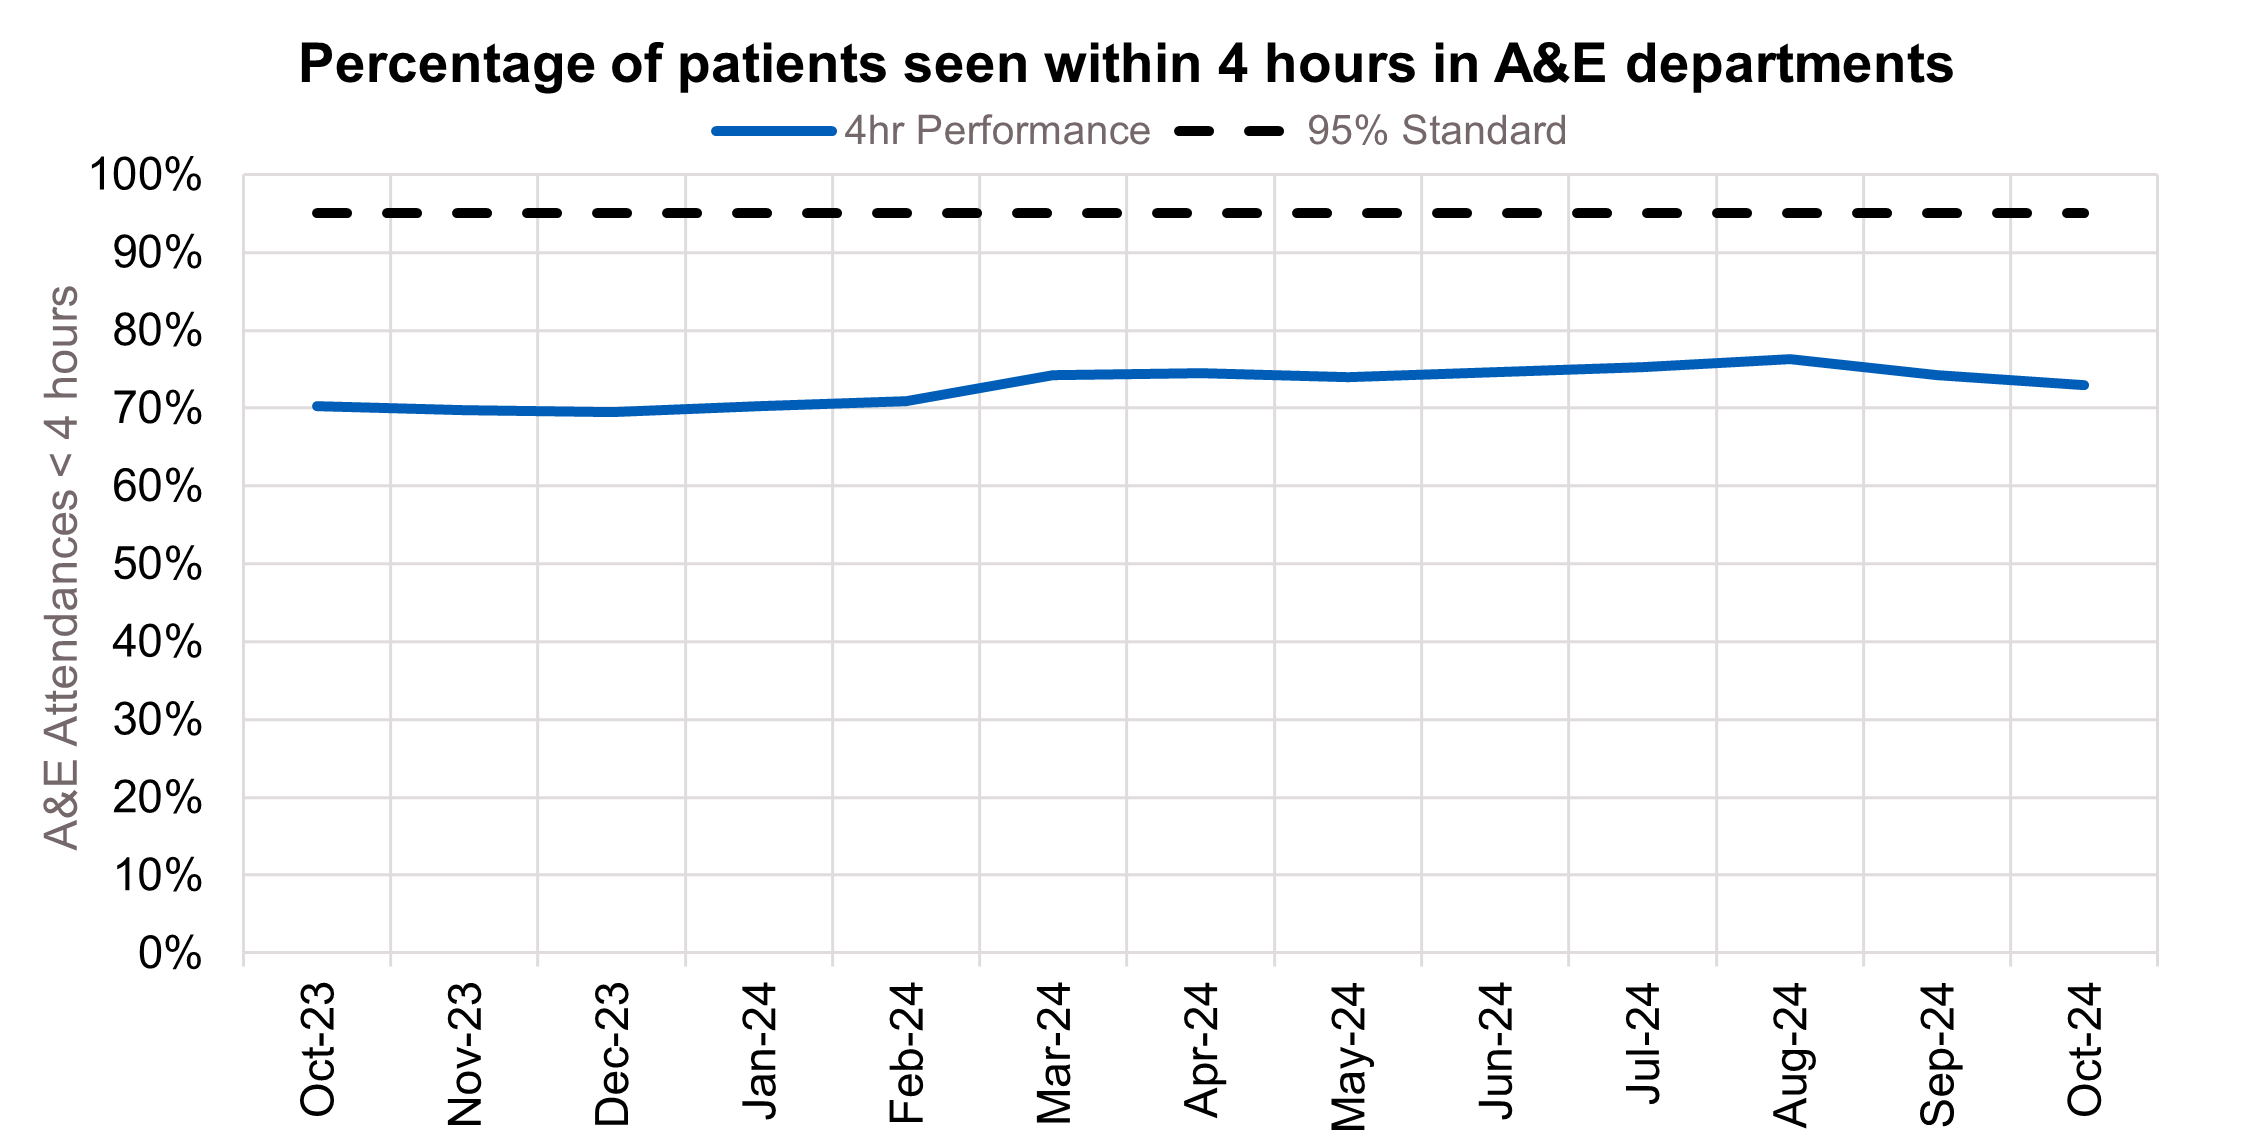
i. 73.0% of patients attending A&E were admitted, transferred or discharged within 4 hours. This is down from 74.2% in September 2024 but has improved from 70.3% in October 2023.
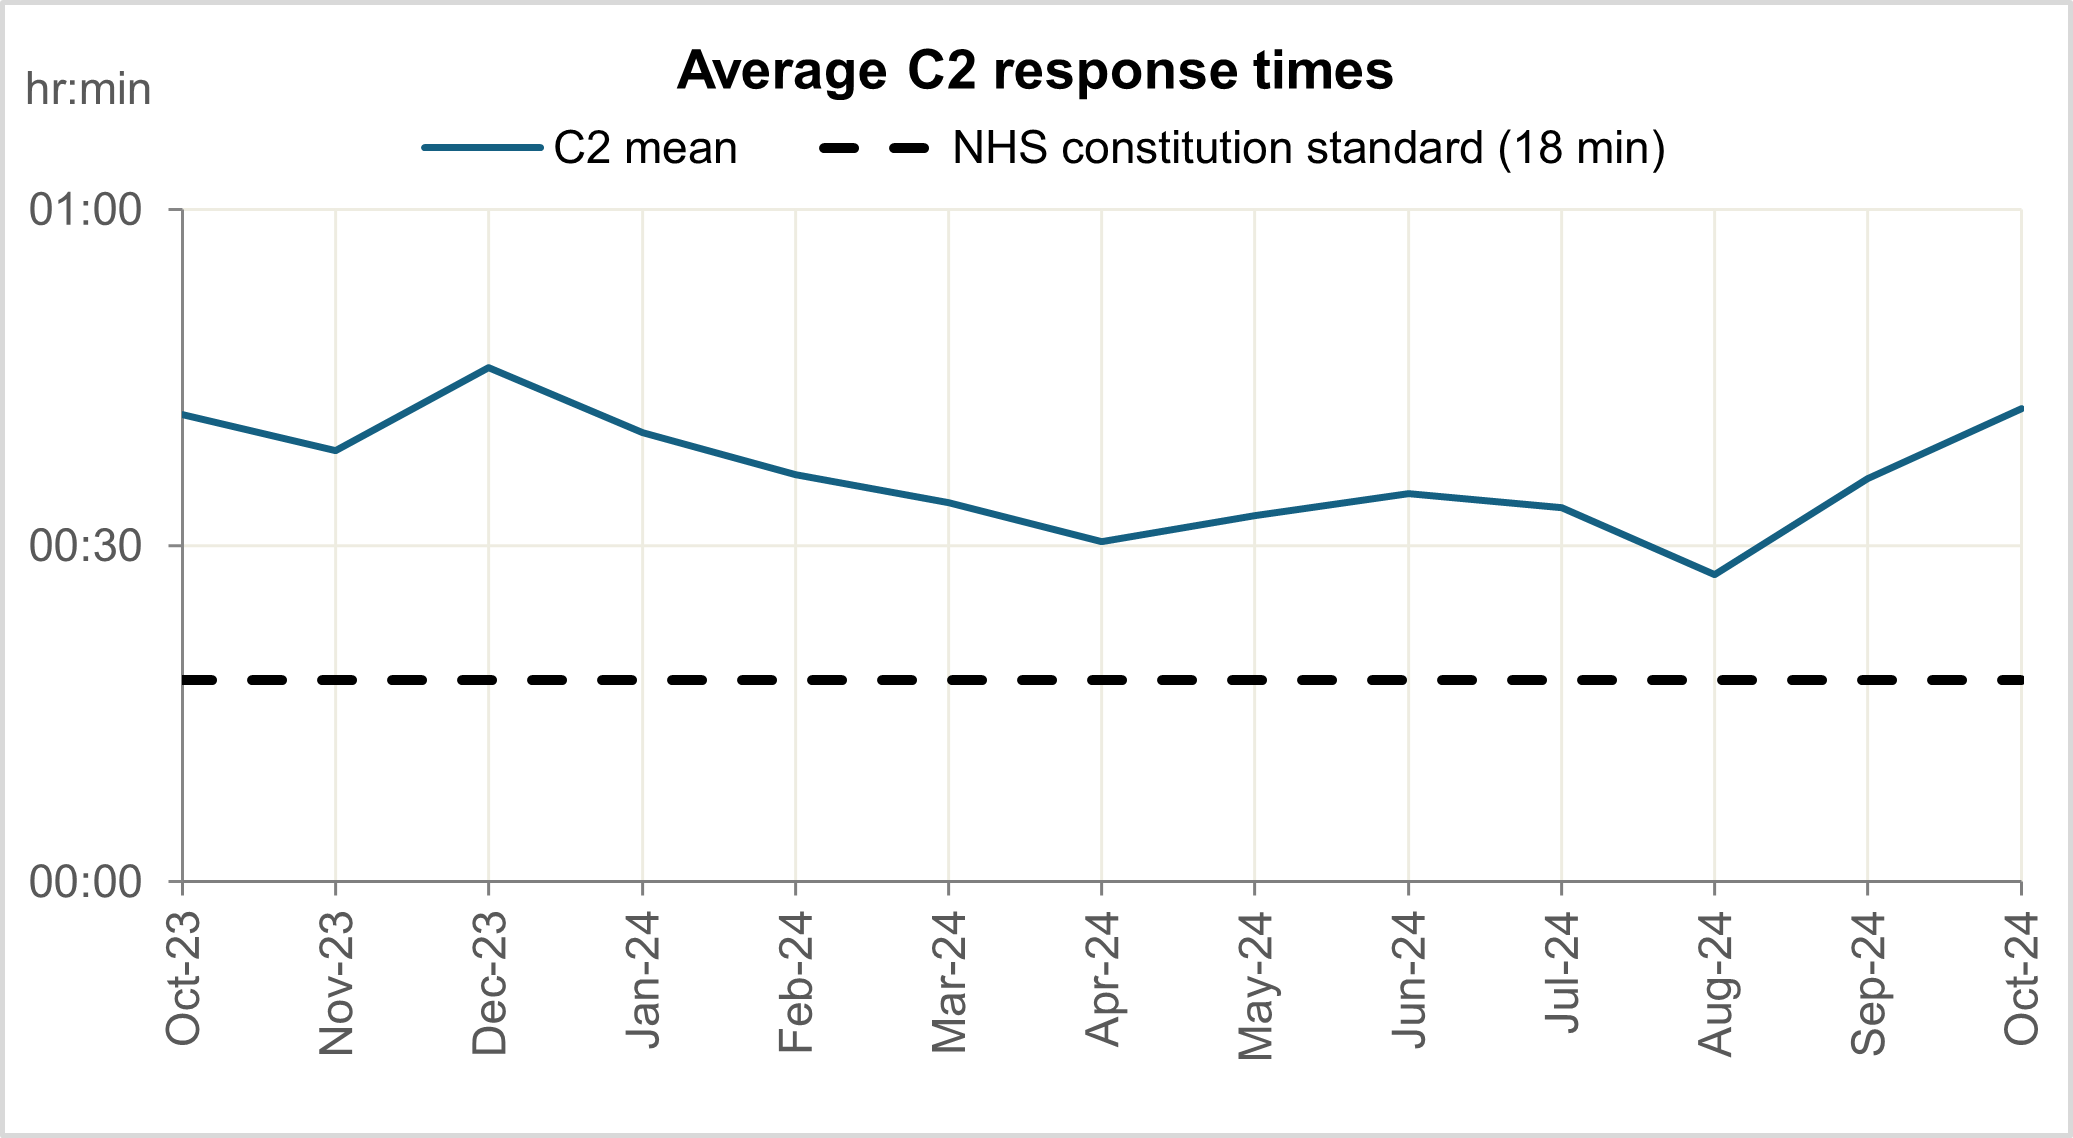
ii. The average ambulance response time for category 2 calls was 42 minutes and 15 seconds. This has increased from September 2024 and is above the 30 minute target for the year and has increased from 41:43 in October 2023.
iii. As of the end of September, on the total waiting list there were 7.57 million waits for procedures and appointments and an estimated 6.34 million people waiting for care.
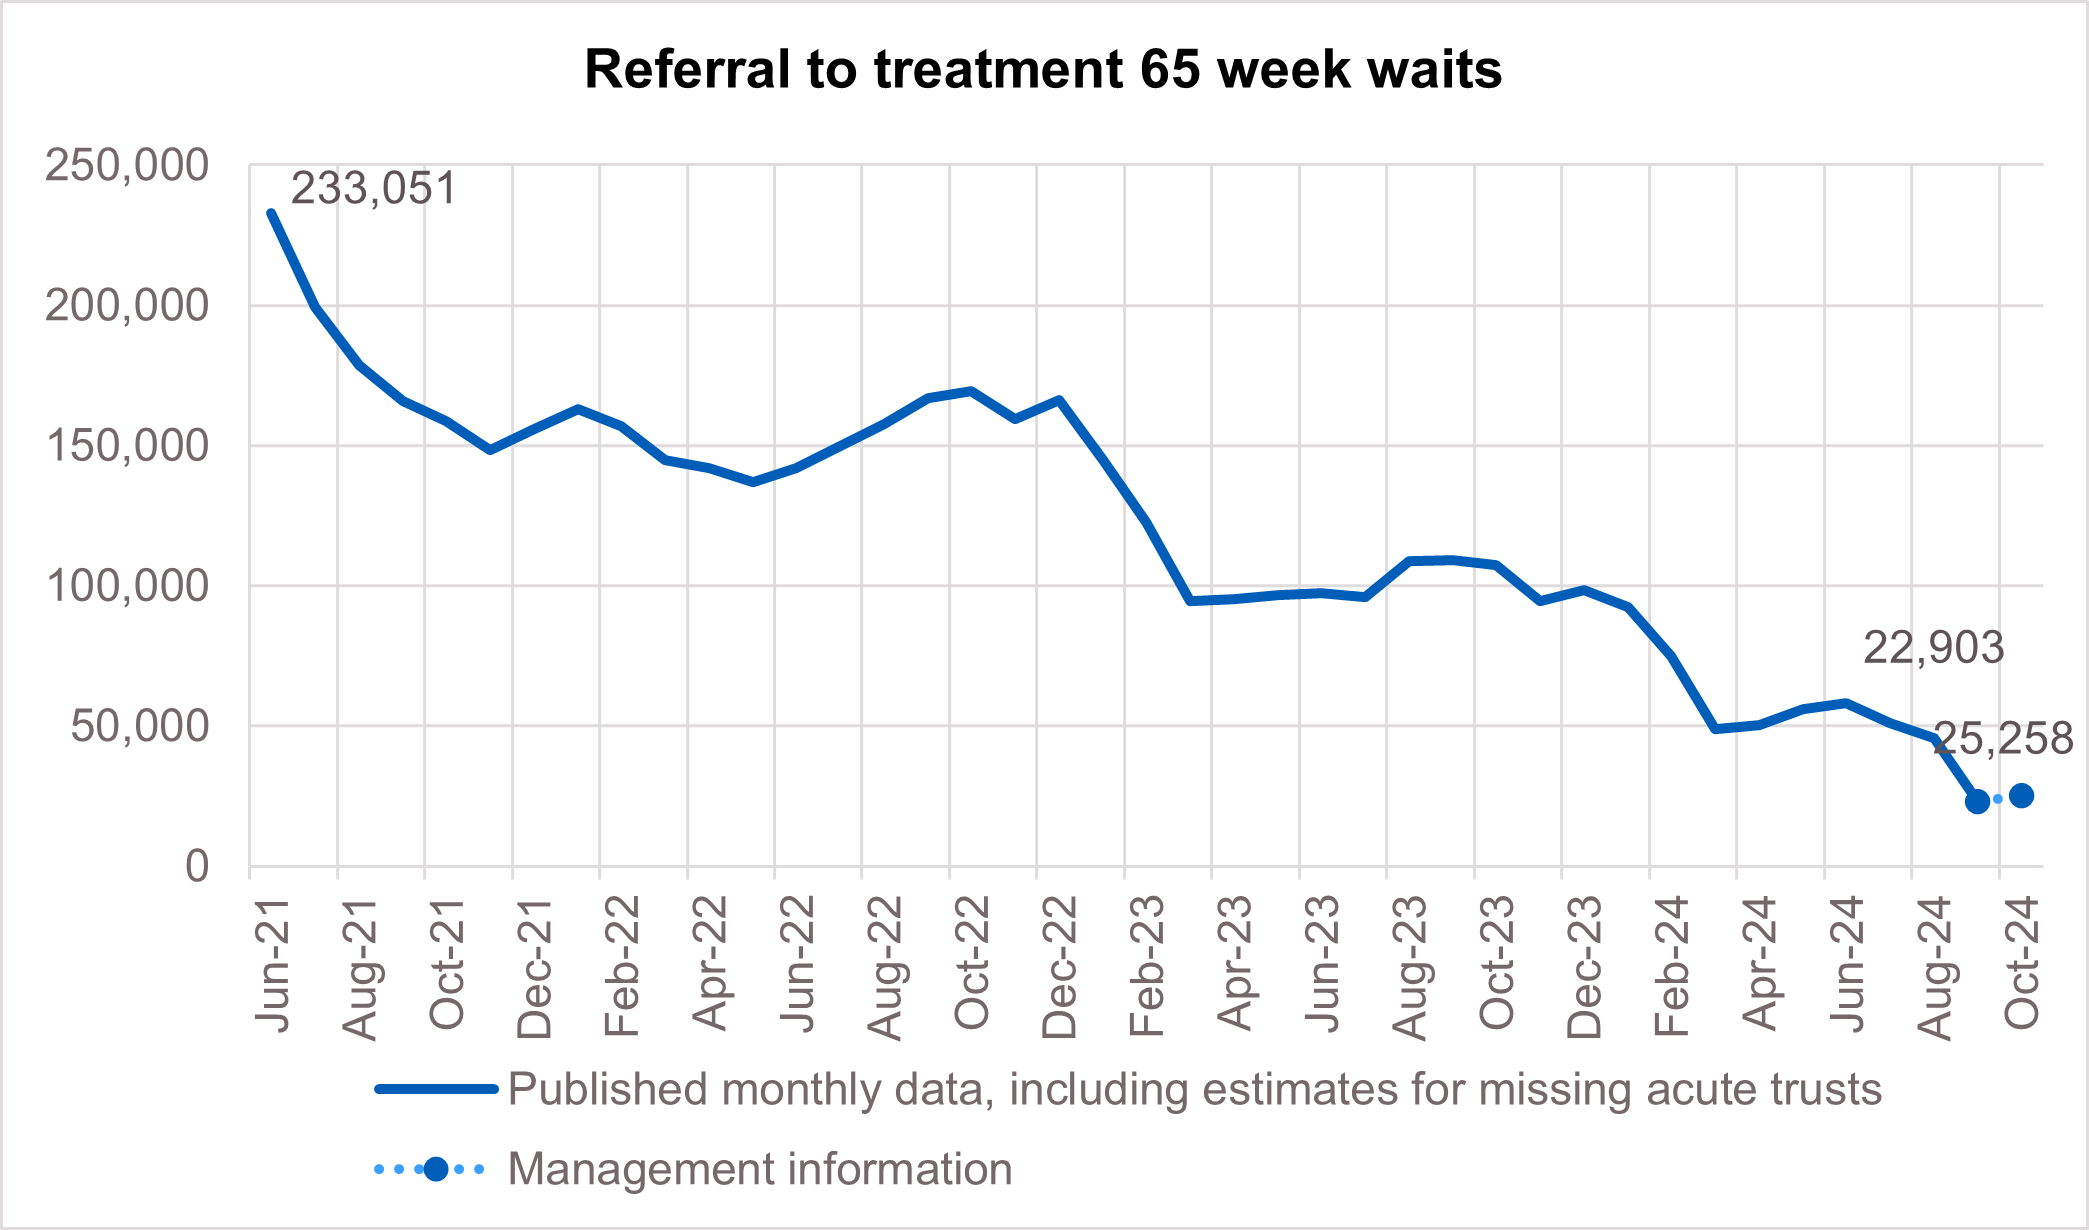
iv. The number of patients waiting more than 65 weeks for treatment was 22,903 at the end of September, significantly reduced compared to 109,135 at the end of September 2023 (down 79.0%).
v. At the end of September, on the diagnostic waiting list there were 1.59 million waits, of which 359,888 were over 6 weeks. The percentage of 6 week waits was 22.7%, down from 26.3% in September 2023.
vi. Urgent suspected cancer referrals have remained at high levels, with 12,045 patients seen per working day in September 2024. This is 30% more referrals than the NHS was seeing before the pandemic – the equivalent of 2,750 more patients per working day.
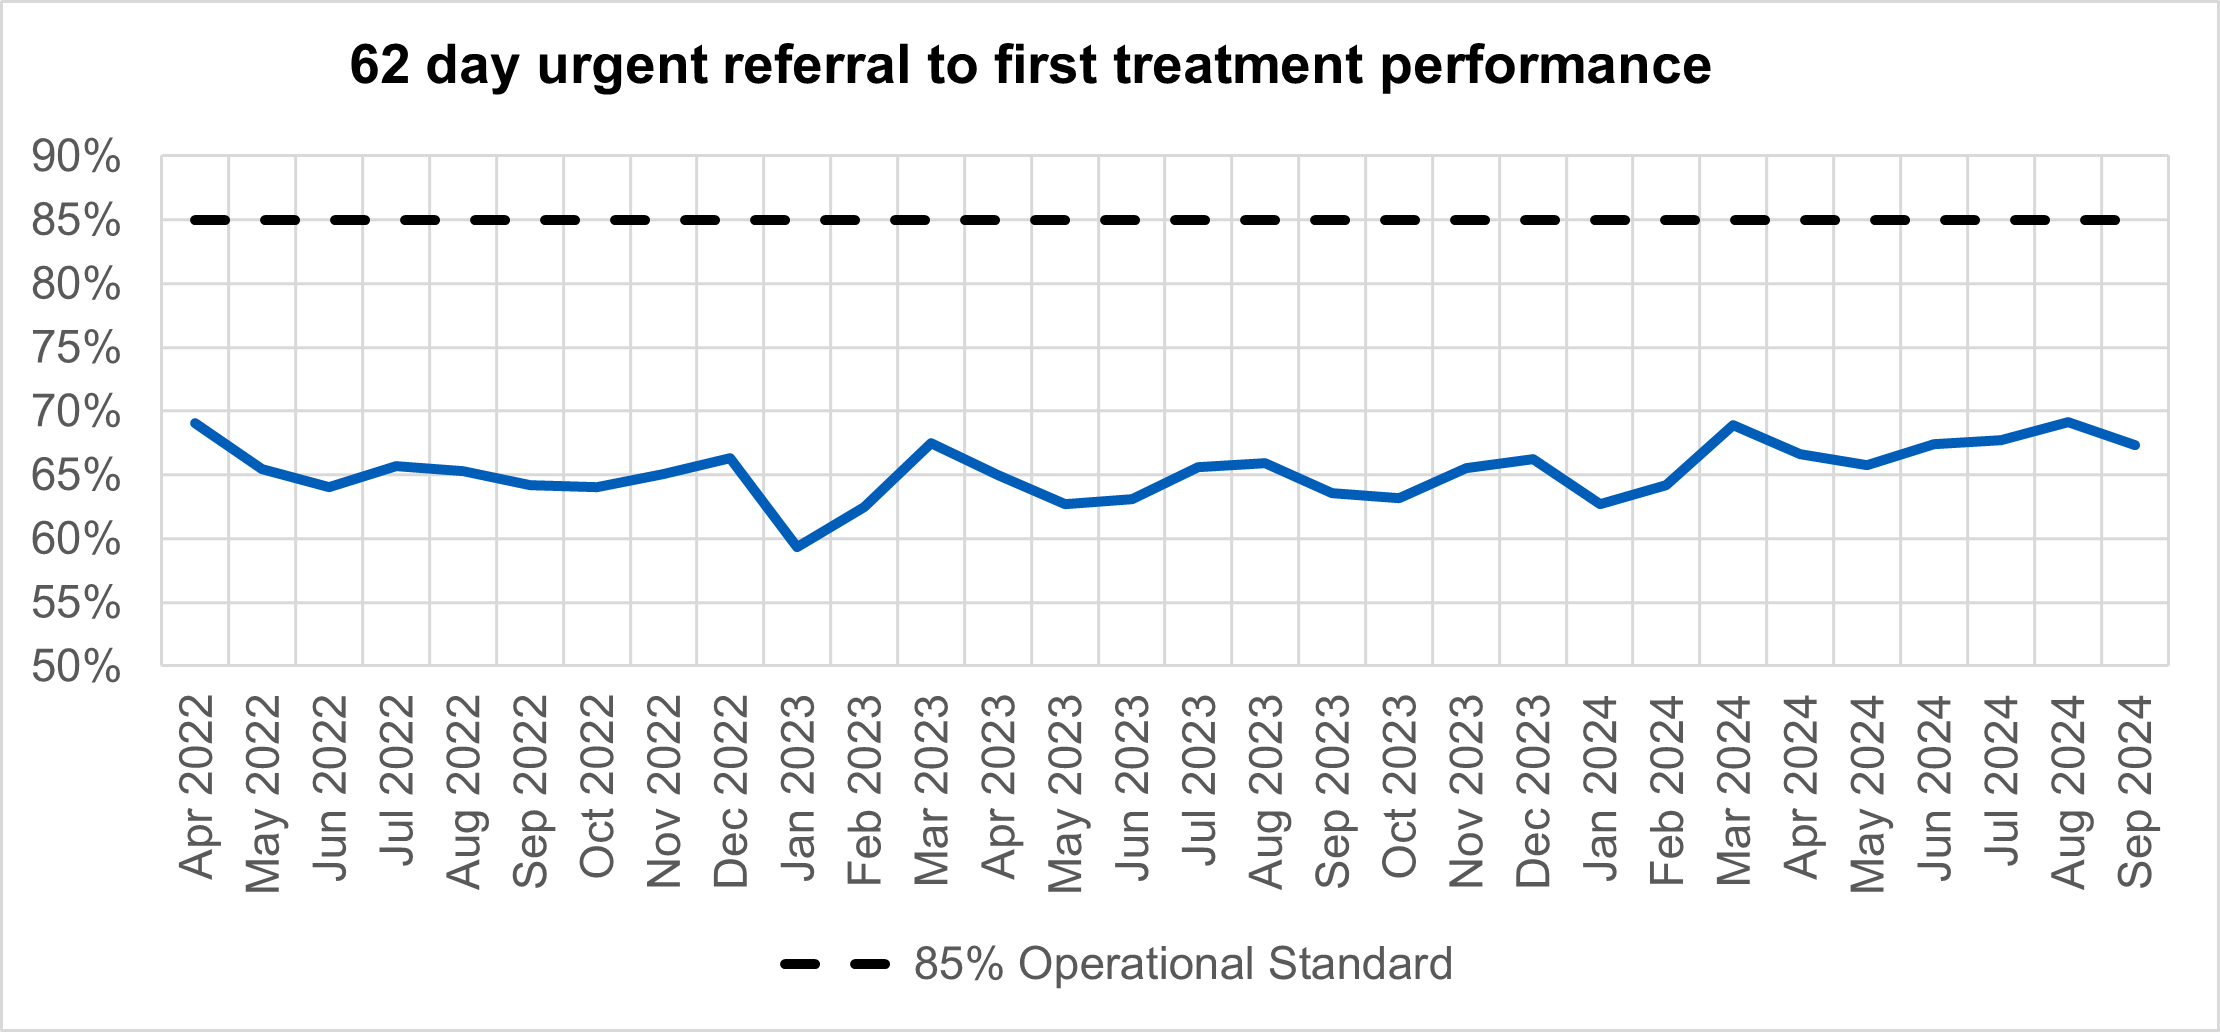
vii. In September, performance against the 62 day Urgent Referral to First Treatment Standard, was 67.3% which was 3.8% higher than at the same point last year. The NHS has set the ambition to improve this to 70% to March 2025, as a first step in recovering performance to the 85% standard.
viii. In September 2024, Mental Health Services Data Set data showed a total of 22,868 people were subject to the Mental Health Act at the end of the reporting period, with 16,699 detained and 3,795 new detentions commenced under the Act.
Urgent and emergency care
1. Demand rose for urgent and emergency care (UEC) services in October.
2. There was a total of 2,356,189 attendances at A&E departments across England in October. The average daily attendances increased to 76,006, this is 2.8% higher than September’s daily average and 5.6 % higher than October 2023.
3. Demand has increased in A&E departments. The number of patients that were admitted, transferred or discharged within 4 hours was 1,720,877, this is 10.0% higher than October 2023.
4. The proportion of patients attending A&E who were admitted, transferred or discharged within 4 hours was 73.0%, which is below the 78% target for this year, and the NHS constitutional standard of 95%. This is down from 74.2% in September 2024 and has improved from 70.3% in October 2023.
5. The provisional figures published for October indicate that 11.1% of patients attending a type 1 A&E department spent 12 hours from arrival in A&E compared to 9.9% last month.
Percentage of patients seen within 4 hours in A&E departments
6. Provisional figures for October, compared with October 2023 show a 2.1% increase in the number of patients occupying a core general and acute bed and an 11.6% increase in escalation beds usage this past month. Over 50% of those beds were occupied by patients with a length of stay of 7+ days, nearly 30% by patients with a length of stay of 14+ days and 19% for 21+ days.
7. Paediatric bed occupancy has risen from 68.4% in September to 71.3% in October, putting added pressure on flow through emergency departments for children. While for adults, bed occupancy has risen from 94.6% in September to 95.3% in October.
8. Ambulance services answered 874,616 calls to 999, or 28,213 per day, an increase of 2% compared to October 2023 and 6% more than September 2024. There were 378,642 incidents where a patient was conveyed to A&E, 2% more than in October 2023.
9. The average ambulance response time for category 2 calls was 42 minutes and 15 seconds. This has increased from September 2024 and is above the 30 minute target for the year and the NHS constitutional standard of 18 minutes.
Average category 2 response times
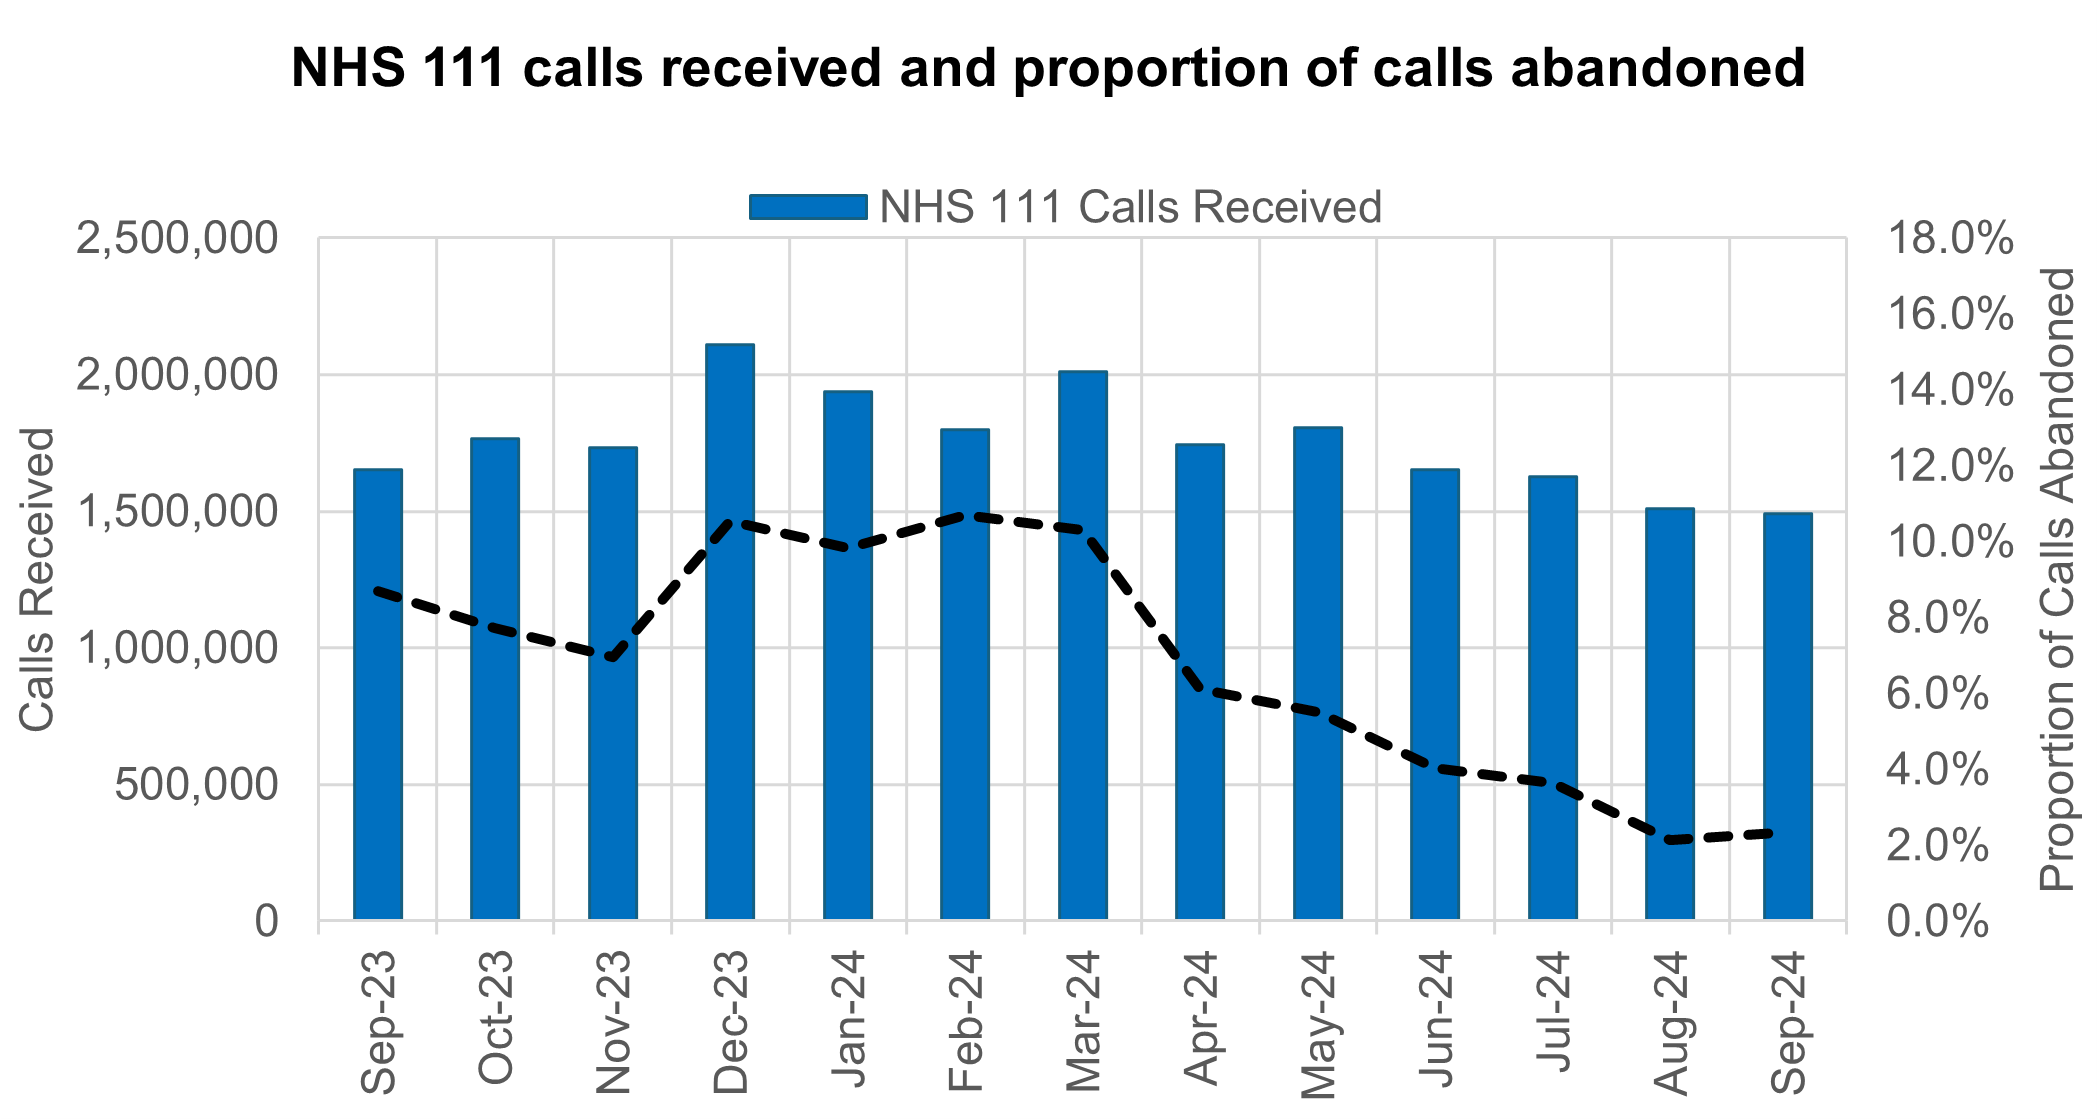
10. NHS 111 received 1.42 million calls (c. 47.4 thousand per day) in September 2024. Demand was 9.7% down year on year and 1.2% below volumes received in August 2024.
11. The proportion of calls abandoned increased 0.2% percentage points from the previous month (now at 2.3%) and the average speed to answer increased by 3 seconds to 41.
NHS 111 calls received and proportion of calls abandoned
Note: updated following revisions to reporting periods April 2023-March 2024 inclusive
Elective recovery
12. As of the end of September, on the total waiting list there were 7.57 million waits for procedures and appointments and an estimated 6.34 million people waiting for care.
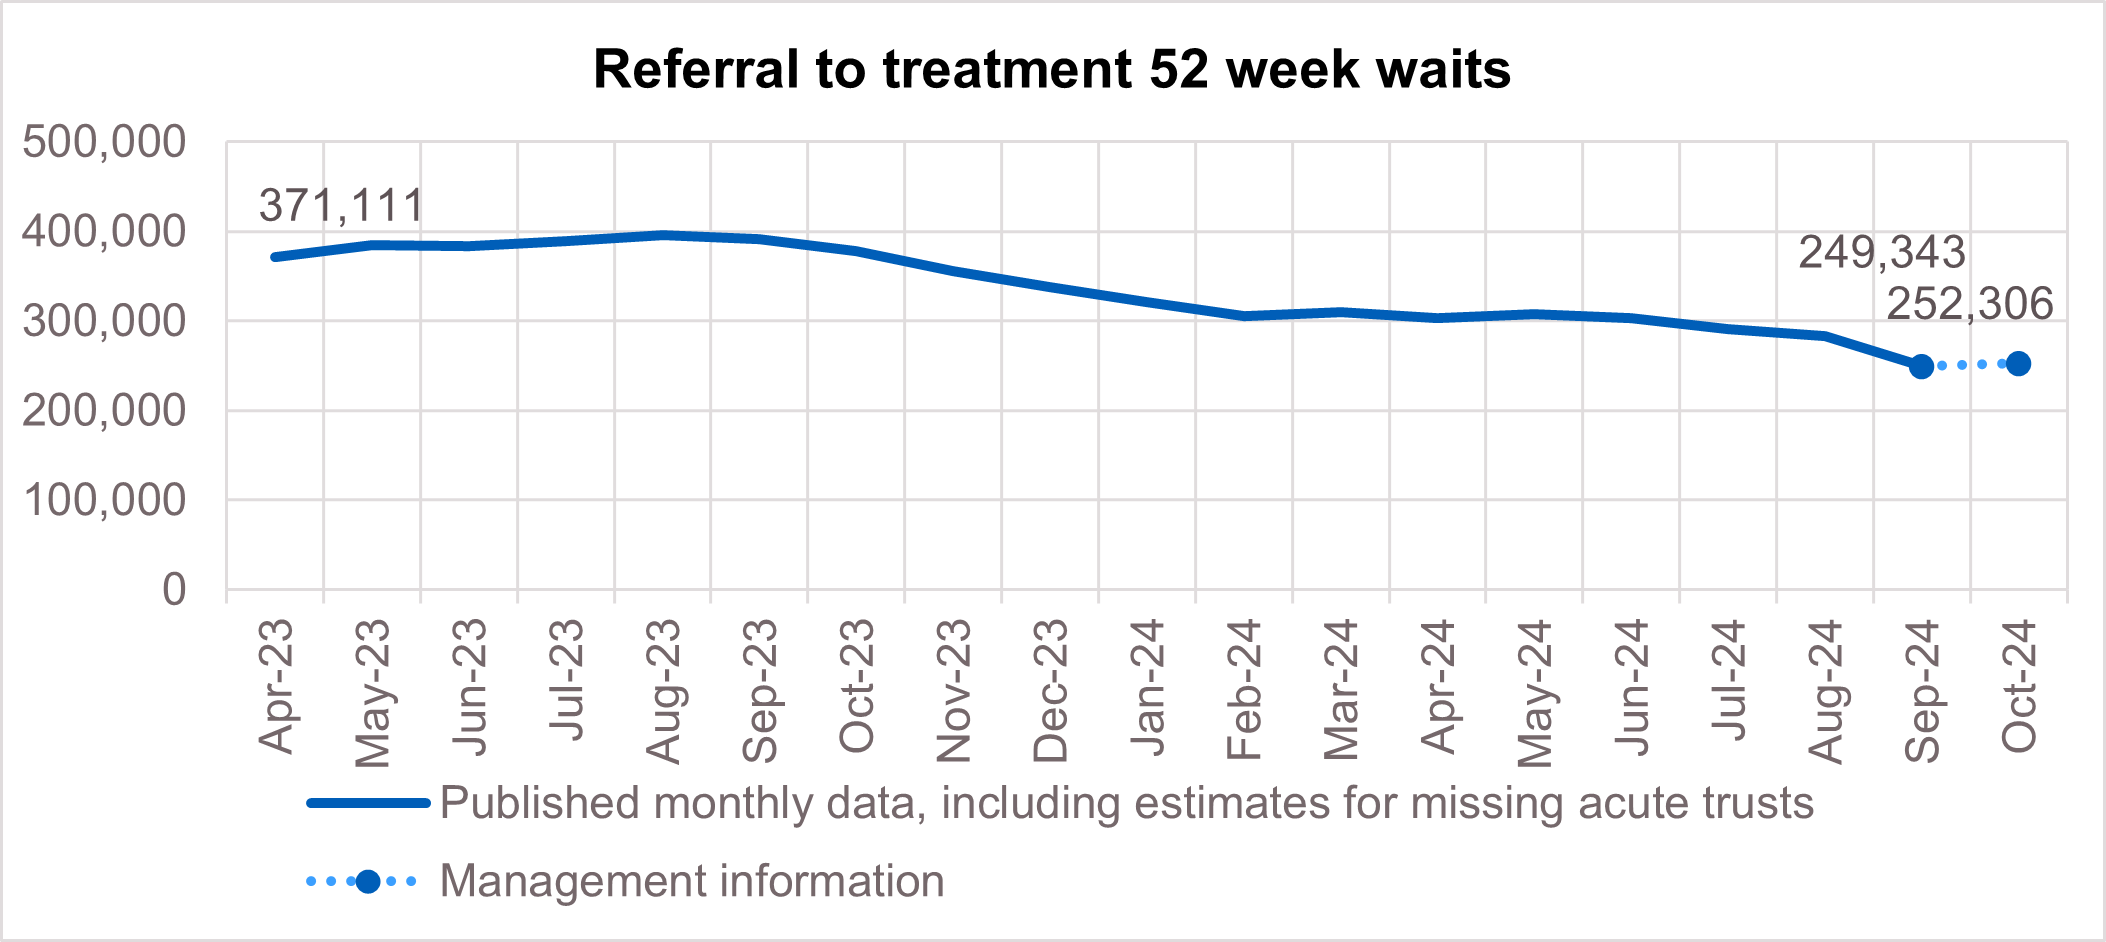
13. There were 249,343 waits of more than 52 weeks for treatment at the end of September, compared to 391,107 at the end of September 23 (down 36.2%). Additional management data* suggests that 252,306 waits of more than 52 weeks as of the end of October.
*Management information for the latest month is taken from the Waiting List Minimum Dataset (WLMDS). Figures include data up to week ending 27 October 24. WLMDS data is subject to less validation than the published monthly figures. 134 of 135 acute trusts submitted data for week ending 27 October 2024 – the figures for this latest week have been adjusted to include the latest available data for the missing acute trusts.
Referral to treatment 52 week waits
14. The number of waits of more than 65 weeks for treatment was 22,903 at the end of September, significantly reduced compared to 109,135 at the end of September 2023 (down 79.0%). Additional management data suggests 25,258 waits of more than 65 weeks for treatment as of the end of October.
Referral to treatment 65 week waits
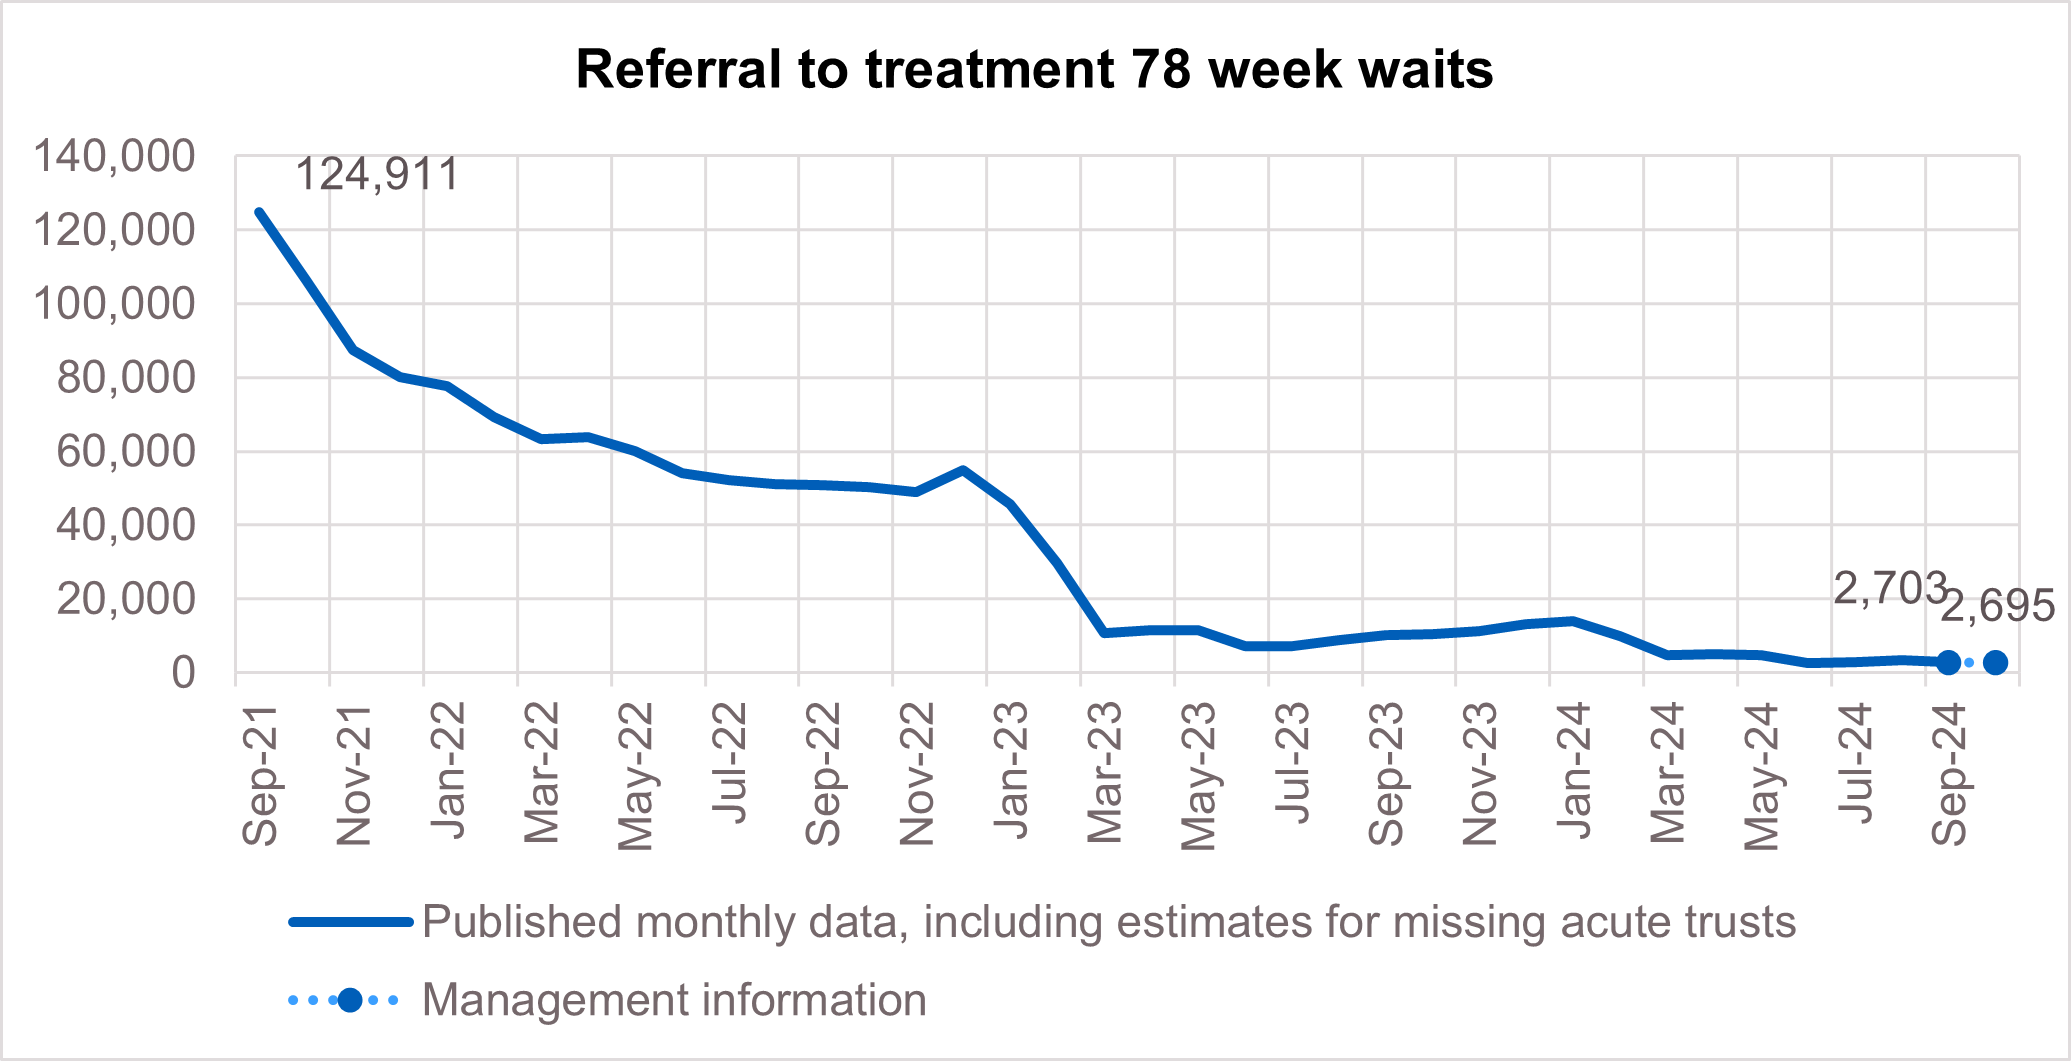
15. There has been a reduction in the longest waits for care, 2,703 waits of more than 78 weeks for treatment at the end of September, compared to 10,200 at the end of September 2023 (down 73.5%). Additional management data suggests 2,695 patients were waiting more than 78 weeks for treatment as of the end of October.
Referral to treatment 78 week waits
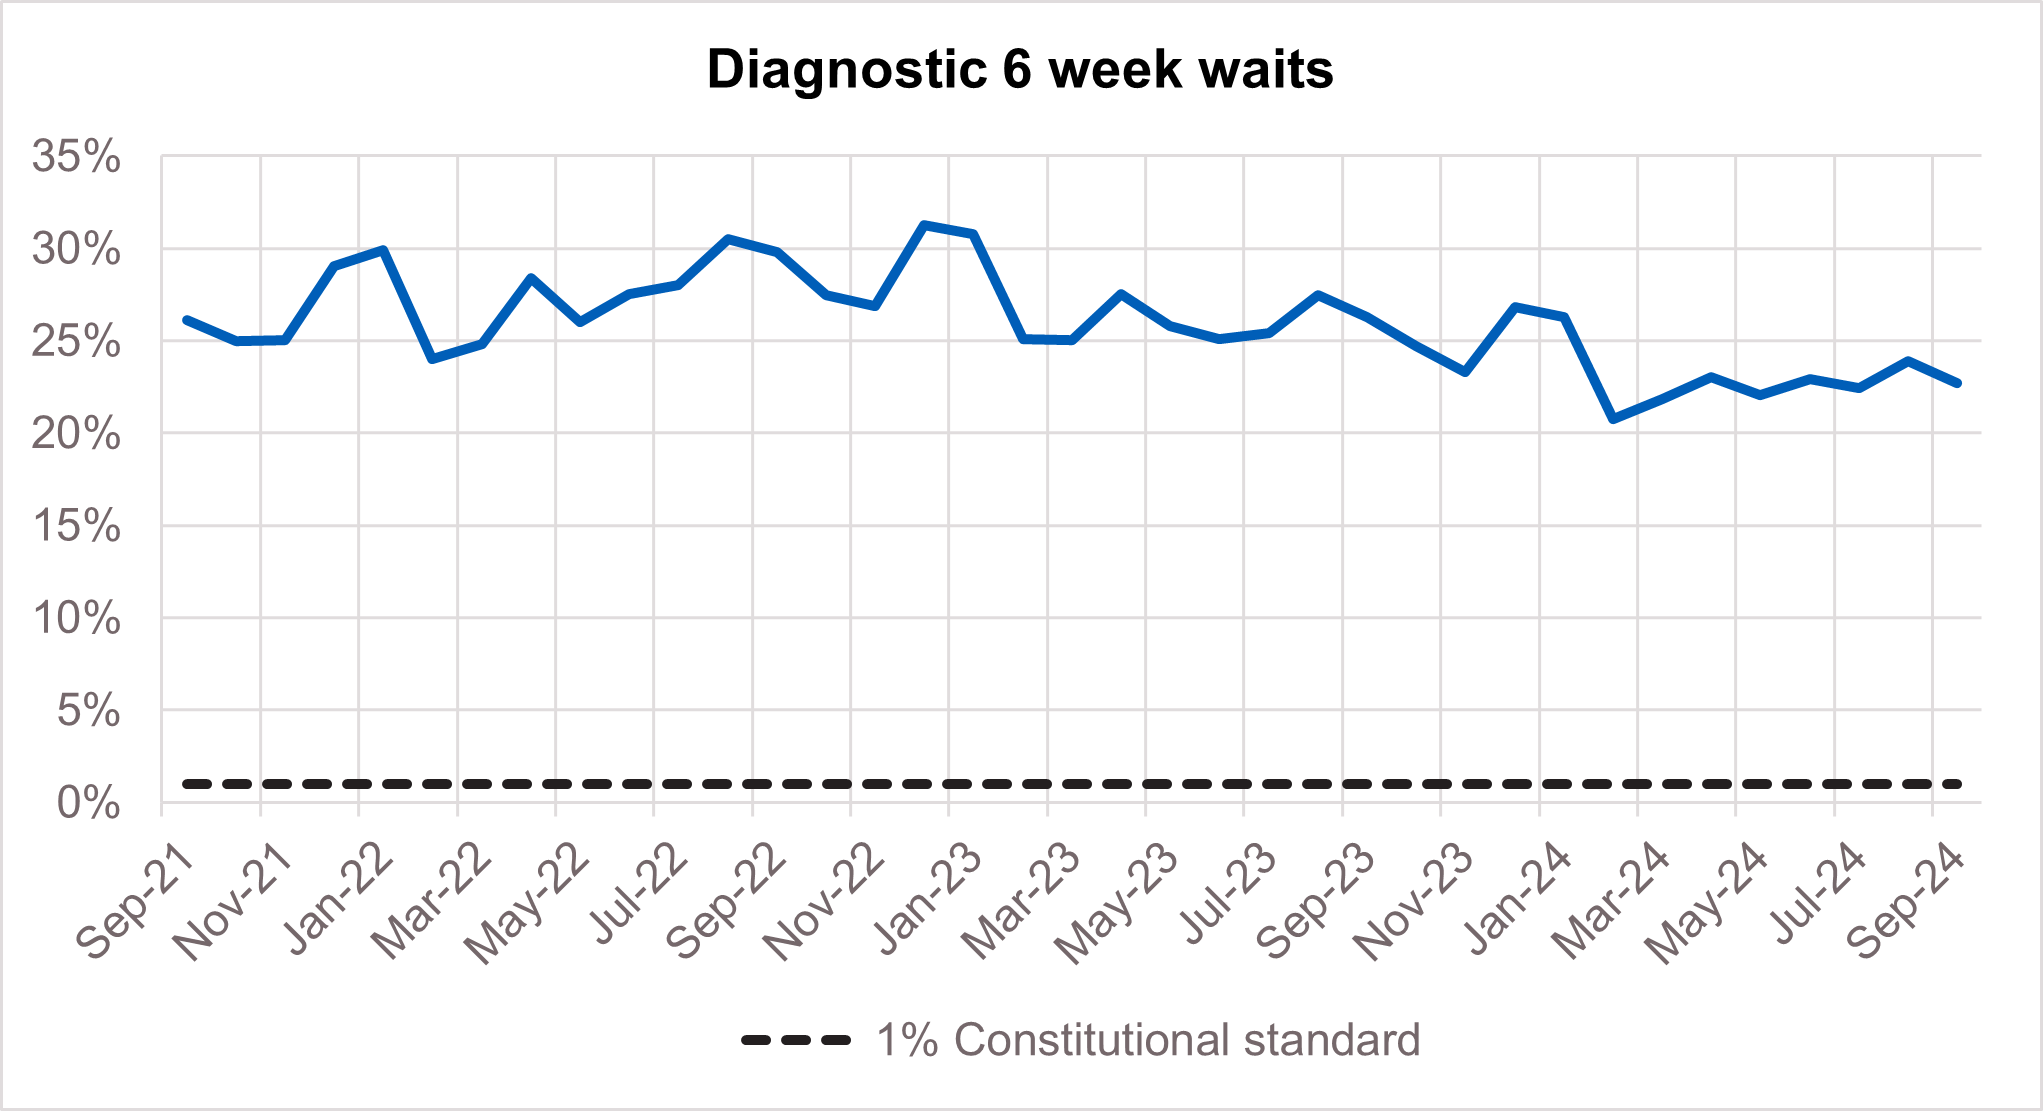
16. At the end of September, on the diagnostic waiting list there were 1.59 million waits, of which 359,888 were over 6 weeks. The percentage of 6 week waits was 22.7%, down from 26.3% in September 2023. Progress is being made towards the interim recovery target of not more than 5% of the waiting list over 6 weeks and an increased percentage of diagnostic activity is supplied by community diagnostic centres.
Diagnostic 6 week waits
Cancer
17. Urgent suspected cancer referrals have remained at high levels, with 12,045 patients seen per working day in September 2024. This is 30% more referrals than the NHS was seeing before the pandemic – the equivalent of 2,750 more patients per working day.
18. Treatment activity was also at high levels with nearly 1,400 patients starting cancer treatment per working day, 15% above pre-pandemic levels.
Urgent suspected cancer referrals first seen

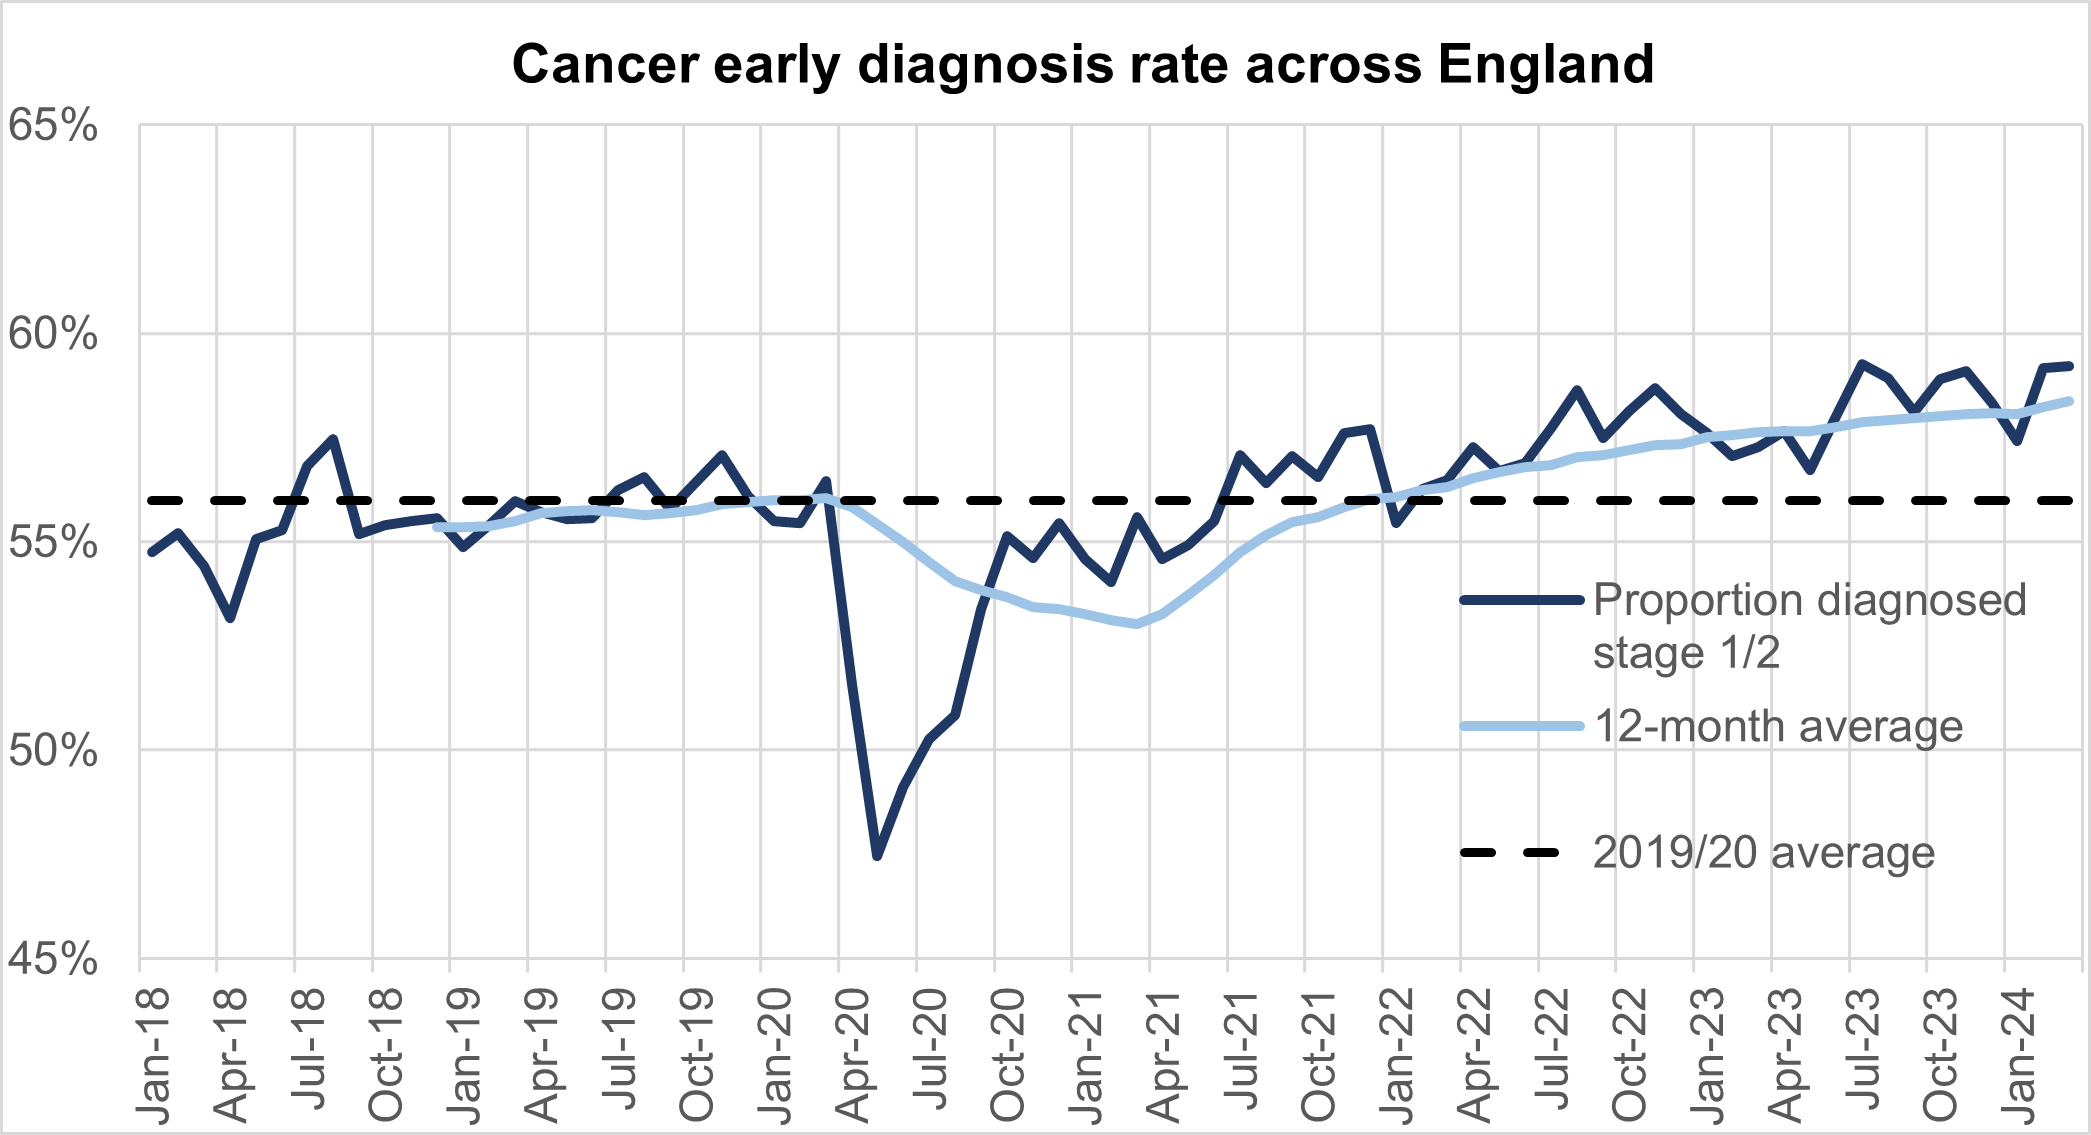
19. The increase in referrals has also contributed to increases in early diagnosis, which are now about 2 percentage points higher than before the pandemic. Cancer survival also continues to improve. In 2023, the Annals of Oncology published findings showing that cancer deaths are around 10% lower in the UK compared to 5 years ago.
Cancer early diagnosis rate across England
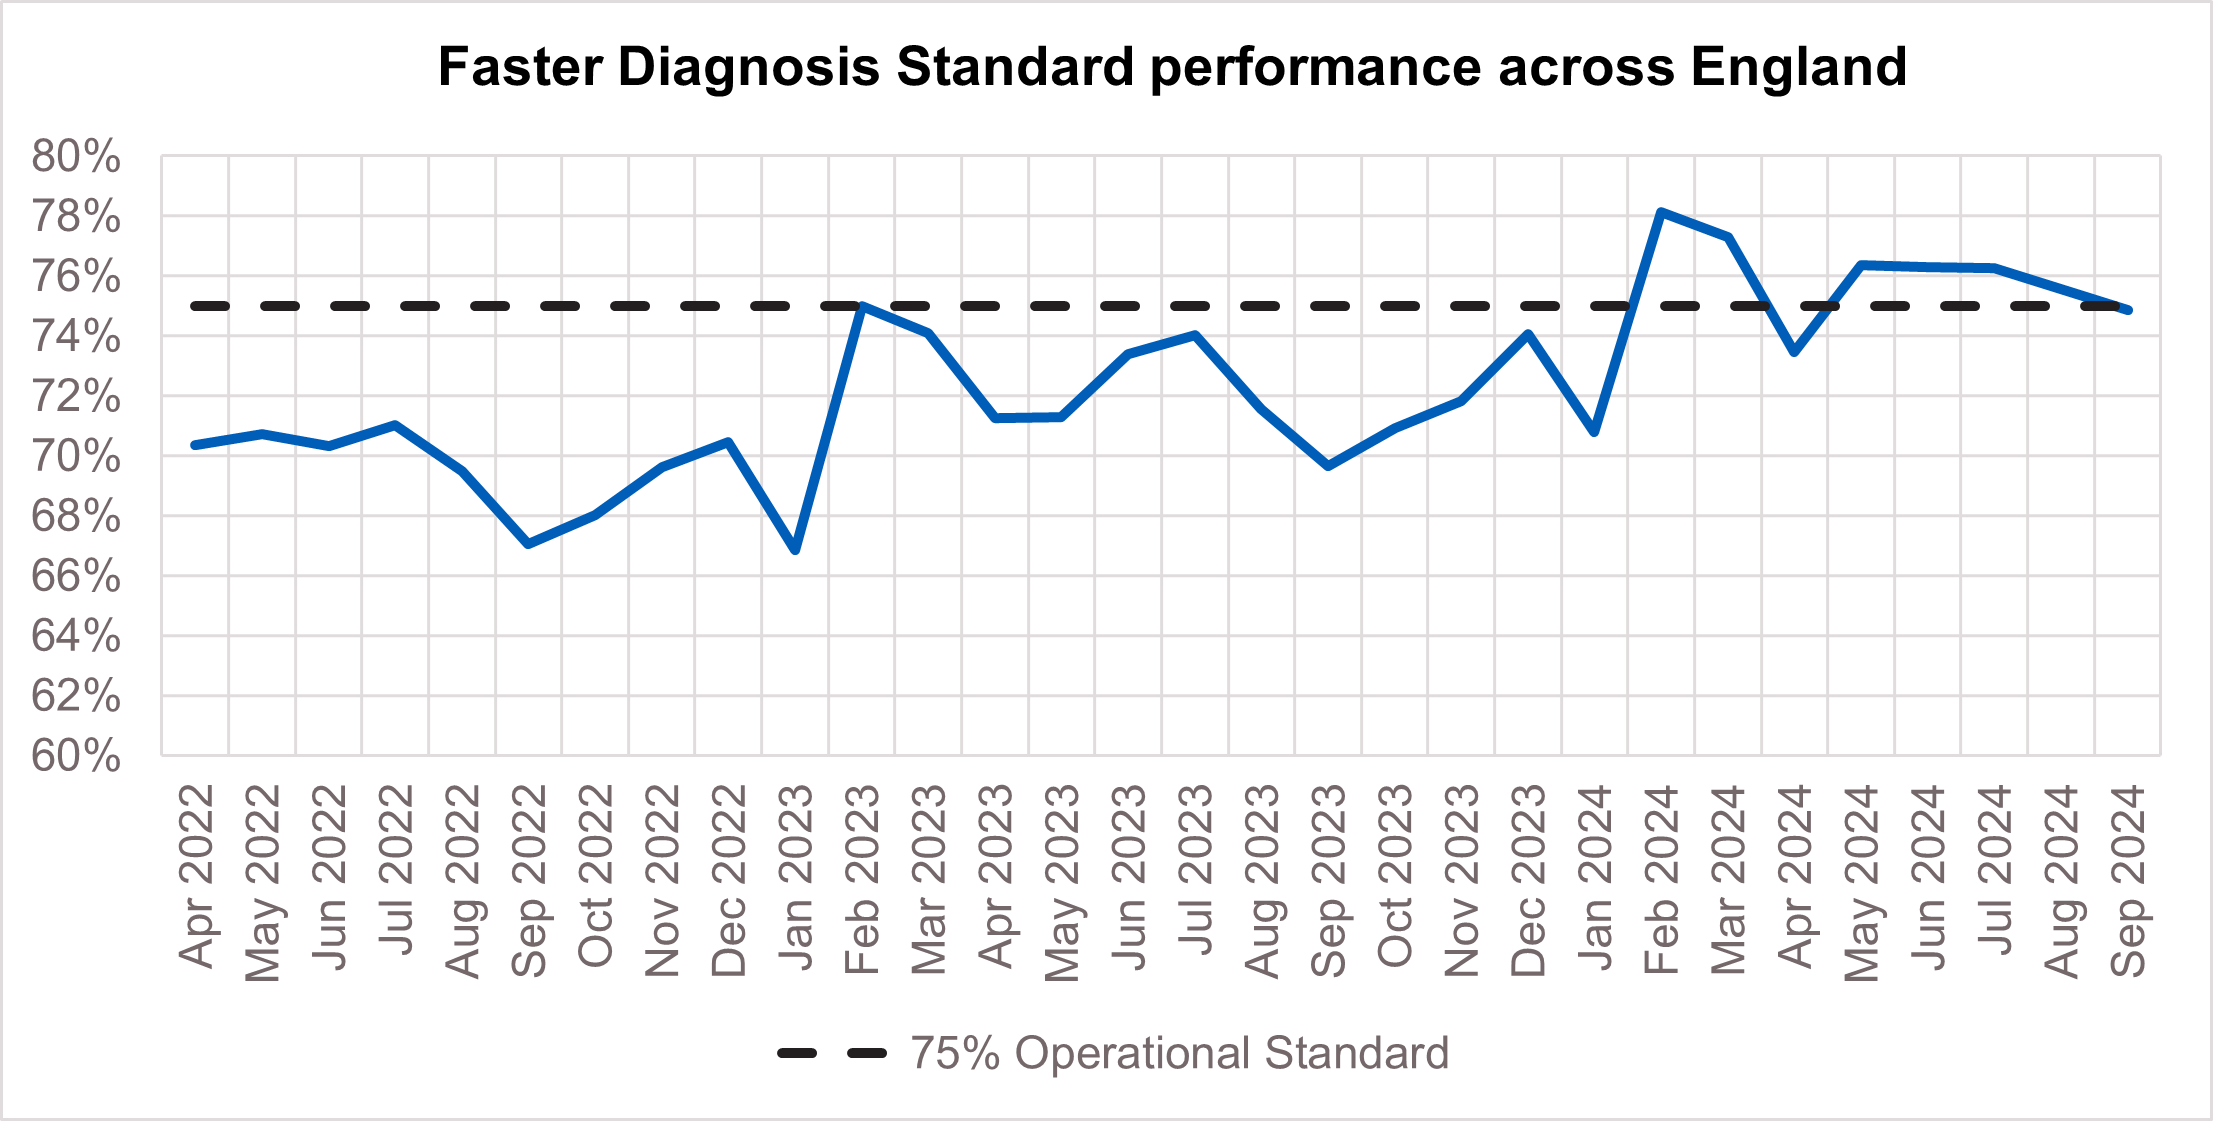
20. The NHS is working hard to keep up with this increase in demand. It has been accelerating the installation of new diagnostic capacity, much of it in community diagnostic centres. Performance against the Faster Diagnosis Standard in September was 74.8%, which whilst slightly below the 75% standard represents a 5.2% improvement compared to the same point last year. The NHS has announced that this standard will increase to 80% by March 2026.
Faster Diagnosis Standard performance across England
21. In September, performance against the 62 day Urgent Referral to First Treatment Standard, was 67.3% which was 3.8% higher than at the same point last year. The NHS has set the ambition to improve this to 70% to March 2025, as a first step in recovering performance to the 85% standard.
62 day urgent referral to first treatment performance
Mental health
22. As the Mental Health Bill was recently introduced to Parliament, we are focussing on data related to the Mental Health Act (MHA) this month.
23. From April 2024, new metrics, as well as breakdowns of existing metrics were published as official statistics. These metrics include the number of uses of section 2 and section 3 (under part 2 of the MHA – civil sections); the overall number of uses of part 3 of the MHA (criminal justice sections); and additional breakdowns of certain metrics by age, gender, ethnicity and deprivation level. Publishing this data is an important step towards responding to the MHA review’s recommendation that key data from the Mental Health Services Data Set should be published monthly, as close to real-time as possible.
24. NHS England is also continuing work on other areas of MHA data quality improvement. In 2024/25, this will focus on improving the number of MHA detentions that include section type and ethnicity data, increasing the number of providers submitting complete community treatment order (CTO) data, and increasing the number of independent sector providers who are providing a submission to the MHA data table.
25. In September 2024, data showed a total of 22,868 people were subject to the Act at the end of the reporting period, with 16,699 detained and 3,795 new detentions commenced under the MHA. Short-term orders were used 1,719 times*, with a large portion of these (1,100) related to the use of section 136 (emergency police powers). There were also 515 CTOs that started in September 2024. The overall number of detentions and CTOs has remained relatively consistent across the year.
* It should be noted that Mental Health Services Data Set data does not capture all uses of short-term orders, particularly use of Section 136 by the police, which does not result in detention in a mental health hospital.
Publication reference: Public Board paper (BM/24/41(Pu)