Executive summary and action required
The 2025 Spending Review (SR) settlement for the NHS requires annual improvements in productivity of 2%. NHS’s productivity plan aims to:
- in the short-term close the productivity gap back to 2019/20 and levelling up worst performers with operational and clinical productivity improvements
- drive productivity improvement beyond current ‘productivity frontier’ through technology and digital innovation, funded through the current Spending Review settlement
- Maximise health outcomes and value to the public through shifting care out of acute and further upstream, aligned with the 10 year health plan
The NHS is currently well on track to deliver the productivity target over the SR period, through a sharp focus on operational and clinical productivity. In the past 18 months, we have sustained delivery over the 2% productivity target, including a 2.7% improvement in 24/25 and a 2.6% improvement in acute hospital productivity in the first half of 25/26.
This paper gives an update on the latest productivity delivery, planned improvement for FY2026/27 and longer term ambitions, noting that improving NHS productivity is a central goal of the reforms outlined in the 10 Year Health Plan for England. The Board are asked to discuss the contents of this plan.
Context
1. The 2025 Spending Review (SR) settlement for the NHS requires annual improvements in productivity of 2% for the next 3 years. Put another way, this is the minimum productivity improvement required to deliver necessary levels of activity to achieve the Government’s performance goals within the agreed resource envelope. This requirement, and our plan that shows how we will deliver it, is now twice that of the Office for Budget Responsibility’s medium term productivity forecast for the economy as a whole, which is now expected to reach 1.0% in 2030.
2. The fall in NHS productivity prior to and particularly during the pandemic, a result of a significant injection of resources to ensure the NHS was sustainable during that period of unparalleled pressure, is well documented. It led to a ~25% fall in productivity in 2020/21 from which the NHS has not yet fully recovered. Delivering a 2% year-on-year improvement in productivity over the SR period closes this gap and returns the NHS to pre-pandemic levels of productivity by the end of the Parliament.
3. Historically, the NHS has averaged around 0.6% productivity growth per year. The SR requirement to deliver 2% in 2025/26 and the next 3 years more than triples this level of performance and unlocks £17bn worth of savings. It is worth noting that NHS productivity over the period since 1997 has exceeded that of the wider public sector – despite the impact of the pandemic the NHS is 10% more productive than was measured in 1997, compared to a fall in productivity of c6% in the public sector excluding health.
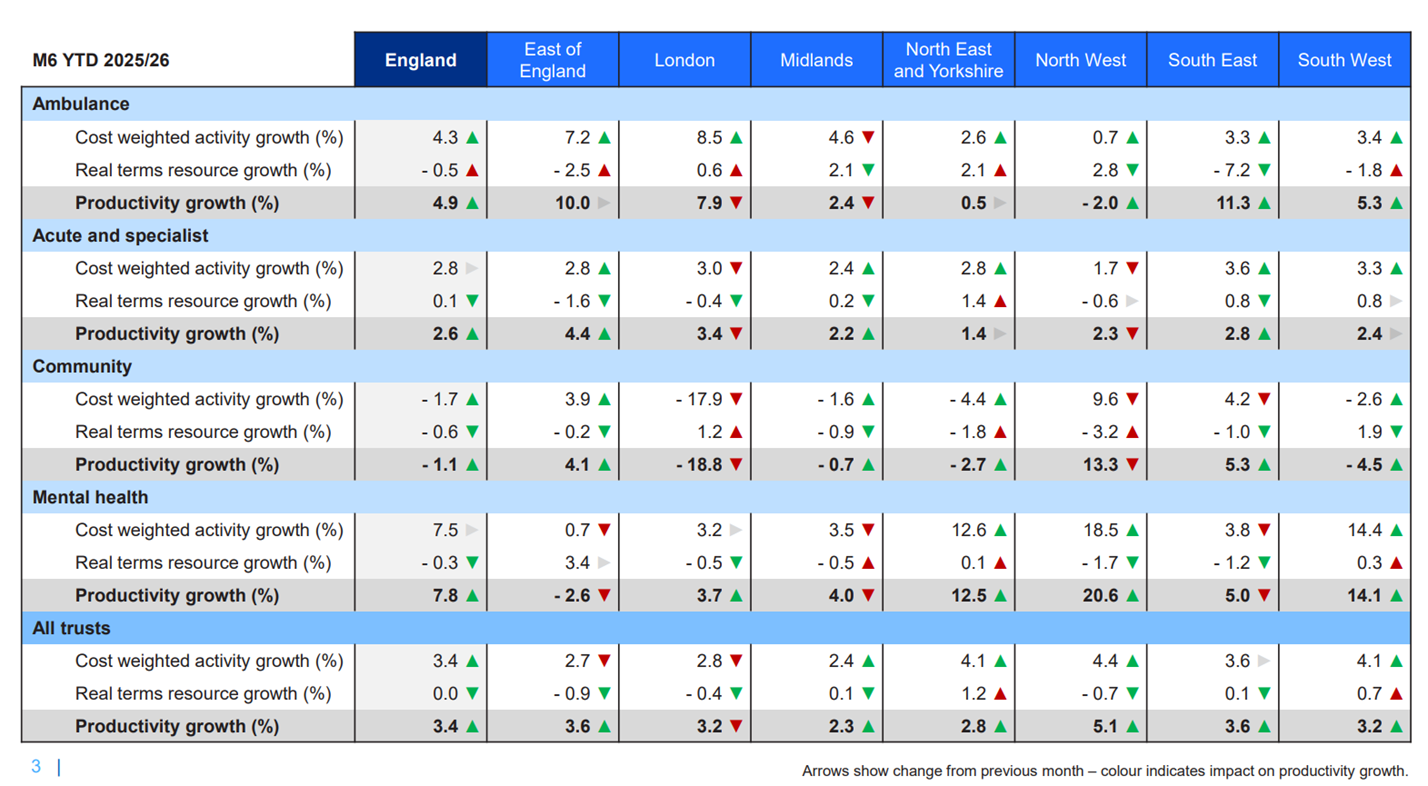
Productivity measurement
4. Previous public board papers have highlighted the difficulty and importance of measuring productivity in healthcare. The ONS annual productivity measurement, considered the most established method, usually involves a significant time lag (2-3 years) and does not always capture service and coding changes. While it is reliable for tracking the long-run national trend, it is of limited use for NHS leaders to track in-year progress, understand variation across the country, and to drive improvement.
5. NHS England has been working alongside ONS and other experts such as the University of York, over the last 18 months to develop a more timely, accurate productivity measurement that can be reported at trust level across the NHS. The measurement is broadly aligned with ONS’s annual measurement of productivity, using weighted activity as output, and inflation adjusted spend as input. Adjustments have been made to capture value of health services wherever possible, for example equalising the value of the same elective procedures that are done at outpatient or inpatient settings. The methodology has been developed and tested with ONS, York through a regular working group, and received input from other experts including health think tanks.
6. From 12 February 2026, NHS England will start publishing trust level productivity growth statistics, and monthly thereafter. A methodology document describing how these estimates are made will be published to support this, alongside final engagement to prepare the system for publication.
7. Monthly reports based on in-year reporting like this are subject to data quality and coding issues, in particular at trust level. The intention is to continue improve the quality of data reported by trusts through regular scrutiny and feedback.
8. This is by no means a ‘perfect’ measure of productivity – it is still relatively simplistic, not reflecting the nuances of local service delivery (a common issue in activity data recording) in particular for non-acute services; it does not capture impact of services across sector boundaries, and therefore not yet reflect the impact of ‘left shift’; it does not yet measure outcomes of healthcare directly. These are all areas of work planned for the near future.
9. This does not replace existing measures of productivity by ONS which will continue to publish official annual productivity figures for the whole economy, including healthcare. ONS also publishes quarterly experimental data since Q2 2024. A note on the differences of these methodologies can be found on the ONS and NHS England websites. These different methodologies can be confusing, given they can often produce materially different results. It is important to note that the ONS annual statistic and NHSE monthly statistic are the most similar in their methodologies, although there are scope differences. The quarterly estimates involve more uncertainties, in particular in recent quarters where the ONS has cautioned that the estimates may not be reflective of more timely departmental accounts. We will continue to work with think tanks and others to interrogate the data and methodology which will now be available publicly.
Progress in 2025/26
10. For this financial year, the productivity plan focuses largely on technical efficiencies, delivered mainly through strengthening operational and financial disciplines and controls, embracing best practice clinical standards, and narrowing variation in existing performance. As part of 25/26 planning, each NHS organisation was sent benchmarking data to set expectations on productivity and efficiency improvement. Alongside the publication of best practice operational improvement guides and other national and local improvement initiatives, progress has been made across the 30+ key metrics tracked nationally.
Table 1 – Key operational and clinical productivity indicators
| Indicator | Time period (compared to same period last year) | Movement in metric |
|---|---|---|
|
Non-elective bed days |
Apr-Nov 2025 |
-1.8% |
|
Non-elective overnight spells |
Apr-Nov 2025 |
-0.6% |
|
Non-elective 1+LOS |
Apr-Nov 2025 |
-1.2% |
|
Elective ordinary LOS |
Apr-Nov 2025 |
-2.0% |
|
Theatre Utilisation |
December 2025 |
+1.7%pts |
|
Same day elective procedures |
September 2025 |
+0.2%pts |
|
Outpatient attendances per consultant WTE |
Apr-Sept 2025 |
+0.5%pts |
|
Bank spending |
Apr-Nov 2025 |
-7% |
|
Agency spending |
Apr-Nov 2025 |
-42% |
11. Latest data comparing H1 2025/26 vs H1 2024/25 shows that the NHS is delivering 2.6% productivity growth in the acute sector, and up to 3.4% overall when including non-acute providers, albeit the data quality from non-acute services means we have less confidence in the reliability of that estimate compared to the acute sector. Annex B sets out the estimates.
12. The positive progress this year is testament to the tremendous effort NHS frontline staff, clinical and operational managers and trusts and local system leaders have put into delivering local plans, optimising the resources we already have and executing the elements of the overall productivity plan to deliver a better service for patients, and better value for taxpayers.
Productivity improvement in 2026/27
13. Despite the significant progress towards 2019/20 productivity, there is still a gap. More importantly there is still significant variation across providers on the unit cost of delivering the same service, accounting for population, local and organisational differences. Reducing the variation by getting to the best in class today will yield large productivity gains.
14. For 2026/27 planning, the focus therefore continues to be on narrowing the gap to the current productivity frontier, by improving clinical and operational productivity, strengthening financial and operational discipline, making all the use of nationally driven efficiency opportunities such as medicine optimisation and supply chain efficiencies.
15. We issued individual productivity and efficiency benchmarking packs in December. Each provider or system has a set of quantified opportunities based on their distance to the top performers, or to the national standards, in a given category. The categories by sector are set out below. For acute providers, we use the 2024/25 National Cost Collection data to identify where providers can be more efficient across all points of delivery. This data also allows providers to drill down to service and specialty level to inform necessary changes within trusts. Table 2 below shows these opportunities from the benchmarking analysis and planning requirements by sector and Point of Delivery/category.
Table 2 – breakdown of opportunities by sector and category
| Trust type | Category | Approach |
|---|---|---|
|
Acute and Specialist | Non Electives long stay A&E + short stay Non Electives Electives Outpatients Other Acutes |
Using National Cost Collection 2024/25, opportunities are identified by comparing a trust’s cost in certain specialty and service line with 75th percentile (taking into consideration casemix) |
|
Temporary Staffing |
Reduction in agency spend (30%) and bank spend (~10%) in line with spending limits set, with half of reductions in spending assumed as opportunity | |
|
Corporate Services | Opportunity identified by comparing trust’s corporate services spend against national 75th percentile by service function (HR, procurement, IT, finance) | |
Estates and Procurement
|
Benchmarking by estates areas (e.g. electricity and gas consumption) compared to the median trusts, plus opportunities in reducing general supplies and services spend as a % of trust income and 3% reduction in clinical supplies and services | |
|
Medicines |
Price reductions from switching to generics or biosimilars for specific molecules | |
|
Community | Community LOS Patient DNAs |
Opportunity based on length of stay to the national 75th percentile |
Temporary Staffing Corporate Services Estates and Procurement |
As above | |
|
Mental Health |
Mental Health LOS |
Opportunity based on reducing excess bed days to the national 75th percentile for each ward type |
|
NHS Talking Therapies |
Opportunity based on reducing did not attends (DNAs) and delivering contacts per WTE in line with the national 75th percentile | |
Temporary Staffing Corporate Services Estates and Procurement |
As above | |
|
Ambulance |
Handover |
Opportunity based on reducing all handover delays to 15 minutes |
|
Conveyance |
Opportunity based on improving conveyance to ED rates to the national 75th percentile | |
|
Incidents |
Opportunity based on improving incidents per WTE to the national 75th percentile | |
Temporary Staffing Corporate Services Estates and Procurement |
As above |
16. NHS providers and ICBs will be expected to deliver at least an annual 2% productivity improvement as part of their plans informed by these benchmarking opportunities, in addition to broader local efficiency savings to achieve financial balance. We have since created resources (NB – Futures login required) including webinars to help organisations understand and utilise the data, supplemented by discussions via regional teams to ensure the 2026/27 plans are ambitious and deliverable.
The future productivity opportunity
17. To deliver the standards and quality of care expected, with an aging population and increasing complexity of needs, the NHS must push out the productivity frontier to be financially sustainable as a taxpayer-funded system, free at the point of use for all. The productivity plan is bold in its ambition to do so through technological and digitally enabled transformation. Over the SR period, the balance shifts from getting to the current frontier towards a more technology enabled productivity improvement which incrementally shifts out the productivity frontier allowing each unit of input to become more productive than in the last period. This can only be achieved through the large-scale transformation in NHS technology described in a separate paper on the transformation plan, backed by the additional funding allocated at the Spending Review settlement.
18. In addition, as described in the 10 Year Health Plan, there are significant allocative efficiencies from shifting care away from the acute hospital environment to community settings, a concerted preventative approach and radically reimagined care models that utilise new and emergent technologies.
Technology
19. Technology and digital investment can enable large amounts of productivity potential, but decisions must be taken to implement those systems, to realise the benefits, and (where appropriate) to remove current systems and process that are a drag on improvement). This translation of potential into actual is an area we have historically underperformed in. Tackling this challenge will require increased spend on implementation and business change, which will be facilitated by the Transformation SR settlement, but also – and just as critically – a different management approach to mainstream the ‘ownership’ of technology-derived benefits. This latter part involves everything from implementing systems at the frontline and to ensuring they are well-used and duplicate analogue processes stripped out, through to adjusting regulations, operating guidance, the National Oversight Framework, or the NHS Payment Scheme to directly incentivise the use of technologies.
20. We are already seeing significant productivity benefits this year from existing investments. Wayfinder in particular (the programme which enables patients to book appointments and engage in documentation with trusts) has significantly exceeded its benefits target for the year and can demonstrate major reductions in the DNA rate where it is installed. There is also good and growing evidence that providers that fully connect to all the core services of the NHS App see a 2.5-3% improvement in their waiting lists.
21. Most private businesses have made efficiency gains through the company-wide application of highly efficient and standardised approaches. This is at odds with our current model, which gives a high degree of discretion to local providers, and in turn makes it complex and expensive to integrate services into the NHS App and to provide a low-cost digital-first service in front of (more expensive) face to face care. Initial work to tackle this problem, to evidence the potential to shift to a digital-by-default service model, is being done now with mental health.
22. We are already seeing some evidence of this potential to go further. For instance, Dora is a UKCA-marked class 1 artificial intelligence clinical assistant that can telephone patients and have a routine clinical conversation. The aim is to provide a standardised, high quality and efficient patient experience.
23. At Buckinghamshire Healthcare NHS Trust patients who have uncomplicated cataract surgery are assessed for their suitability for telephone follow-up by the nursing team in the discharge lounge. The nursing team provides a date and time that Dora will call them should they wish to participate and they go home with an information leaflet about the process. The telephone call occurs three weeks postoperatively at the stated time.
24. Dora collects a standardised set of symptoms, asks whether or not they prefer to have their second eye operation, answers common questions, and collects feedback on the service provided. This information is used by the hospital team to support a decision on whether further follow up is required. The majority of patients find Dora simple to use and convenient, and are happy that it saves time and money for them and the NHS.
25. This use of AI frees up clinical time to deliver care to more patients, cutting waiting times by delivering more activity with the same workforce. But the technology will only improve productivity if it is deployed effectively and clinical practices change to complement the innovation. Too often technology has been implemented in the NHS only to create duplicative processes and increase admin time.
26. Taking these opportunities at scale – across all pathways – would require us to set a highly ambitious vision through the Modern Service Frameworks and to then enforce and incentivise the use of these technologies through, for example, the application of Best Practice Tariffs in the NHS Payment Scheme.
Shifting left
27. In the medium to longer term there needs to be changes in how and where services are delivered and a much greater focus on prevention and self care. More immediately, changes and improvements to the NHS App will signpost people to the right service and lessen the administrative burden of delivering care, and reduce the future demand for care by intervening before sickness develops or worsens.
28. The 10 Year Plan set the vision to shift care from the hospital into the community which will, shift the pattern of health spending. Over the course of the Plan, the share of expenditure on hospital care will fall. The potential productivity savings of this shift are large, and potentially outweigh the cumulative benefits of covid catch up, reducing variation and digital productivity discussed so far.
29. For example, the ability to avoid a costly ambulance call out, transfer to A&E and overnight admission for an elderly patient who is actively managed through remote monitoring and a community nursing team could be £000s each time – and significantly more comfortable and disruptive for the individual. Replicated across the country against the backdrop of an aging population we could see large savings which will also improve A&E performance and quality of care received by people who do need a hospital admission.
30. In another example, NHS trusts delivered around 53m outpatient follow up appointments costing £9.0bn in 2024/25. Being able to provide these in different ways, for example through more patient initiated follow up activity and using AI and remote monitoring to remove some of this clinical activity all together could free up £bns to reinvest elsewhere.
31. A focus on system-wide productivity is essential when designing Neighbourhood Health services. This will also likely necessitate a new approach to funding flows and the role of the NHS Payment Scheme in ensuring financial incentives are pointed in the right place and supporting the right activities being undertaken at efficient cost.
Summary
32. The need to deliver 2% per year productivity improvements over the next 4 years is challenging by historical standards, but achievable given the scale of variation which currently exists. Our most recent productivity performance data demonstrates that the NHS is meeting this challenge.
33. But there is scope to deliver more, especially in the medium to long term, if we can fully realise the potential of technology and ‘left shift’ care and treatment, which will require a coordinated whole system effort to achieve.
Annex A – A guide to terminology
1. Efficiency and productivity are often used interchangeably but do have different meanings. For NHS performance we often consider these through two key lenses – productivity (or technical efficiency) and allocative efficiency:
- Productivity (technical efficiency) is fundamentally about doing things right –delivering services in the most efficient way by using resources effectively and maximising outputs for a given level of input. The current productivity plan is driven in the main by an approach to improving core productivity that benchmarks organisations across the NHS to each other. We compare performance at the 75th percentile (that is, the bottom of the top quartile) and highlight the operational opportunities that exist if an individual organisation is able to match the performance of peer organisations at that level. As well as levelling up variation, the plan also builds in expected improvements across all organisations, through things like increasing same day care and reducing length of stay – areas where all organisations should be improving.
- Allocative efficiency is a wider concept about ensuring resources are deployed against the most impactful interventions and leads to choices about the distribution of resources to best meet the needs of our patients and populations. Where money could be spent on more impactful care to improve health (for example, on primary or secondary prevention) it could lead to allocative efficiency gains. The 10 Year Plan sets out the left shift strategy which over the period would result in an increase in primary prevention to improve population health and an increase in secondary prevention to avoid deterioration or complications of poor health or complications of health conditions. All of these require changes to the current allocation of resources. Many of the major technology investments and opportunities make a greater difference to this measure because they can redistribute activity or negate the need for activity entirely, potentially causing activity measures which feed the productivity metric to appear flat or decline.
2. It is helpful to distinguish between different types of productivity and efficiency when thinking about NHS performance – both to assess how the NHS nationally and NHS organisations locally are currently performing, but also where opportunities for growth may be in the future.
3. We first consider what the aim of improvement is – to maximise population health and health outcomes given the money available to the NHS through Government spending – and then breaking up how the NHS does that.
4. e must convert the money that the NHS receives into inputs (staff, buildings, drugs, scanners etc) and combine those inputs together to produce outputs/activities (OP attendances, GP appointments, cataract procedures, etc). We must then make sure that the activities being produced deliver improved outcomes (do more of the things that are effective, stop doing things which are ineffective). At different stages on this journey we can maximise value. Figure A1 describes in more detail.
Figure A1 – From money to outcomes
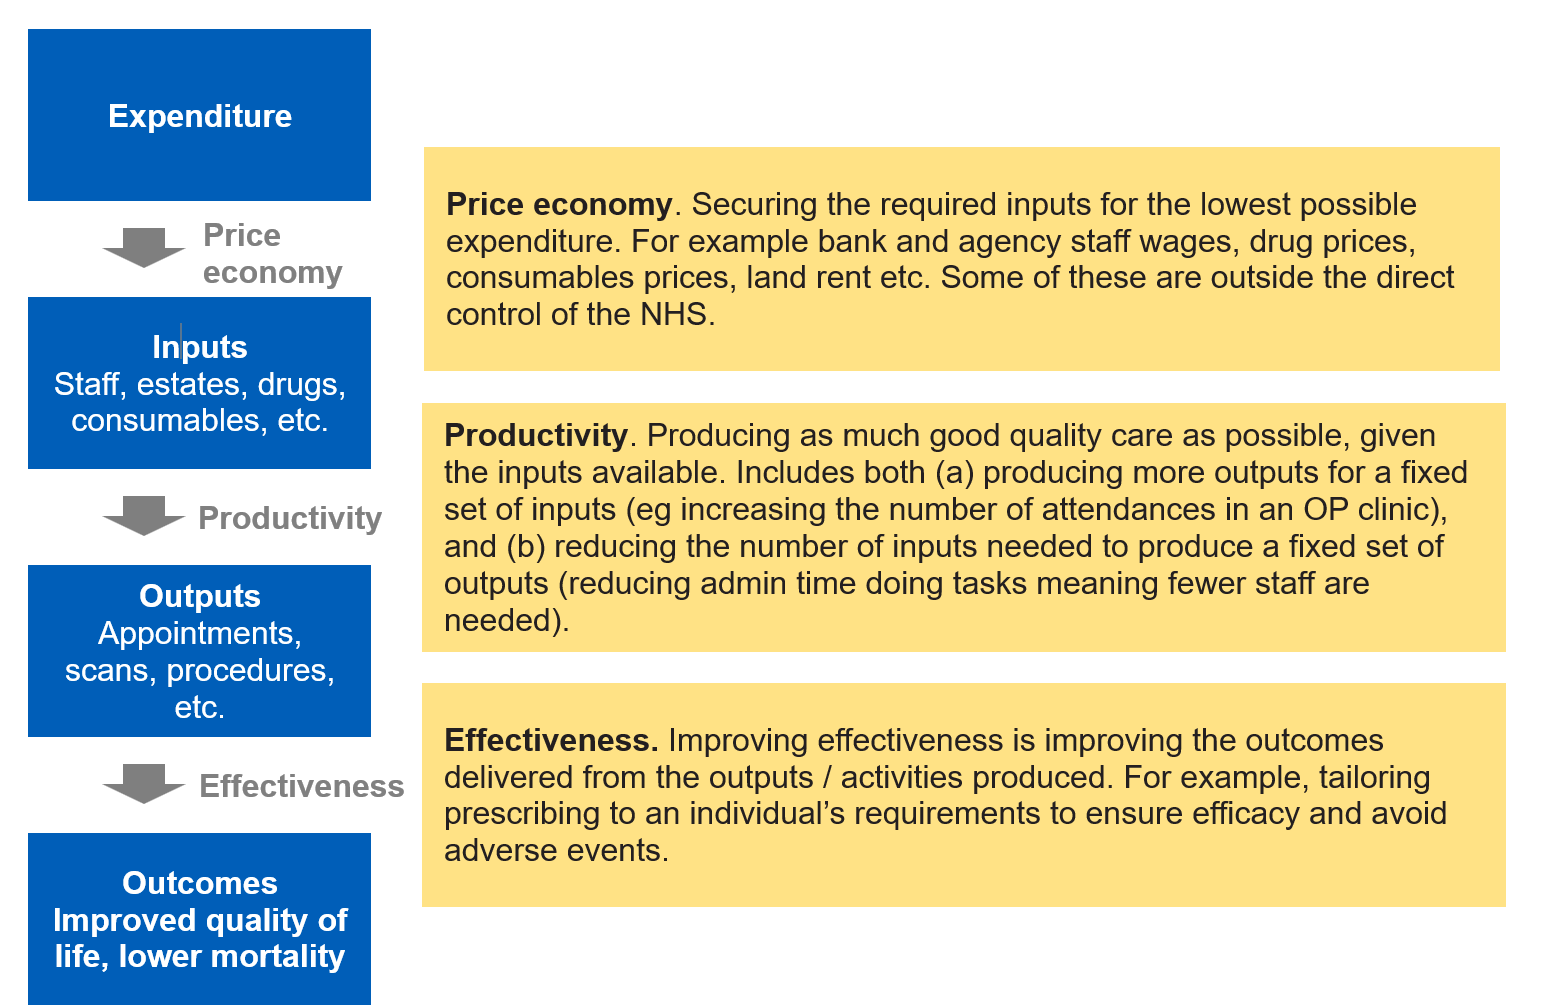
5. Productivity therefore is a relatively narrow measure of overall value, and does not take into account how cheaply we can procure our inputs or how well the activities being delivered are appropriate to deliver health outcomes.
6. Another term regularly used is that of technical efficiency. Technical efficiency is linked to the narrow definition of productivity and shows how far away a trust is from the most technically efficient trust with an equivalent set of inputs at that point in time. So a trust can show productivity improvement in any particular period, but still not be technically efficient because a similar trust may be producing more with the same level of inputs. It is on this basis which opportunity packs have been produced for the sector as part of planning to see how much further they can go in improving their productivity towards the most efficient trusts.
7. Finally, allocative efficiency is a broader term which looks at the totality of value. Within the NHS, it reflects the choices we make in relation to the mix of activity we undertake and whether this is the optimal mix of activity (in hospital, out of hospital, and even what activity is delivered within those different settings for example) to maximise outcomes for patients for the given level of resources available to us.
8. This is where the vision as set out in the 10YP is most relevant. If we are to move care out of the acute sector (where we count activities very well) and do more community and prevention activity (where we traditionally do not count activities well) then the narrow measure of productivity may fall in the acute sector but overall value will go up – because we are delivering more health outcome for the money we have.
Annex B – latest productivity estimates as at M6 YTD 2025/26