
1. The market forces factor and its use in the NHS Payment Scheme
This document is published in support of the 2025/26 NHS Payment Scheme (NHSPS).
It is a guide to the market forces factor (MFF). The MFF estimates the unavoidable cost differences between healthcare providers. It is also used to adjust resource allocations in the NHS in proportion to these cost differences, so that patients are neither advantaged nor disadvantaged by the relative level of unavoidable costs in different parts of the country.
NHS England calculate an individual MFF value for each NHS trust and foundation trust. The relative values for all trusts are presented in two indices:
- The underlying index, which is used to adjust funding for integrated care boards (ICBs): in higher cost areas, ICBs receive higher levels of funding through the allocation formula so that they are able to meet the higher costs of providers for the same level of healthcare.
- The payment index, which is used in the NHS Payment Scheme (NHSPS) to adjust unit prices for each provider.
Both the payment and underlying index values have the same percentage differences between providers; one is a simple rebasing of the other.
Unless otherwise stated, the index referred to in this document is the payment index.
To ensure that the MFF continues to reflect the latest information on unavoidable costs the data underlying the calculation of the MFF for the 2025/26 NHSPS have been updated.
This document explains:
- what the term ‘unavoidable costs’ means for the MFF;
- how the MFF is applied to both ICB allocations and amounts providers are paid, either through aligned payment and incentive agreements or payments using unit prices published in the NHSPS; and
- how the updated MFF values have been calculated and how they will be implemented.
The workbooks for the complete MFF index calculation and the non-medical and dental component model are published as supporting documents to the 2025/26 NHS Payment Scheme.
2. Unavoidable costs
‘Unavoidable costs’ refers to the costs that providers are unable to influence significantly. For example, land, buildings and staff unit costs can all vary across the country for reasons that are beyond the control of healthcare providers. Trusts operate in a specific region and they must face the costs associated with their location. For example, hospitals in London may face higher unavoidable costs than those in other parts of the country.
3. Application of the market forces factor
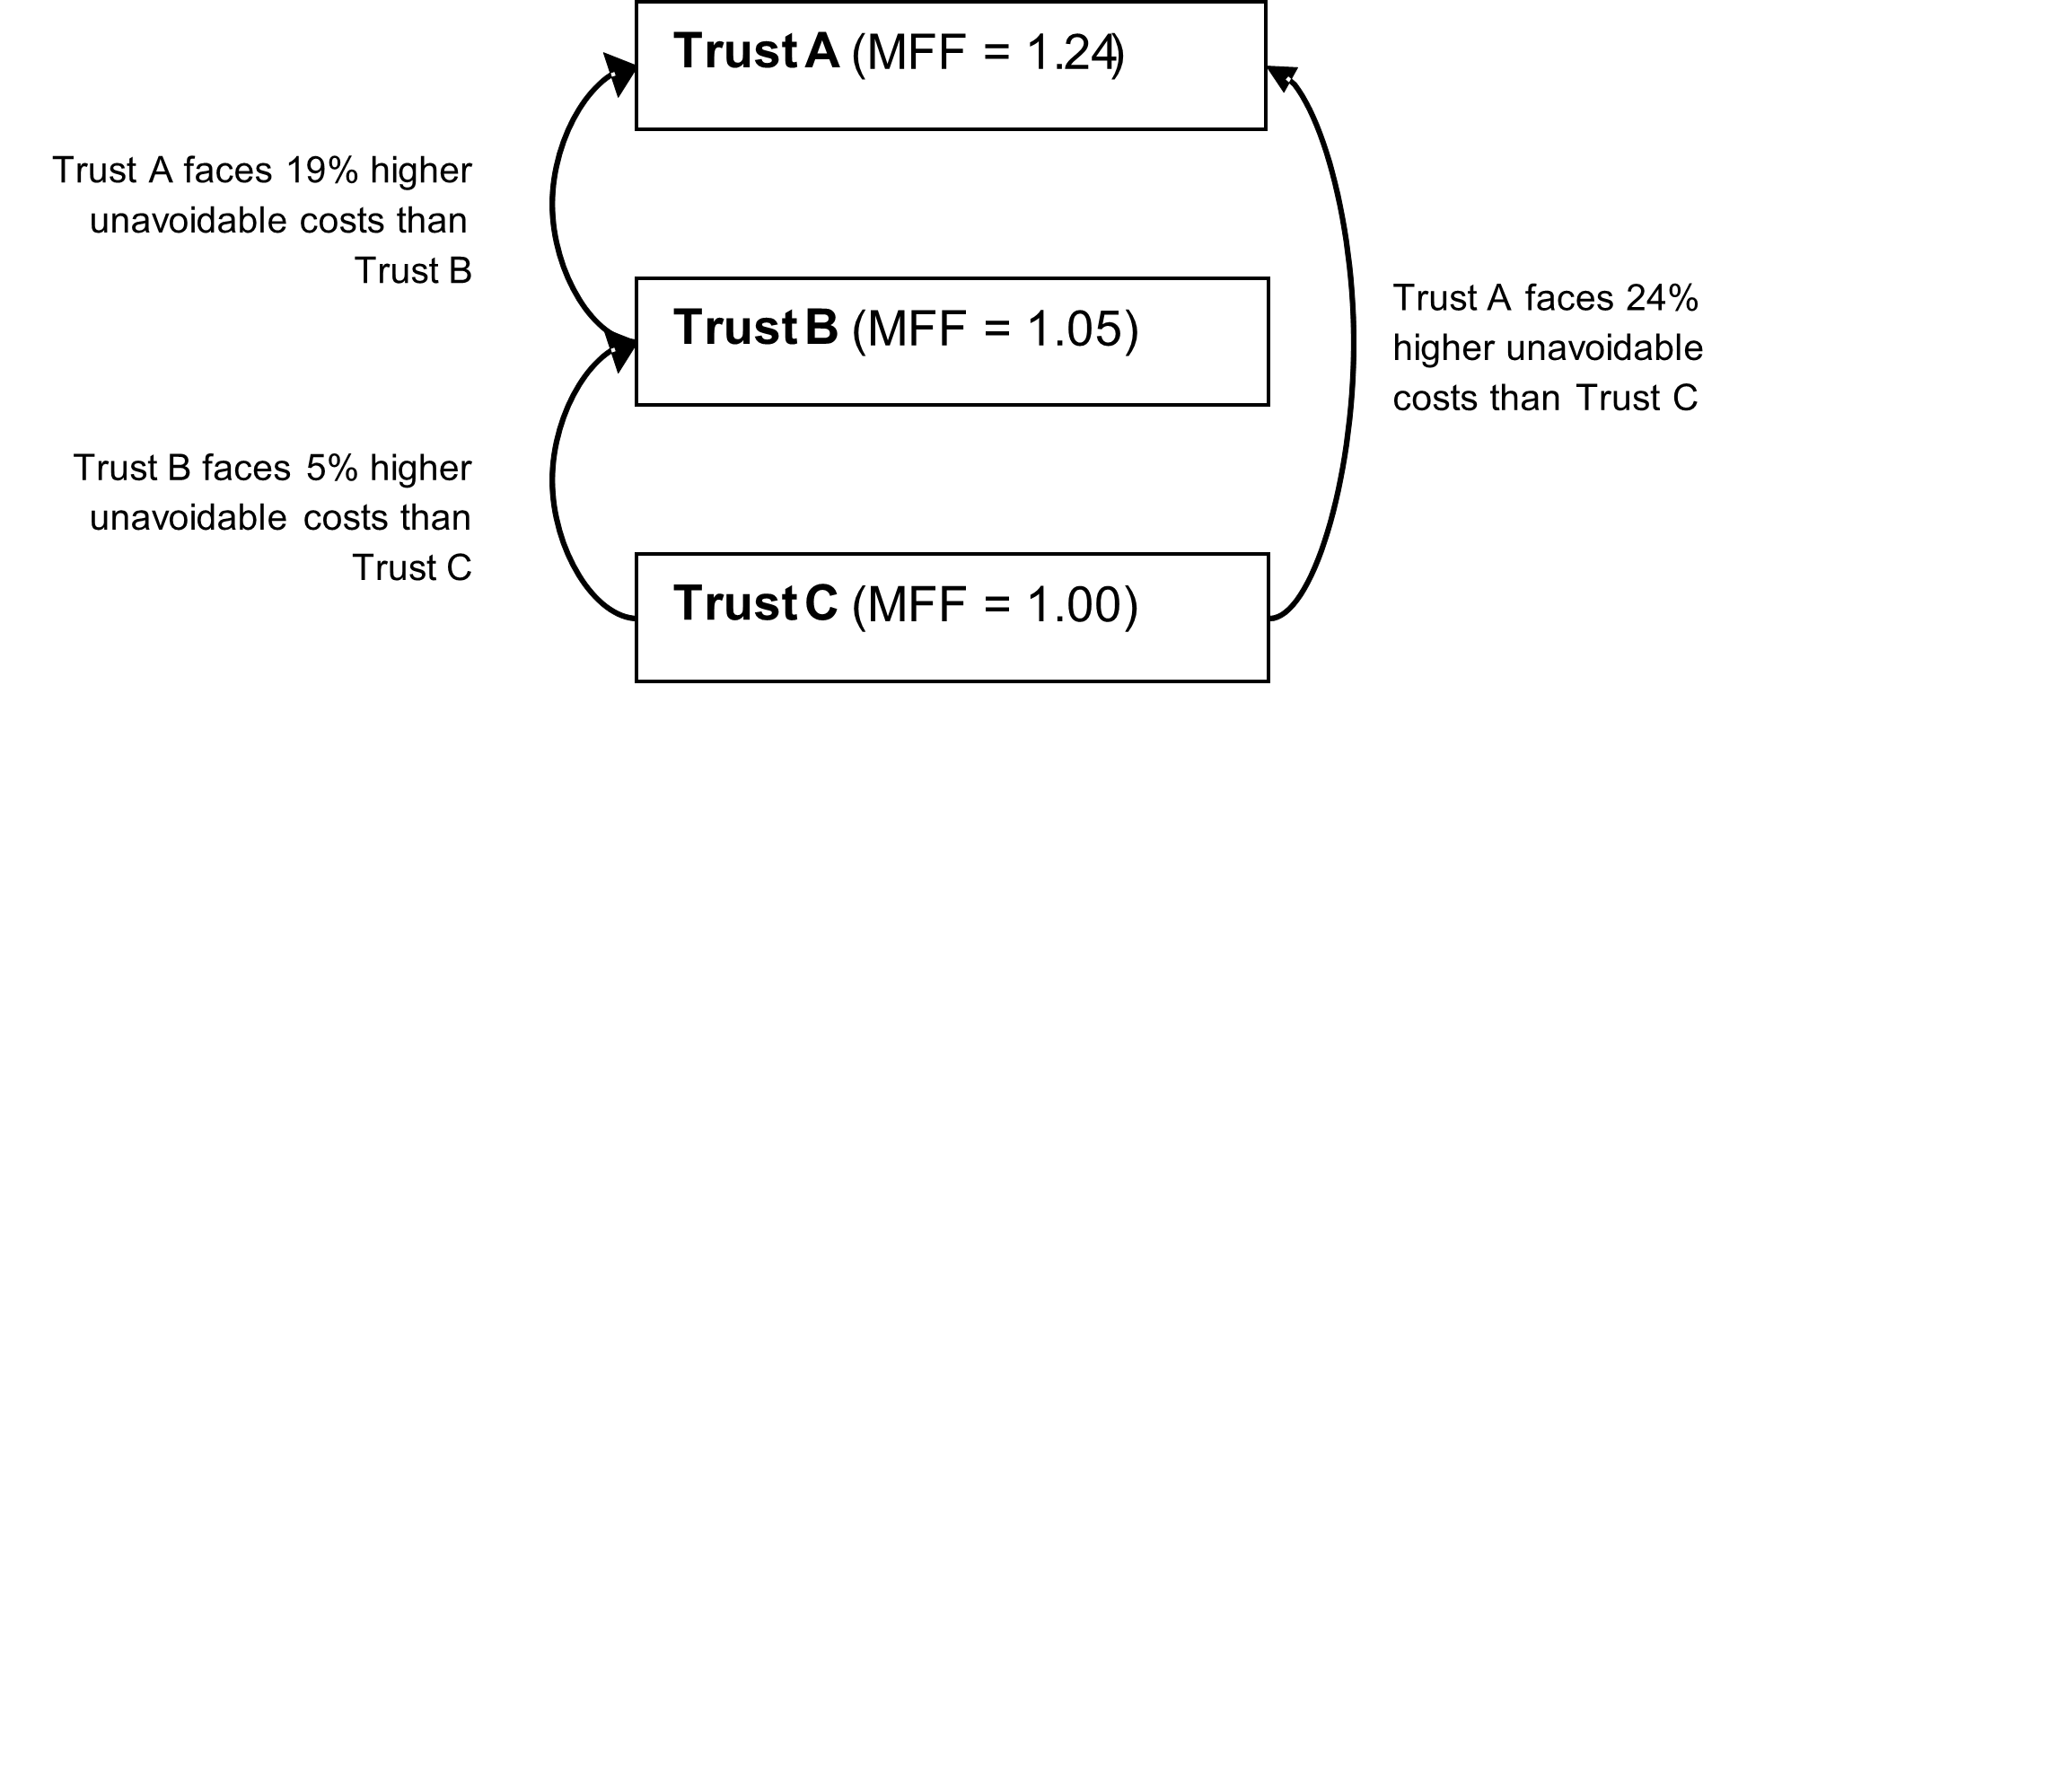
The MFF compares the estimated unavoidable costs between organisations and assigns each organisation an index value according to the relative level of unavoidable costs they face.
In Figure 1, Trust C is the lowest cost provider, Trust B faces unavoidable costs estimated as 5% greater than C and Trust A faces unavoidable costs estimated as 24% higher than Trust C.
Figure 1: Comparison of relative trust MFF values
These relative levels of unavoidable cost are expressed in two MFF indices:
- the underlying index
- the payment index.
Both indices are based on the same set of data.
Underlying index and ICB funding
The underlying index is used to inform ICB allocations. This approach is intended to ensure ICBs in any geographical area can afford the same level of care for the need of their population. ICBs receive different allocations depending not only on the size and needs of their population but also on the varying unavoidable costs of services in different areas. ICBs in higher cost areas receive extra funding to ensure they can afford the same level of services, relative to need, as those in other areas.
In contrast to the payment index, with the lowest value of 1, the underlying index is constructed with the England average set to 1, with individual provider values varying above and below 1. However, the ratio between any two providers’ MFF values will be the same whether the payment or the underlying MFF is used.
The underlying index is also used to calculate the National Cost Collection Index. See Appendix D for further details and a worked example.
Payment index and NHSPS prices
Where NHSPS unit prices are used, the payment index is used to adjust them in proportion to the level of unavoidable costs for each provider.
When used, NHSPS unit prices reimburse the costs that all providers incur and the MFF separately compensates those facing more than the minimum level of unavoidable costs.
For payment based on NHSPS unit prices, the provider’s MFF value is multiplied by the NHSPS unit price for each unit of activity:
- Provider income = (activity x NHSPS unit price) x MFF value
For example, Trust A has an MFF value of 1.20 and undertakes 100 units of activity with a NHSPS price of £500 per unit. For this activity Trust A receives a total income of £60,000, of which £10,000 is for MFF payments, intended to compensate for extra unavoidable costs they face.
- Trust A income = (100 x £500) x 1.20 = £60,000
Market forces factor and the aligned payment and incentive approach
The aligned payment and incentive approach involves activity being paid for by fixed and variable elements, rather than reimbursement based solely on unit prices.
Changes in MFF should not immediately translate into a change to the fixed payment value. However, it should be considered when applying local efficiency requirements, including convergence or deficit reduction and activity growth. Such requirements should be considered in aggregate; for example, convergence may moderate the impact of MFF changes for a commissioner. Where adjustments in fixed payment are agreed to be actioned over time, a clear plan should be documented on what changes are expected and when they will be actioned. For elective services, providers are paid 100% of NHSPS unit prices with relevant MFF value applied.
Market forces factor and local prices
We expect that locally determined prices are based on actual costs. Therefore, MFF would not affect existing arrangements. However, such local prices which are based on the provider MFF could be adjusted for revised MFF values, and for any shift in funding from MFF to NHSPS prices. Moving to 2025/26 MFF values reduces the total amount of money that would have been paid through the MFF if all activity was reimbursed using national prices and unit prices. To offset this reduction, there was a compensating increase of 0.41% in 2025/26 prices compared to 2024/25. Providers and commissioners can consider how to take account of changes in provider MFF values when agreeing their contract values.
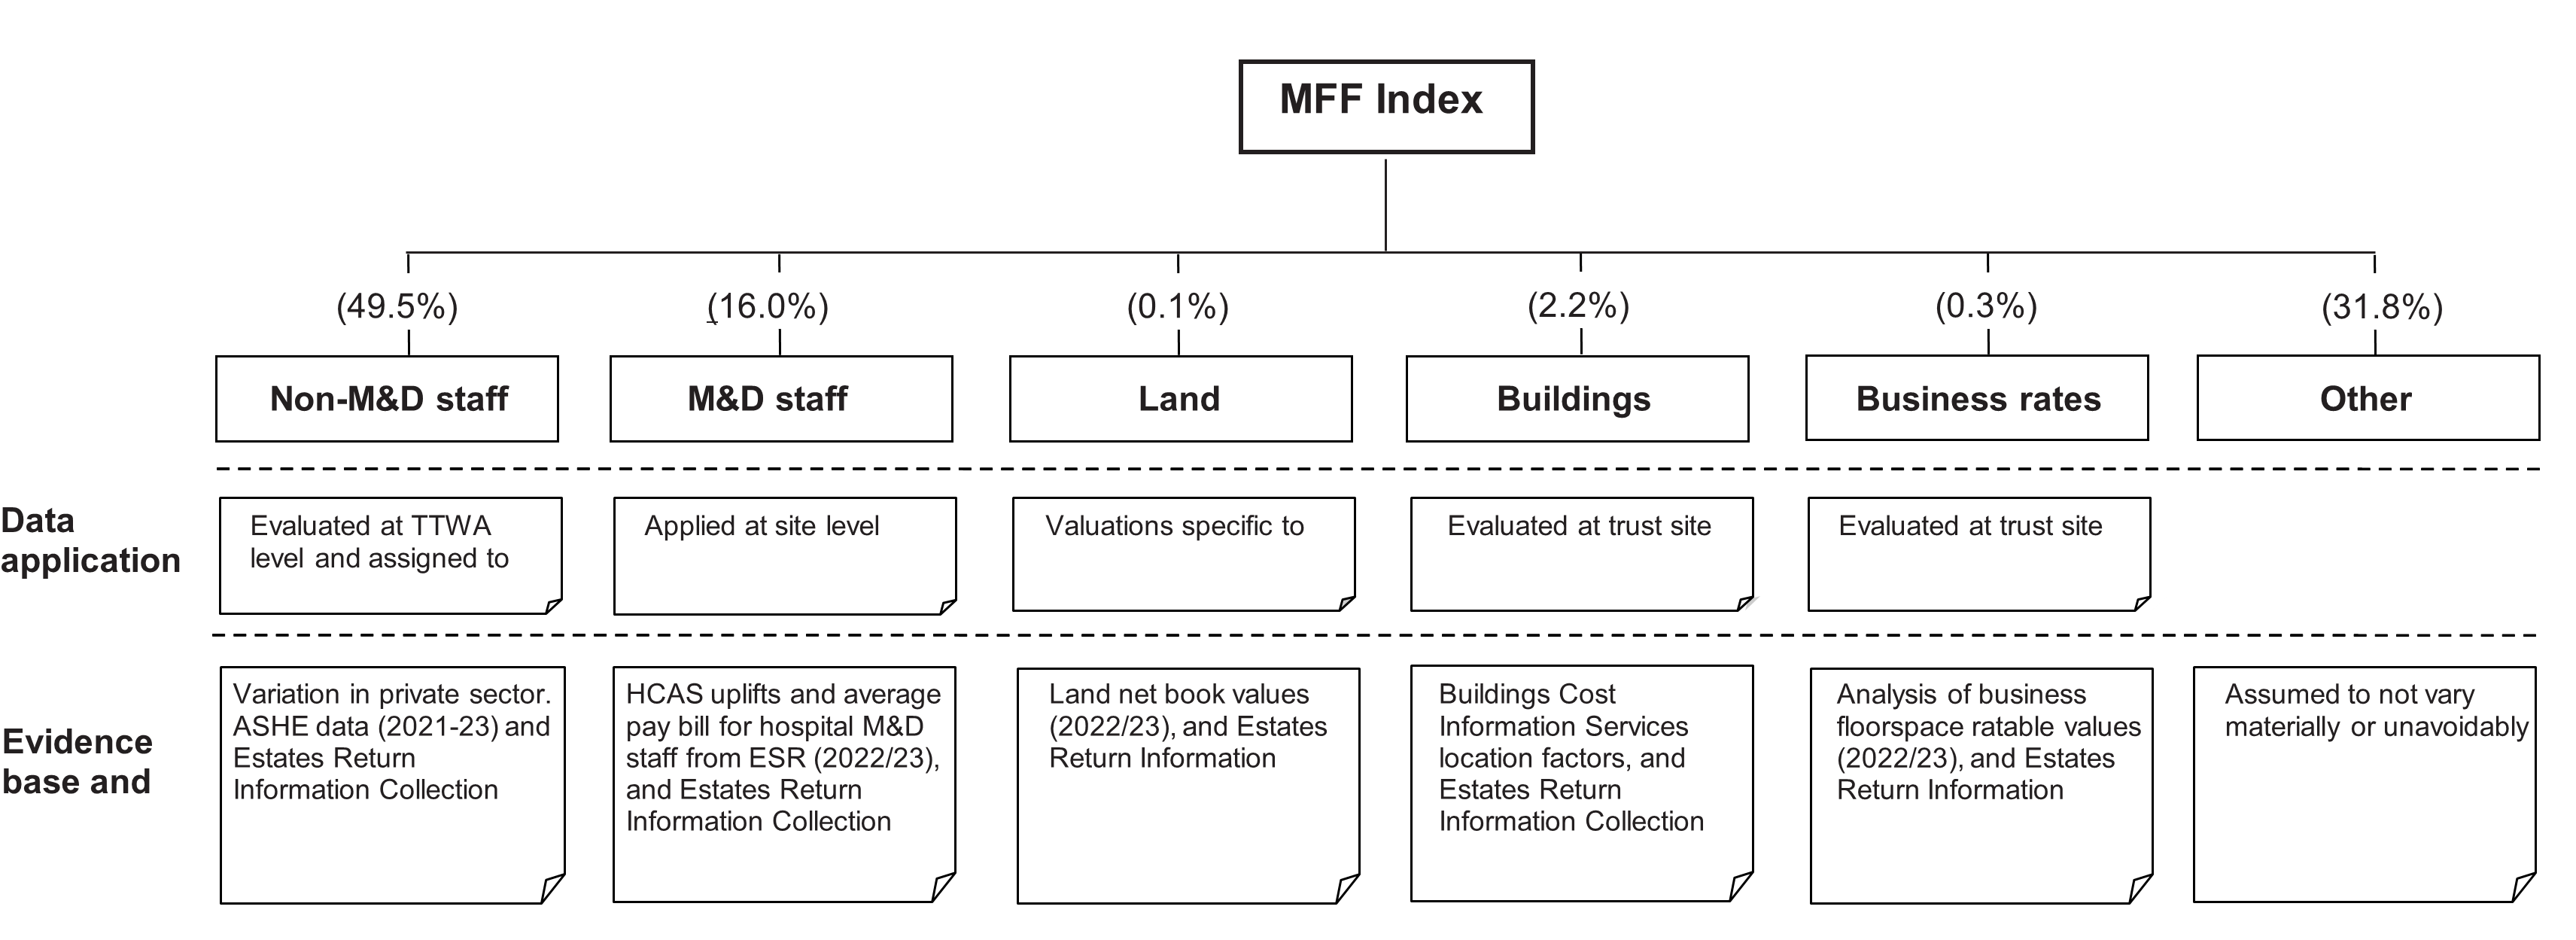
4. Components of the market forces factor
The MFF consists of the following components:
- non-medical and dental (M&D) staff
- M&D staff
- land
- buildings
- business rates
The level of cost differences in each component is calculated independently. They are then combined, using the national operating revenues reported in NHS accounts as weights, to create an overall payment index for each organisation. Table 1 summarises the composition of the MFF. The rest of this section gives more detail about each of the components.
Table 1: Components of the MFF index
Component | Weight |
Method and rationale for inclusion |
|---|---|---|
Non-medical-and-dental (non-M&D) staff | 49.5% | The local rate of pay in the broader labour market is used to take account of variations in both direct and indirect employment costs, including those that are not fully addressed by national pay scales and regional pay allowances. Indirect employment costs include, eg higher turnover and vacancy rates. The going rate of pay in the private sector is estimated for each travel to work area (TTWA) using statistical modelling to remove the effect of differences in industrial structure, occupations and demographics between TTWAs. The values for each site are smoothed when they are in different TTWAs but are located relatively close to each other. This reduces large differences in MFF values between trusts in neighbouring TTWAs. Each trust site value is determined by the TTWA where it is located. The sites are then aggregated up to trust level using gross internal floor area. |
Medical and dental (M&D) staff | 16.0% | This accounts for the nationally set allowance that M&D staff receive in addition to their Agenda for Change (AfC) pay if they work in London or fringe of London. |
Buildings | 2.2% | Building assets have different costs between providers and therefore incur different capital charges and depreciation. The index is based on data on construction costs by postcode provided by the Buildings Cost Location Service. The trust site index is determined by the postcode where it is located. The sites are then aggregated up to trust level using gross internal floor area. |
Land | 0.1% | This reflects differences in providers’ financing costs due to differences in land values. The index is based on trusts’ net book values for land per hectare. |
Business rates | 0.3% | This accounts for the higher business rates that providers pay. These are based on areas rental values. The index is based on floor space rateable values published by the Valuations Office Agency. Rates are mapped to provider sites prior to aggregation to trust level using gross floor area. |
Other | 31.8% | This allows for costs (eg equipment, consumables) that are not considered to vary materially and unavoidably between providers. |
|
Component weights | The components are normalised by MFF-adjusted operating revenue before being combined to give a single MFF value for each provider using the national proportions of expenditure for each component as reported in NHS accounts (% weights above). |
Non-M&D staff index
The non-M&D staff index applies to all non-M&D clinical staff, and non-clinical staff. Unavoidable variation in staff costs arises because wages in local labour markers vary. National pay scales implemented by the NHS (including regional pay allowances) may not fully reflect the variation in employment costs evident in the broader labour market. This can lead to indirect costs such as greater use of agency staff and higher vacancy and turnover rates. It can also lead to differences in staff productivity.
For this reason, the non-M&D staff index is based on variation in wages in the private sector. Appendix B provides further information on the rationale behind this approach. The data for this index are from the Annual Survey of Hours and Earnings (ASHE), produced by the Office for National Statistics. Three years of ASHE data (2021 to 2023) have been pooled to calculate the non-M&D staff index.
The non-M&D staff index is based on the pattern of wages calculated within defined geographical areas (travel to work areas or TTWAs, geographical areas determined by ONS) that approximate local labour markets. The values for each site are smoothed (applying a form of weighted averages) when they are in different TTWAs but are located relatively close to each other. This reduces large differences in MFF values between trusts in neighbouring TTWAs. Each trust site value is determined by the TTWA where it is located. The sites are then aggregated up to trust level using gross internal floor area. Appendix B outlines the smoothing technique in more detail.
Medical and dental staff index
M&D staff costs do not vary in the same way as those of other staff groups. The M&D staff index only applies to trusts in London and London fringe areas. It is calculated as the ratio of the London allowance (high-cost area supplement – HCAS) and the average pay bill per head for hospital doctors in 2022/23 outside London.
Buildings index
As assets, buildings will unavoidably have different costs in different parts of the country. Where a building is more expensive, the trust will pay more in capital charges on this asset relative to a trust located in a lower cost area.
The buildings index is based on postcode geography data. The Building Cost Information Service (BCIS) analyse tender prices for both public and private contracts across the UK in order to derive location factors. These location factors are mapped to each site by postcode prior to determining a site weighted value. An average of the site indices weighted by gross internal floor area is then used to calculate the overall trust buildings index.
Land index
Land incurs unavoidable costs for two reasons:
- it cost trusts more to acquire land in certain areas of the country than others; and
- the capital charges paid on this land will also be higher.
A land index based on land value per hectare is calculated for each trust, using net book value of land as reported in the 2022/23 audited accounts. The land areas for each individual trust were aggregated from the site-level data in the 2022/23 Estates Return Information Collection.
Business rates
This component accounts for the higher business rates that providers in areas with higher rental values currently pay either directly to local authorities for buildings they own, or indirectly via rental or management charges for providers that lease their buildings.
The business rates index is based on floor space rateable values published by the Valuations Office Agency. Rates are mapped to provider sites prior to aggregation to trust level.
Other
The category of ‘other’ costs is included as an extra factor in the final MFF value. The costs included in this element are all those that are not considered to vary significantly by location (such as equipment and consumables costs). As these costs do not vary by provider, all organisations receive the same value.
It is necessary for non-varying costs to be represented in the overall value as the MFF is applied to the full scope of costs, not just those with elements that vary by area. Since the NHSPS price is based on total running costs per unit of activity, the MFF must reflect all components of costs that drive this price.
5. Creating the market forces factor
MFF values are calculated using the latest data available and the values are included in consultations on proposals for a new edition of the NHS Payment Scheme.
The overall MFF value for each organisation is a combination of the components outlined in Section 4.To create an overall MFF value for an organisation, the index value for each component of the MFF is first normalised (by MFF adjusted operating revenue). Normalisation adjusts for the difference in calibration and mean levels between component indices. Each normalised index is multiplied by its proportion of national operating costs (the component weight listed in Table 1). This approach applies a weight to each element of the MFF equal to its proportion of total costs. The normalised and weighted index values are then added together to produce an overall MFF figure for the organisation.
See Appendix C for a worked example of the calculation process.
Deriving a market forces factor value for newly merged trusts
Where mergers occur in-year (ie during the period that a Payment Scheme is in effect), or after MFF values have been produced for a consultation on a new edition of the Payment Scheme, merger-adjusted indicative values will be calculated.
These values are calculated using the weighted average of the merging trusts’ MFF values. Weights are derived from the operating revenue of each trust using data from the same year as data used to perform calculations in the Payment Scheme currently in effect. They would be indicative values and will be shared with the trust(s) affected by the merger. An MFF value for the newly merged organisation would be included in the consultation on the next edition of the Payment Scheme.
Please contact england.pricingenquiries@nhs.net for any enquiries on mergers.
Deriving a value for independent sector providers
The MFF value for independent sector providers should be the MFF value of the NHS trust or foundation trust nearest to the location where the services are being provided.
Deriving a value for outsourced activity
Where one provider (A), with its commissioner’s permission, sub-contracts the delivery of a service to another provider (B), the commissioner will continue to pay provider A for the activity in the sub-contracted service, and provider A will then pay provider B under the terms of its sub-contract. As regards to MFF, the following will apply:
- In relation to what the commissioner pays provider A, where MFF is applicable, the applicable MFF will be the MFF value of provider A. Where provider A is a trust, that trust’s MFF value will apply, and where the provider is an independent sector provider, the MFF of the nearest trust will apply.
- The payment from provider A to provider B under their sub-contract is not covered by the NHSPS rules and is a matter for local agreement between these providers.
Deriving a value for remote/virtual services
Where services are provided remotely / virtually, in whole or part, dealing with MFF becomes complex – because the staff providing remote / virtual services will not necessarily be based in the same physical location. Therefore, the following approach should be followed:
- Where the provider is an NHS trust or an NHS foundation trust and the trust provides some services remotely/virtually, the MFF of that trust will apply.
- Where the provider is an independent sector provider, and where the minority of its service provision under a particular contract is to be on a remote/virtual basis, the MFF which applies will be the MFF of the acute trust nearest to the location where the services are being provided, in accordance with the section on ‘Deriving a value for independent sector providers’ above.
- Where the provider is an independent sector provider, and where the majority of its service provision under a particular contract is to be on a remote/virtual basis, the commissioner and provider should agree on a suitable MFF value to apply. This should take into account where the provider intends that the staff providing the remote/virtual services are to be based and the costs which it will therefore incur.
Appendix A: Composition of the market forces factor
Non-M&D = non-medical and dental clinical and non-clinical staff, M&D = medical and dental, TTWA = travel to work area, and ASHE = Annual survey of hours and earnings
The index values of each of the component indices are normalised and then multiplied by the corresponding expenditure weight to give the overall MFF value.
Appendix B: The non-M&D staff index
This appendix outlines:
- the rationale for basing the non-M&D staff index on private sector wages rather than NHS wages
- the application of cliff edge ‘smoothing’.
Underlying data for the staff index
The non-medical staff element is the single largest component of the MFF. Although the staff index is intended to reflect non-medical NHS staff cost variations, it is based on private sector rather than NHS wages.
Staff cost variation can occur directly or indirectly. Direct costs are the salaries paid to staff; indirect costs include expenditure incurred through staff turnover, agency staff costs, vacancies and reduced productivity.
High indirect employment costs can arise for NHS providers where the wage rate they offer is below the prevailing wage rate of the area from which they draw their staff. Organisations offering relatively low wages are likely to experience higher vacancy and turnover rates than other employers.
Basing the MFF on external wage comparisons
The premise of the approach is that the private sector wages reflect a good approximation of the relative cost of living and amenities between areas, and the relative demand and supply of labour between areas.
It would not be fair to simply take the actual average private-sector wage in each area because occupational mix varies. Some areas have a much higher proportion of staff working in highly paid occupations such as law and banking. These differences need to be taken into account in the MFF to ensure that we are making like-for-like comparisons across the country. The methodology considers this by using a statistical technique known as regression analysis, which works out what wages would be in an area if each area had the same mix of occupations. We similarly take account of differences in the age and gender mix of the private sector workforce in different areas.
Smoothing
Smoothing (a form of weighted averages) is used to refine the non-M&D staff index values so that the values for each organisation better reflect the local labour markets from which they recruit.
The methodology associated with this index creates the possibility of markedly different values occurring between neighbouring Trusts in different TTWAs due to their geographical boundaries. These marked differences are known as ‘cliff edges’. Cliff edges may lead to an inaccurate representation of staff costs faced by a provider. This problem is particularly evident for providers in different TTWAs, but in close proximity to each other. Smoothing techniques soften cliff edges to produce a more continuous profile of staff costs between providers in different but neighbouring TTWAs.
Each site is given the MFF value for the TTWA in which it is located. Smoothing is undertaken at site level. Each site is given the weighted average of the MFF values of all sites up to 50km away. The weighted average includes the MFF value of the site in question. The weights decline exponentially as the distance apart increases (known as a distance decay function). The adjustment is largest where sites are closest to each other and have significant differences in the ‘pre-smoothed’ staff index values. This is typically the case when trusts are located close to the boundary of TTWAs.
Appendix C: Worked example of the market forces factor calculation
The example below shows the calculation of the MFF for Provider A. It shows how the MFF index components are normalised by operating revenue then combined using the weights for staff, buildings, land, business rates and other costs.
|
Component |
Index value |
Normalisation factor |
Weighting % |
Normalised and weighted index |
|
|
A |
B |
C |
D=(A/B)*C |
|
Non-M&D staff |
1.0199 |
1.0614 |
49.5% |
0.4756 |
|
M&D staff |
1.0000 |
1.0039 |
16.0% |
0.1594 |
|
Buildings |
0.9866 |
1.0064 |
2.2% |
0.0216 |
|
Land |
0.7228 |
2.2928 |
0.1% |
0.0003 |
|
Business rates |
1.0696 |
1.0478 |
0.3% |
0.0031 |
|
Other |
1.0000 |
1.0000* |
31.8% |
0.3180 |
|
*index value is the same for all trusts. | ||||
This gives an overall target MFF value of:
0.4756 + 0.1594 + 0.0216 + 0.0003 + 0.0031 + 0.3180 = 0.9780
The above value is the underlying index value for Provider A. This index is centred around 1 (ie the underlying MFF index has a weighted average of 1). To ensure that all trusts receive non-negative payment of the MFF, the underlying index is rescaled to a payment index with a minimum value of 1.
To set the minimum of the payment index to 1, the underlying index, with an average of 1, is divided by the minimum MFF value. For example, where the minimum underlying index value is 0.9456, the final MFF value for Provider A would be calculated as follows:
0.9780/0.9456 = 1.0343
Appendix D: National Cost Collection Index
The National Cost Collection Index (NCCI) is an index of the relative cost efficiency of NHS organisations. The NCCI is adjusted by the MFF to ensure a fair comparison between organisations across England. For the index to be comparable year-on-year the index must have an average of 100. To ensure this, the application of the MFF to costs must be cost neutral, ie the total national value of costs submitted must be the same whether it includes or excludes the MFF. To get cost neutrality the underlying MFF is scaled. The extent of this scaling depends on the percentage difference between the amount of costs before application of MFF and after it.
The following table shows how the underlying MFF is scaled so that the total amount of costs is kept constant at £4,500. This is necessary to ensure the national average NCCI is 100. The factor used to scale the underlying MFF is the percentage difference between costs before and after application of the MFF.
Scaled market forces factor for National Cost Collection Index
|
|
A |
B |
C = B / A |
D = A* (sum C / sum B) |
E = B / D |
|
Underlying MFF |
Total costs (£) |
Total costs adjusted for underlying MFF (£) |
Scaled MFF |
Total costs adjusted for scaled MFF (£) | |
|
Provider A |
1.0249 |
1,250 |
1,220 |
0.9622 |
1,299 |
|
Provider B |
1.1021 |
1,000 |
907 |
1.0346 |
967 |
|
Provider C |
1.3349 |
1,000 |
749 |
1.2532 |
798 |
|
Provider D |
0.9270 |
1,250 |
1,348 |
0.8703 |
1,436 |
|
|
|
4,500 |
4,225 |
|
4,500 |