
Executive summary
This briefing draws on official statistics published here.
- There was a total of 2,081,878 attendances at A&E departments across England in February. The average daily attendances increased to 74,353, this is 3.9% higher than January’s daily average and 0.1% lower than February 2024.
- 73.4% of patients were admitted, transferred or discharged within four hours, which is below the NHS constitutional standard of 95%. This is an improvement from 73.0% in January and 71.0% in February 2024.
- The average ambulance response time for category 2 calls was 31 minutes and 22 seconds. This has decreased from 35 minutes and 40 seconds in January 2025 and 36 minutes and 20 seconds in February 2024. This is above the 30 minute target for the year and the NHS constitutional standard of 18 minutes.
- There were 198,868 waits of more than 52 weeks for treatment at the end of January, compared to 321,394 at the end of January 24 (down 38.1%) and 200,375 at the end of December 24 (down 0.8%)
- Waits of more than 65 weeks for treatment was 14,975 at the end of January, reduced compared to 92,213 at the end of January 2024 (down 83.8%) and 15,568 in December 2024 (down 3.8%).
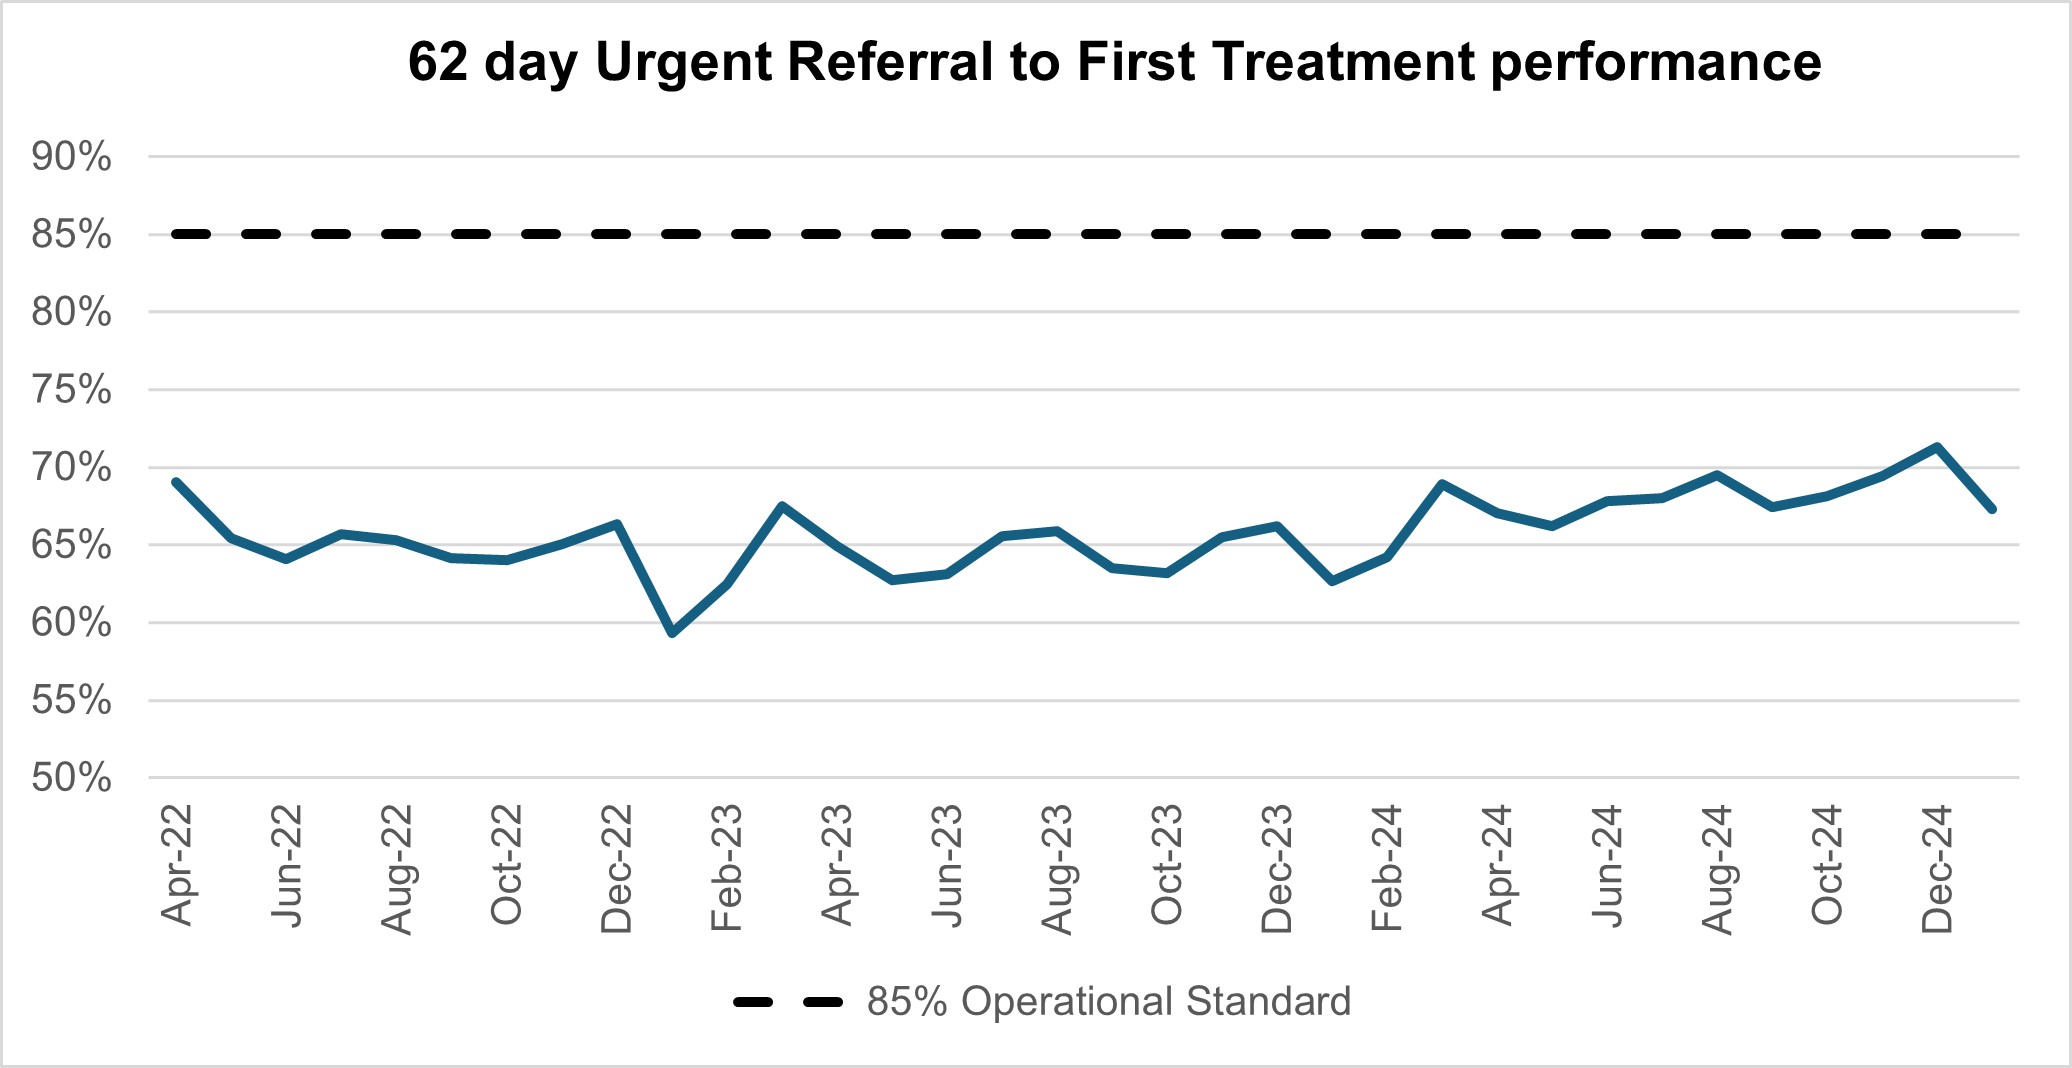
- Performance against the 62 day Urgent Referral to First Treatment Standard to begin first definitive treatment of an urgent suspected cancer referral, breast symptomatic referral, urgent screening referral or a consultant upgrade was 67.3% in January 2025. This was 4.0 percentage points lower than December 2024, although a seasonal reduction in performance is commonly observed each January. January 2025 performance was 4.6% higher than at the same point last year, but still below where we want to see it.
- The NHS is working to reduce the number of people with a learning disability and autistic people in inpatient mental health settings. There are currently 2,065 people with a learning disability and autistic people in a mental health inpatient setting, compared to 2,910 in March 2015. This represents a decrease of 29% against a commitment to reduce inpatient numbers by 50% by March 2024.
Urgent and emergency care
Ongoing demand for emergency care placed pressure on urgent and emergency services in February.
There was a total of 2,081,878 attendances at A&E departments across England in February. The average daily attendances increased to 74,353, this is 3.9% higher than January’s daily average and 0.1% lower than February 2024.
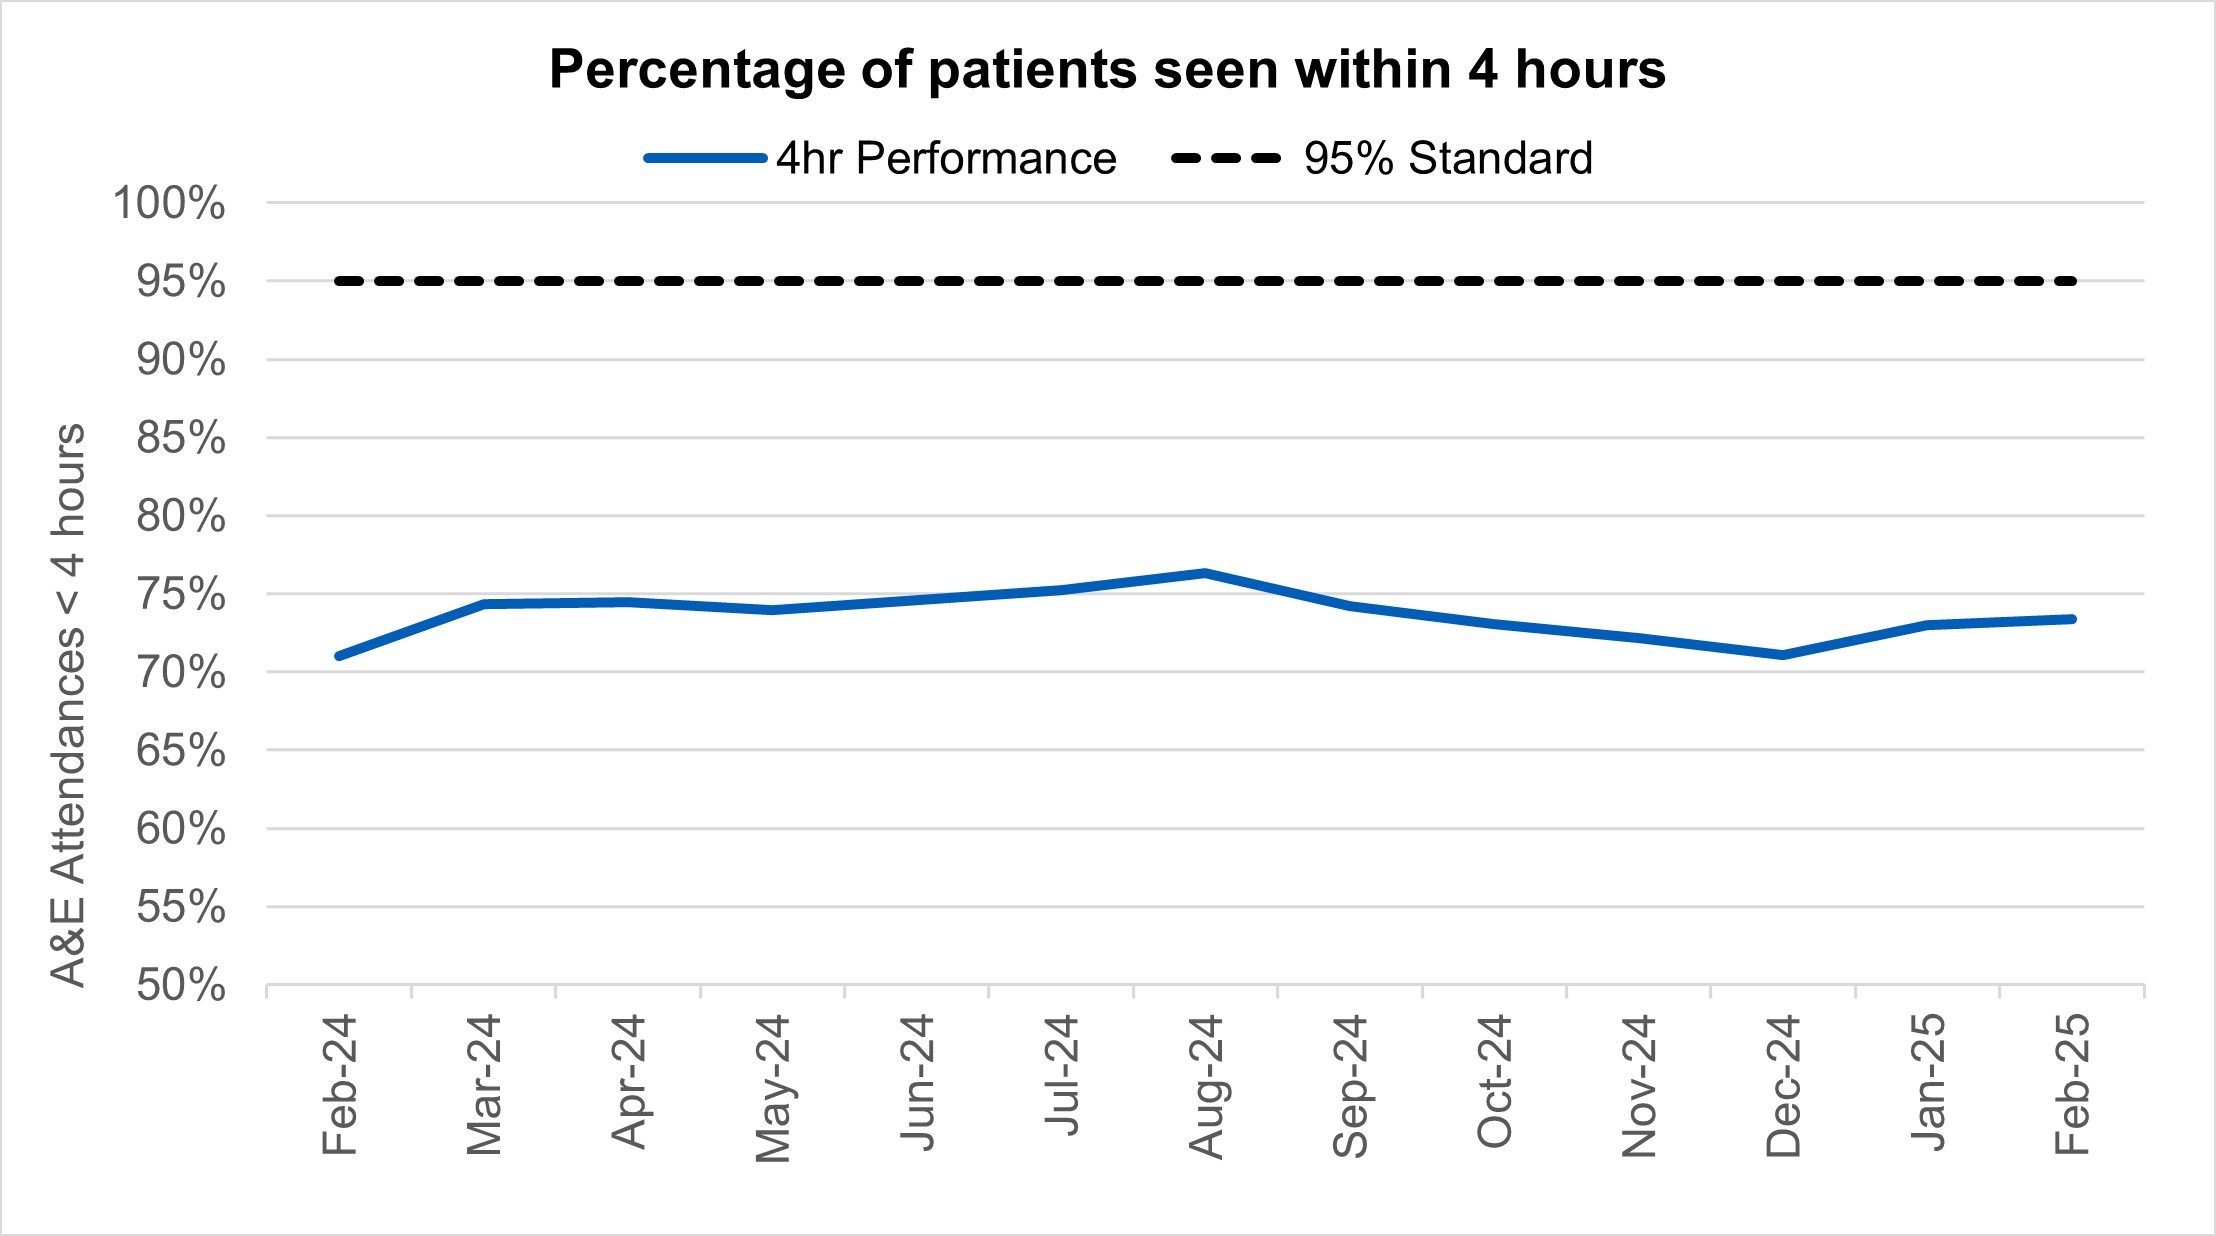
73.4% of patients were admitted, transferred or discharged within four hours, which is below the NHS constitutional standard of 95%. This is an improvement from 73.0% in January and 71.0% in February 2024.
The provisional figures published for January indicate that 11.3% of patients attending a type 1 A&E department spent 12 hours from arrival in A&E compared with 12.7% last month.
Percentage of patients seen within 4 hours
Ambulance services answered 734,310 calls to 999, or 26,225 per day, a decrease of 0.4% compared to January 2025 and 2% less than February 2024. There were 345,275 incidents where a patient was conveyed to A&E or 12,331 per day, 0.5% per day more than in January 2025 and a 0.4% per day more than February 2024.
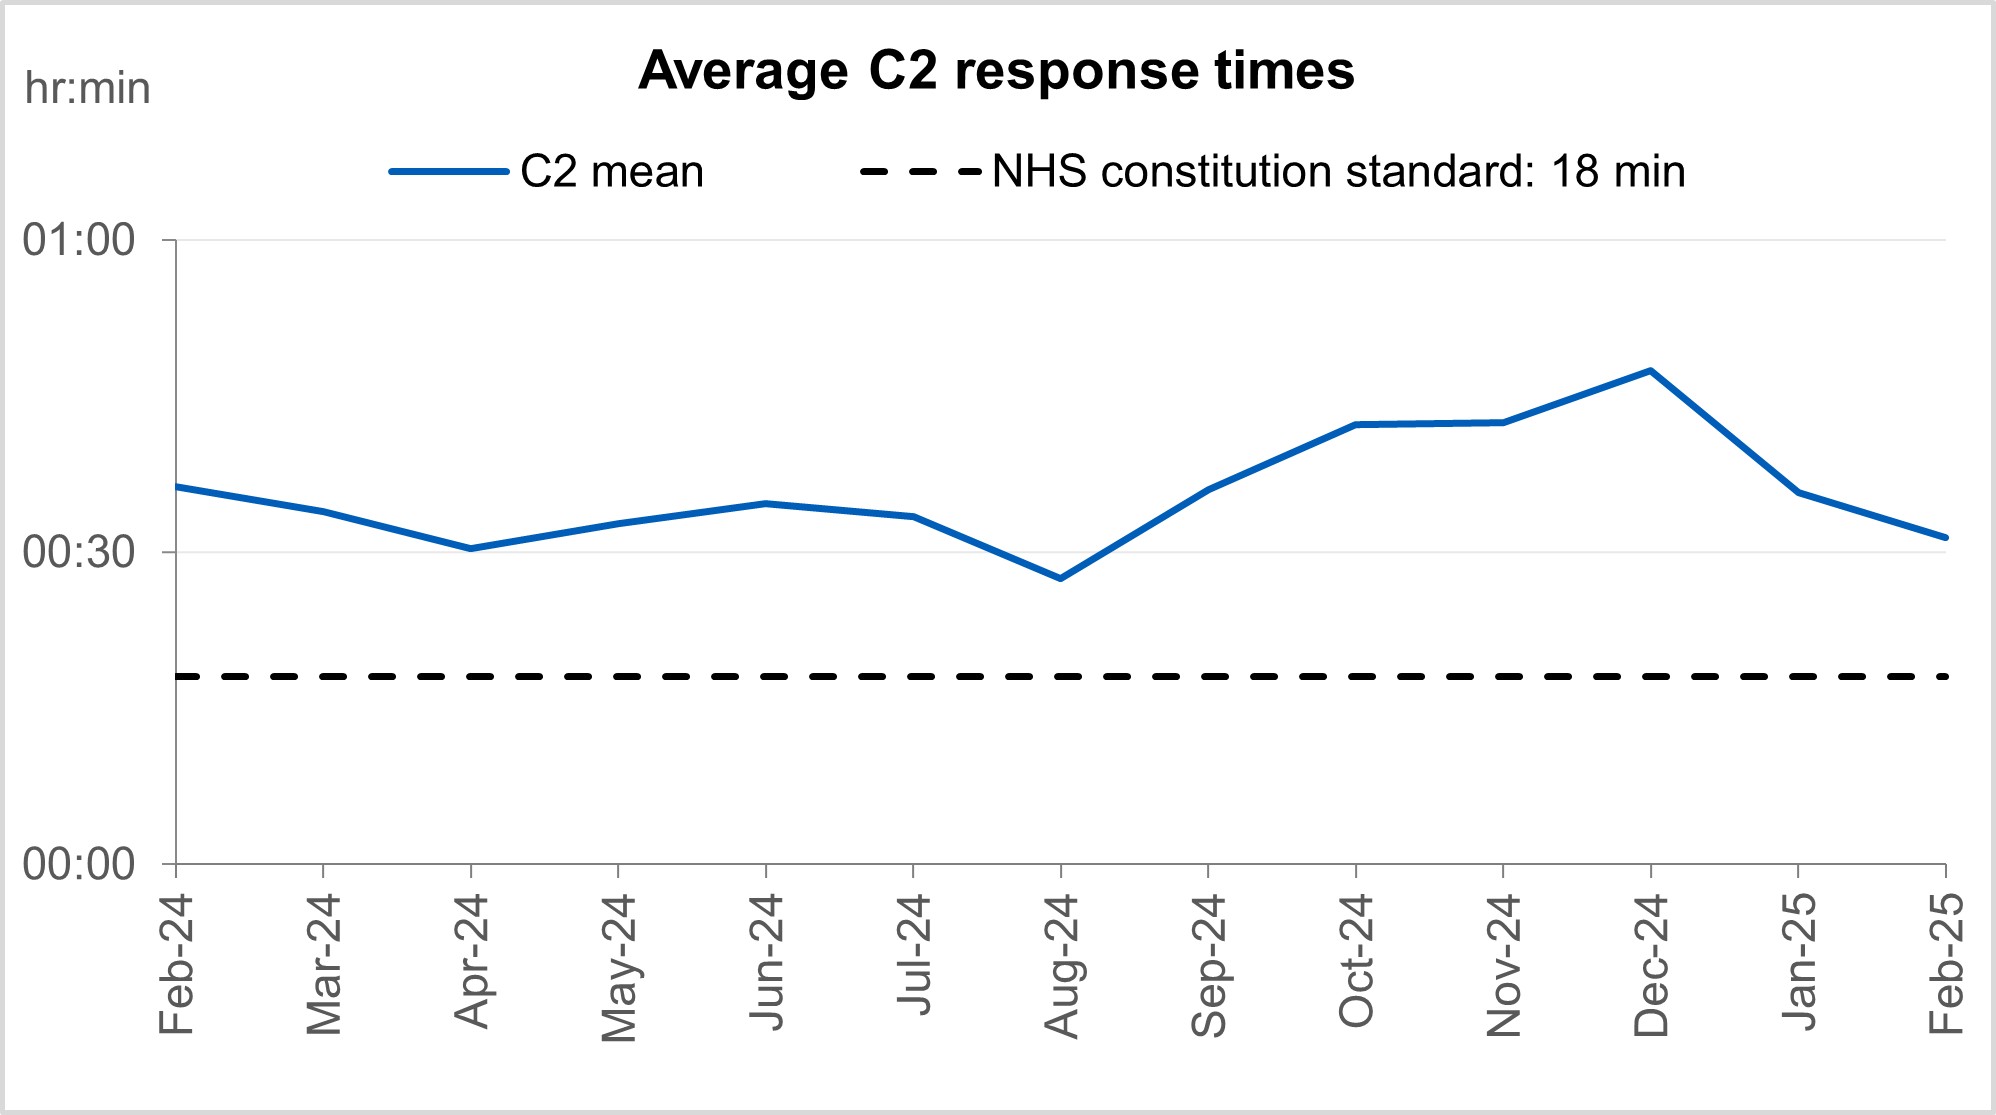
The average ambulance response time for category 2 calls was 31 minutes and 22 seconds. This has decreased from 35 minutes and 40 seconds in January 2025 and 36 minutes and 20 seconds in February 2024. This is above the 30 minute target for the year and the NHS constitutional standard of 18 minutes.
‘Hear and Treat’ clinical teams have been embedded in all ambulance control centres to increase the number of patients who can be appropriately treated over the phone. 999 calls are responded to by an ambulance service over the phone instead of sending an ambulance, with a clinician giving treatment and advice remotely. Since March 2024, 15% of all ambulance calls across England were handled by ‘Hear and Treat’, meaning they did not require an ambulance to be dispatched.
As well as improving outcomes for patients, ‘Hear and Treat’ also reduces pressure on Emergency Departments and improves ambulance response times.
Average C2 response times
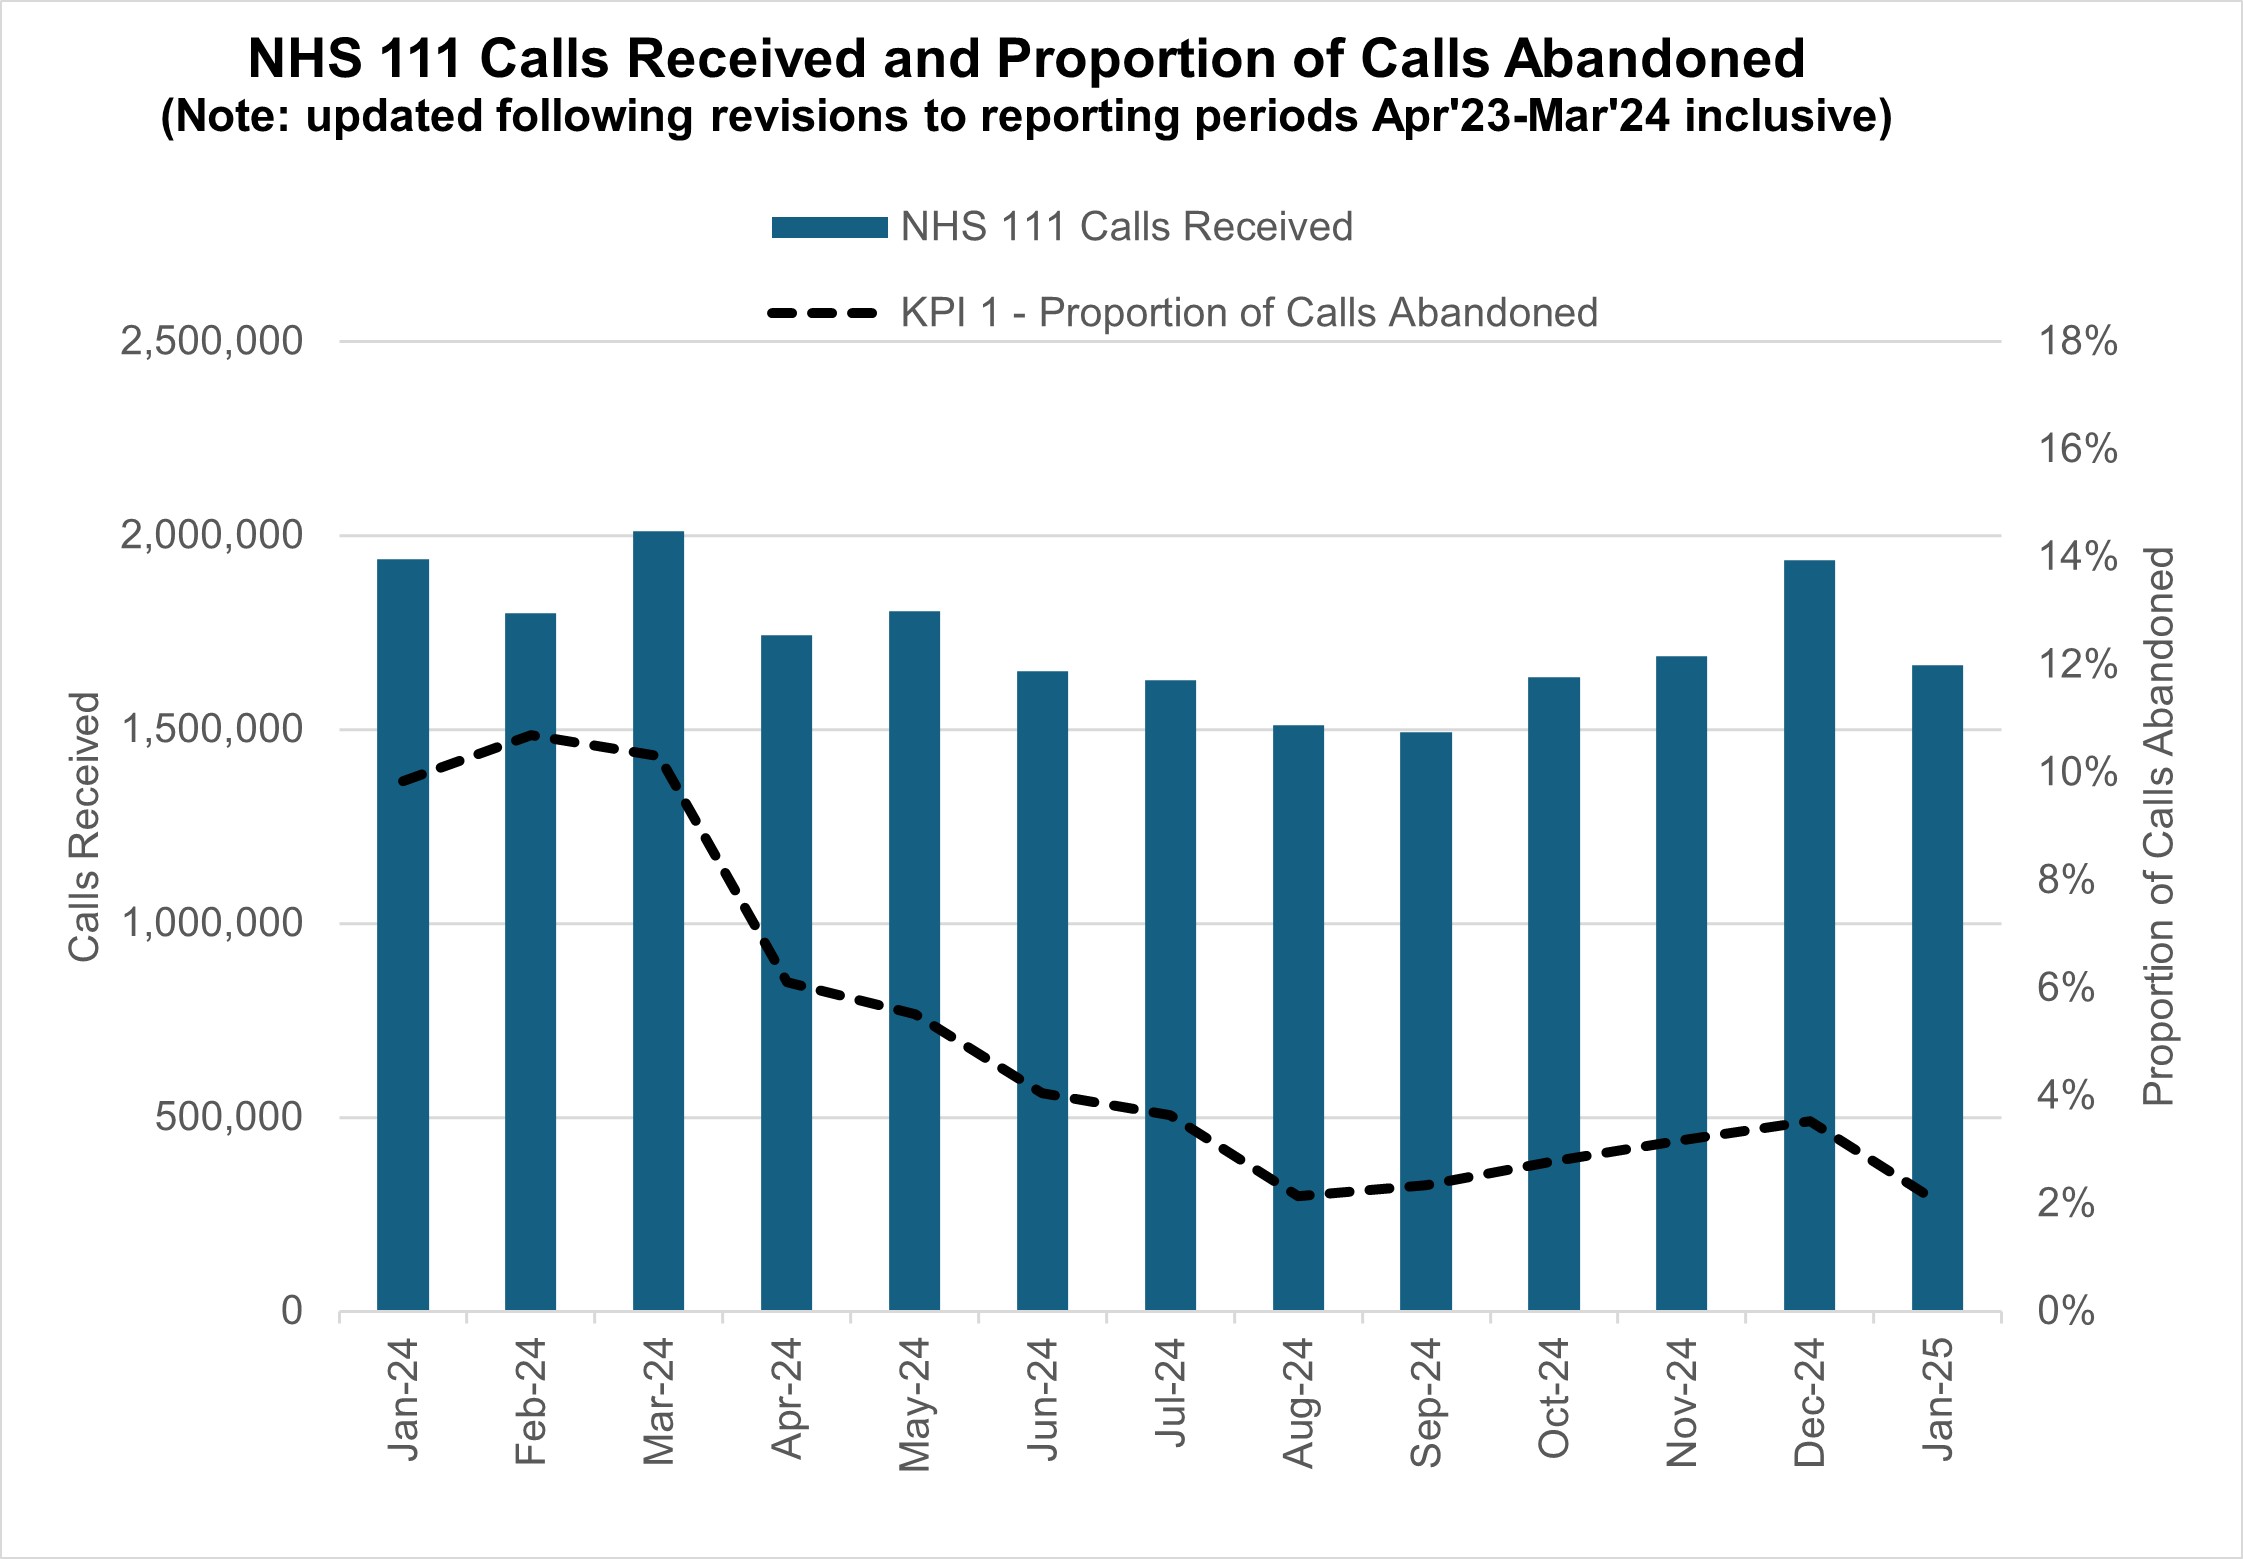
NHS 111 received 1.67 million calls (c. 53.7 thousand per day) in January 2025. Demand was 14.0% down year on year and 14.0% below volumes received in December 2024.
The proportion of calls abandoned decreased 1.5% percentage points from the previous month (now at 2.0%) and the average speed to answer decreased by 32 seconds to 38 seconds.
NHS 111 calls received and proportion of call abandoned
Elective recovery
Elective care covers a broad range of planned, non-emergency services – from tests and scans to outpatient appointments, surgery and cancer treatment.
As of the end of January, there were 7.43 million waits for treatment which equates to an estimated 6.25 million people waiting for care. Of the 7.4m pathways on the waiting list in January 25, 1.2 million had a decision to be admitted for treatment.
While NHS staff have worked extremely hard in the aftermath of the pandemic to tackle the elective backlog – reducing long waits and treating the most clinically urgent cases – the NHS is a long way from meeting the required constitutional standard. The Elective Reform Plan was launched in January 2025, which sets out our intention to return to delivery of the constitutional standard: 92% of patients on the waiting list should have been waiting no longer than 18 weeks from referral to treatment.
To meet the 18-week standard and reform elective care by March 2029, we are focusing on empowering patients by giving them more choice and control, reforming delivery by working more productively, delivering care in the right place and aligning funding, performance oversight and delivery standards.
The ambition for 18 weeks performance is to reach the constitutional standard of 92% by March 2029 and 65% by March 2026, the current position is 58.9%.
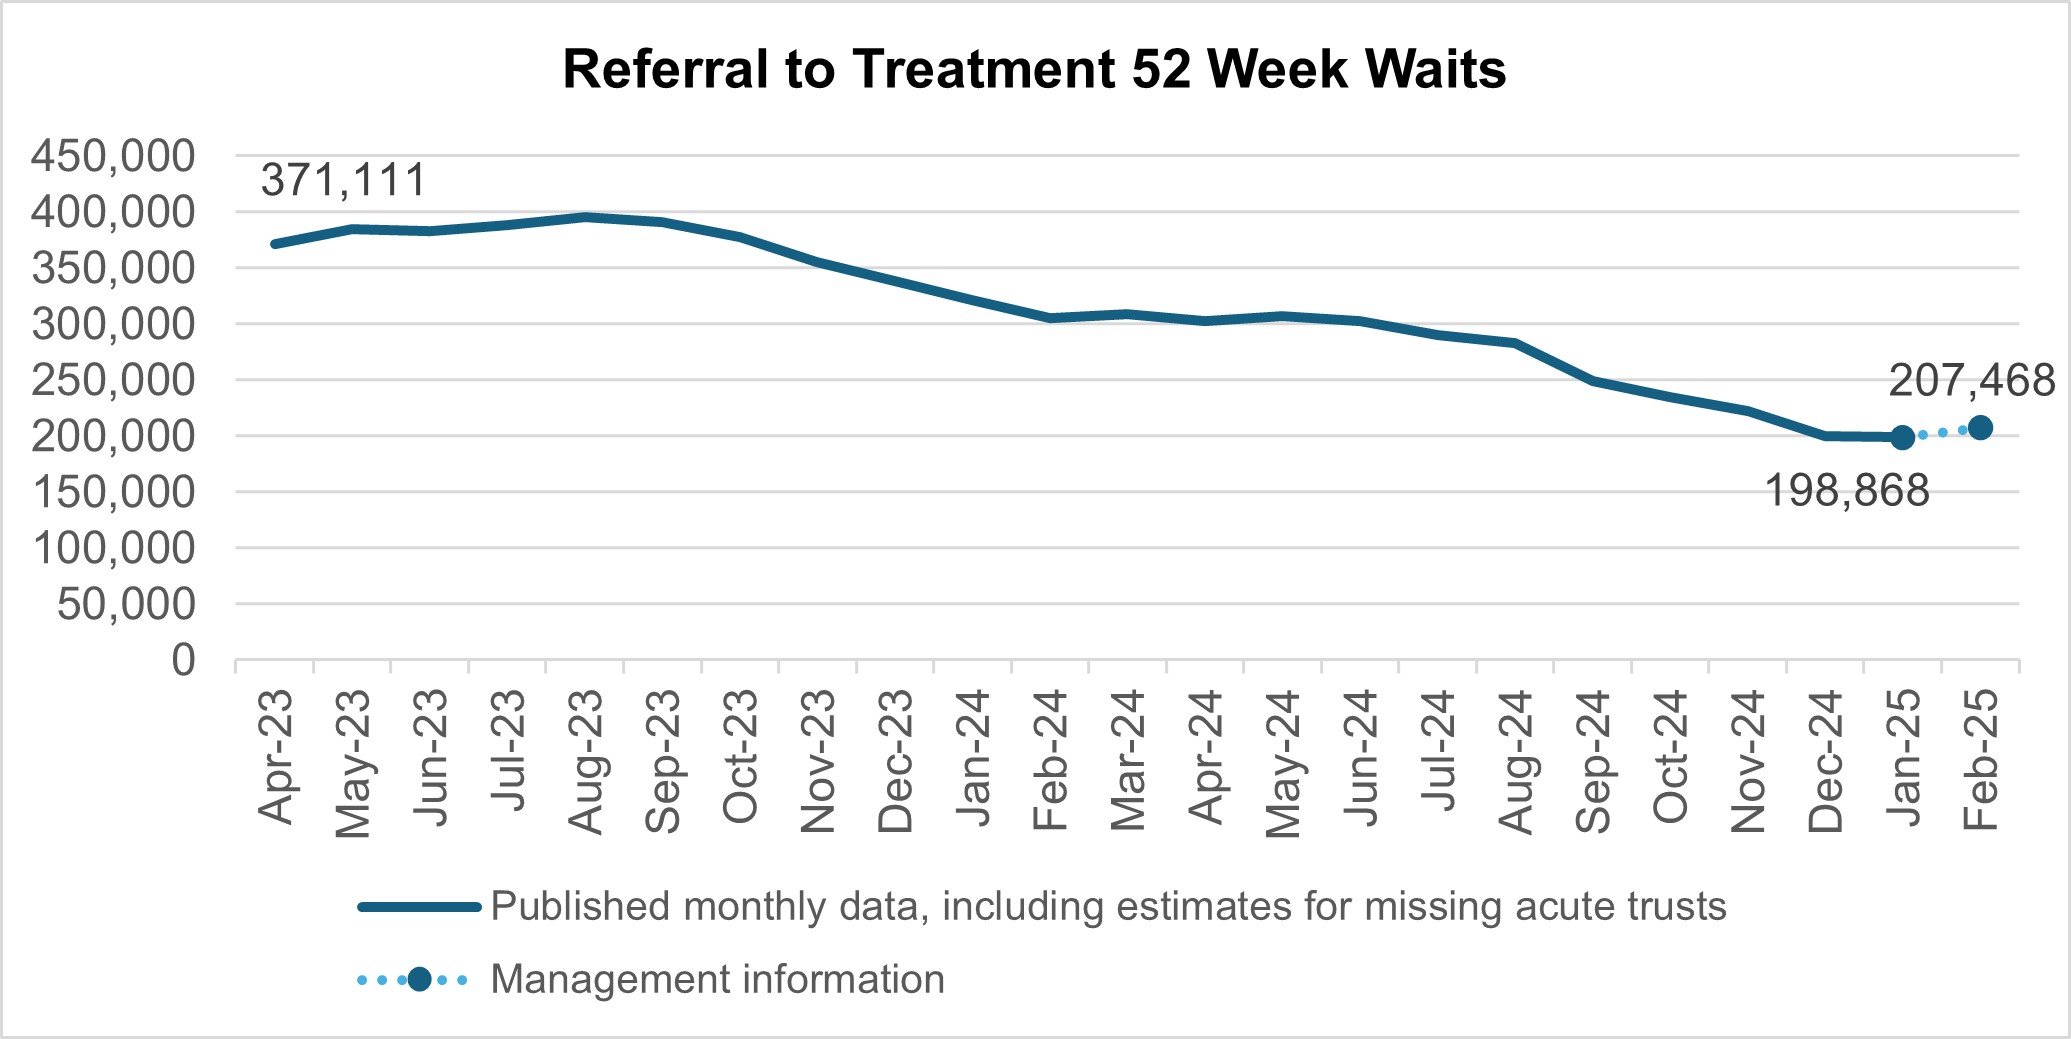
There were 198,868 waits of more than 52 weeks for treatment at the end of January, compared to 321,394 at the end of January 24 (down 38.1%) and 200,375 at the end of December 24 (down 0.8%). Additional management data* suggests there were 207,468 waits of more than 52 weeks as of the end of February.
*Management information for the latest month is taken from the Waiting List Minimum Dataset (WLMDS). Figures include data up to week ending 23 Feb 25. WLMDS data is subject to less validation than the published monthly figures. All acute trusts submitted data for week ending 23 Feb 25.
Referral to treatment 52 week waits
As we shift the focus to the 18 week standard, we will continue to ensure that the longest waits are tackled and the number of patients waiting unacceptably long times continues to reduce. In the 2025/26 priorities and operational planning guidance we have made a commitment to reduce the proportion of people waiting over 52 weeks for treatment to less than 1% of the total waiting list by March 2026.
Waits of more than 65 weeks for treatment was 14,975 at the end of January, reduced compared to 92,213 at the end of January 2024 (down 83.8%) and 15,568 in December 2024 (down 3.8%). Additional management data suggests there were 17,029 waits of more than 65 weeks for treatment as of the end of February.
There has been a reduction in the longest waits for care, 2,005 patients were waiting more than 78 weeks for treatment at the end of January, compared to 14,013 at the end of January 2024 (down 85.7%) and 2,059 in December 2024 (down 2.6%). Additional management data suggests there were 1,720 waits of more than 78 weeks for treatment as of the end of February.
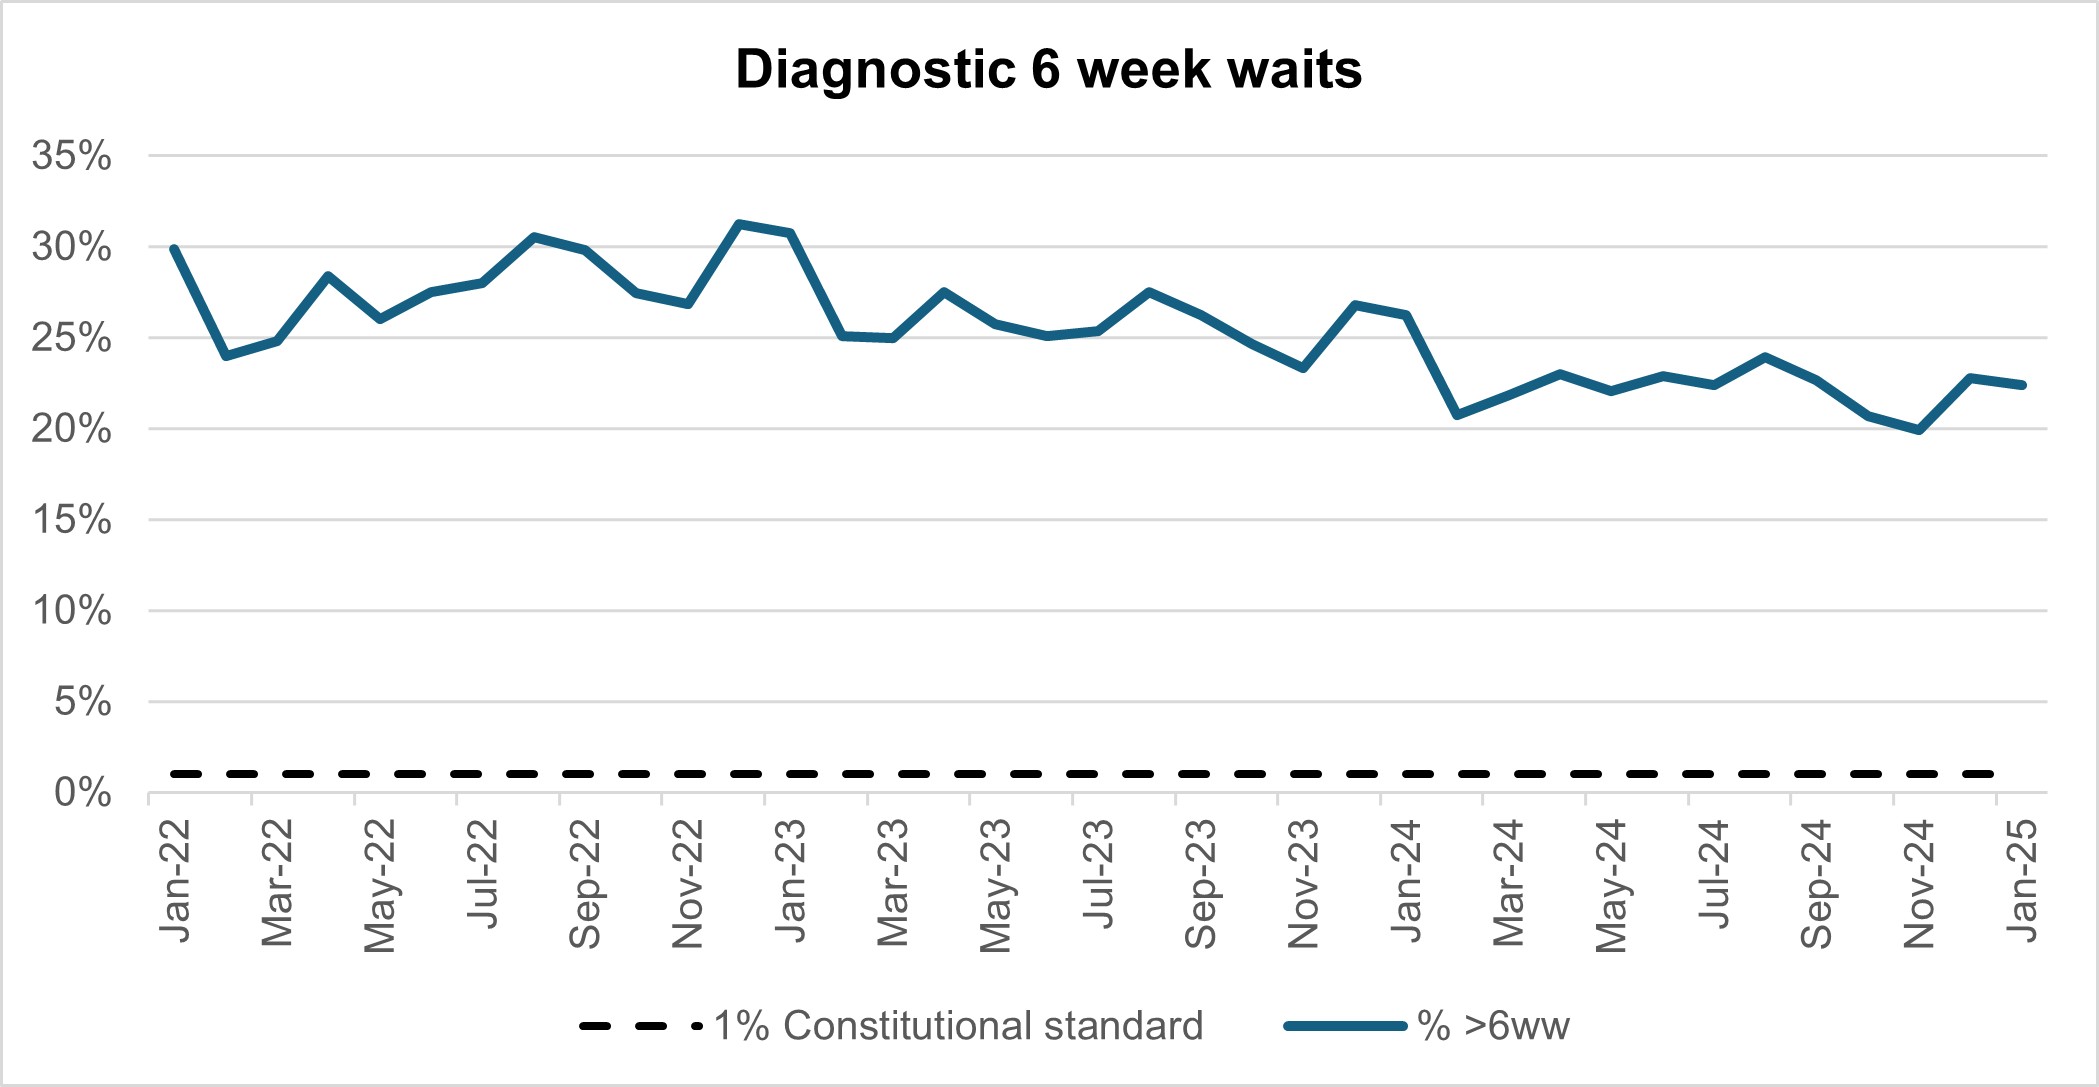
More than 2.5 million diagnostic tests were delivered in January, 5% higher than the same month last year (2.4 million in January 2024). At the end of January, on the diagnostic waiting list there were 1.62 million waits, of which 364,000 had waited 6 weeks or more. The percentage of 6 week waits was 22.4%, down from 26.3% in January 2024. Progress is being made towards the interim recovery target of not more than 5% of the waiting list over 6 weeks and an increased percentage of diagnostic activity is supplied by Community Diagnostic Centres (CDCs).
Diagnostic 6 week waits
By providing a wider range of and capacity for tests and more consulting rooms, CDCs can improve elective pathways for both urgent cancer pathways and routine diagnostic pathways. There are 1.62 million waits for the 15 major diagnostic tests and demand is rising. With 170 community diagnostic centres due to be up and running by the end of March 2025, these centres can take on more of the growing diagnostic demand within elective care.
Cancer
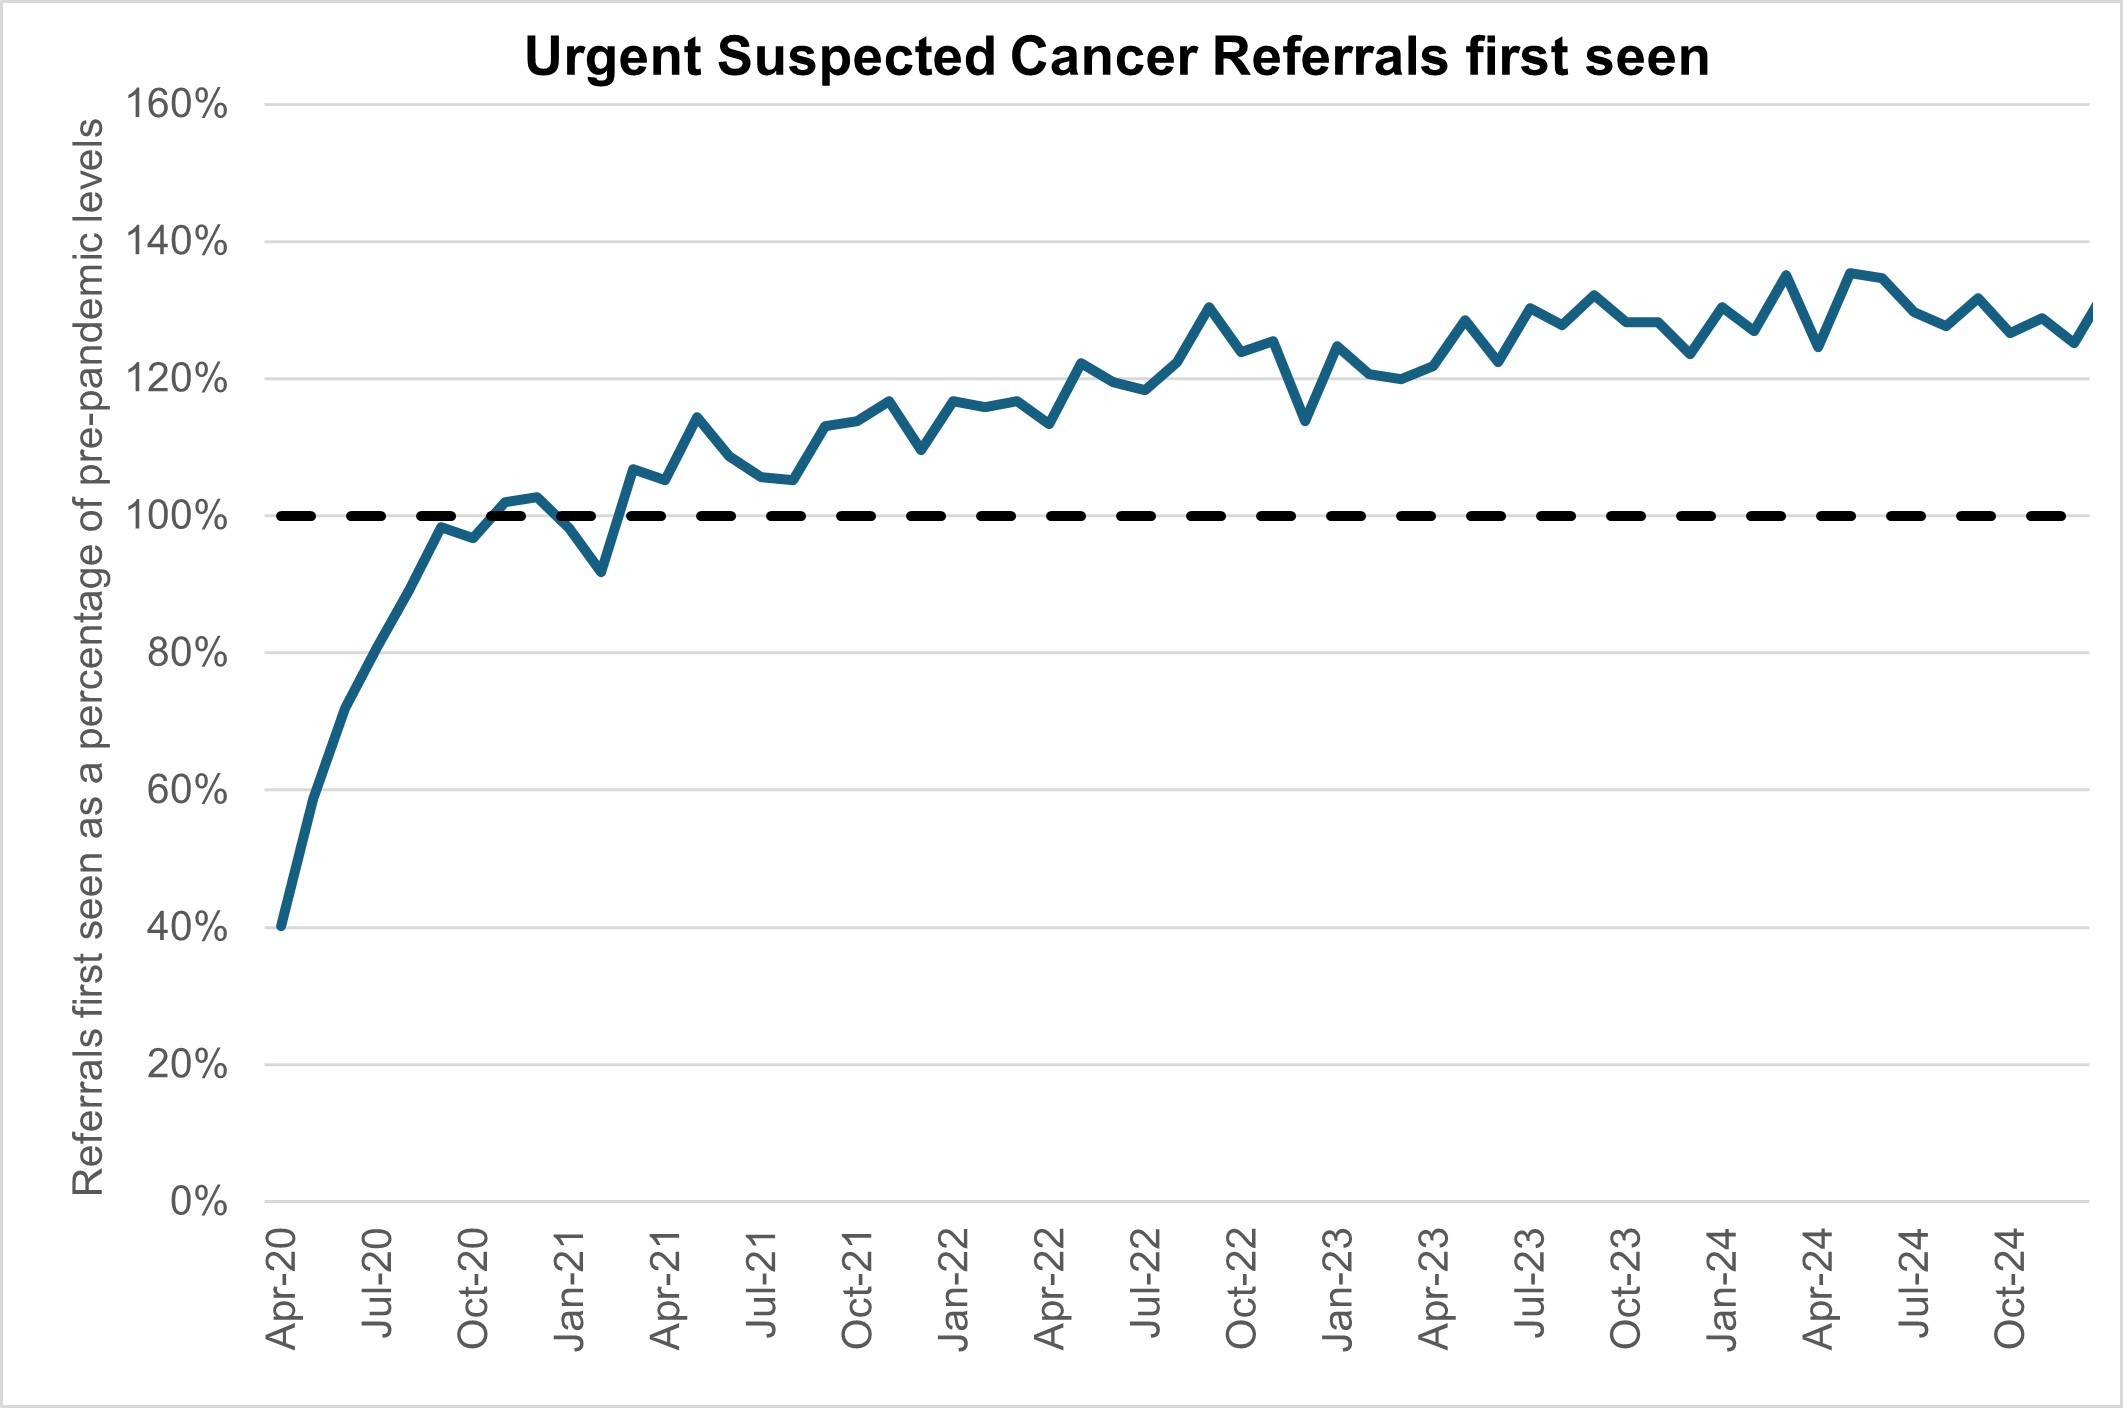
Levels of Urgent Suspected Cancer referrals have remained high, with 11,598 referrals per working day in January 2025. This is 33% more referrals than the NHS was seeing before the pandemic – the equivalent of ~2,900 more referrals per working day.
Treatment activity was also at a record high level with over 1,400 patients starting cancer treatment per working day, 13% above pre-pandemic levels.
Urgent suspected cancer referrals first seen
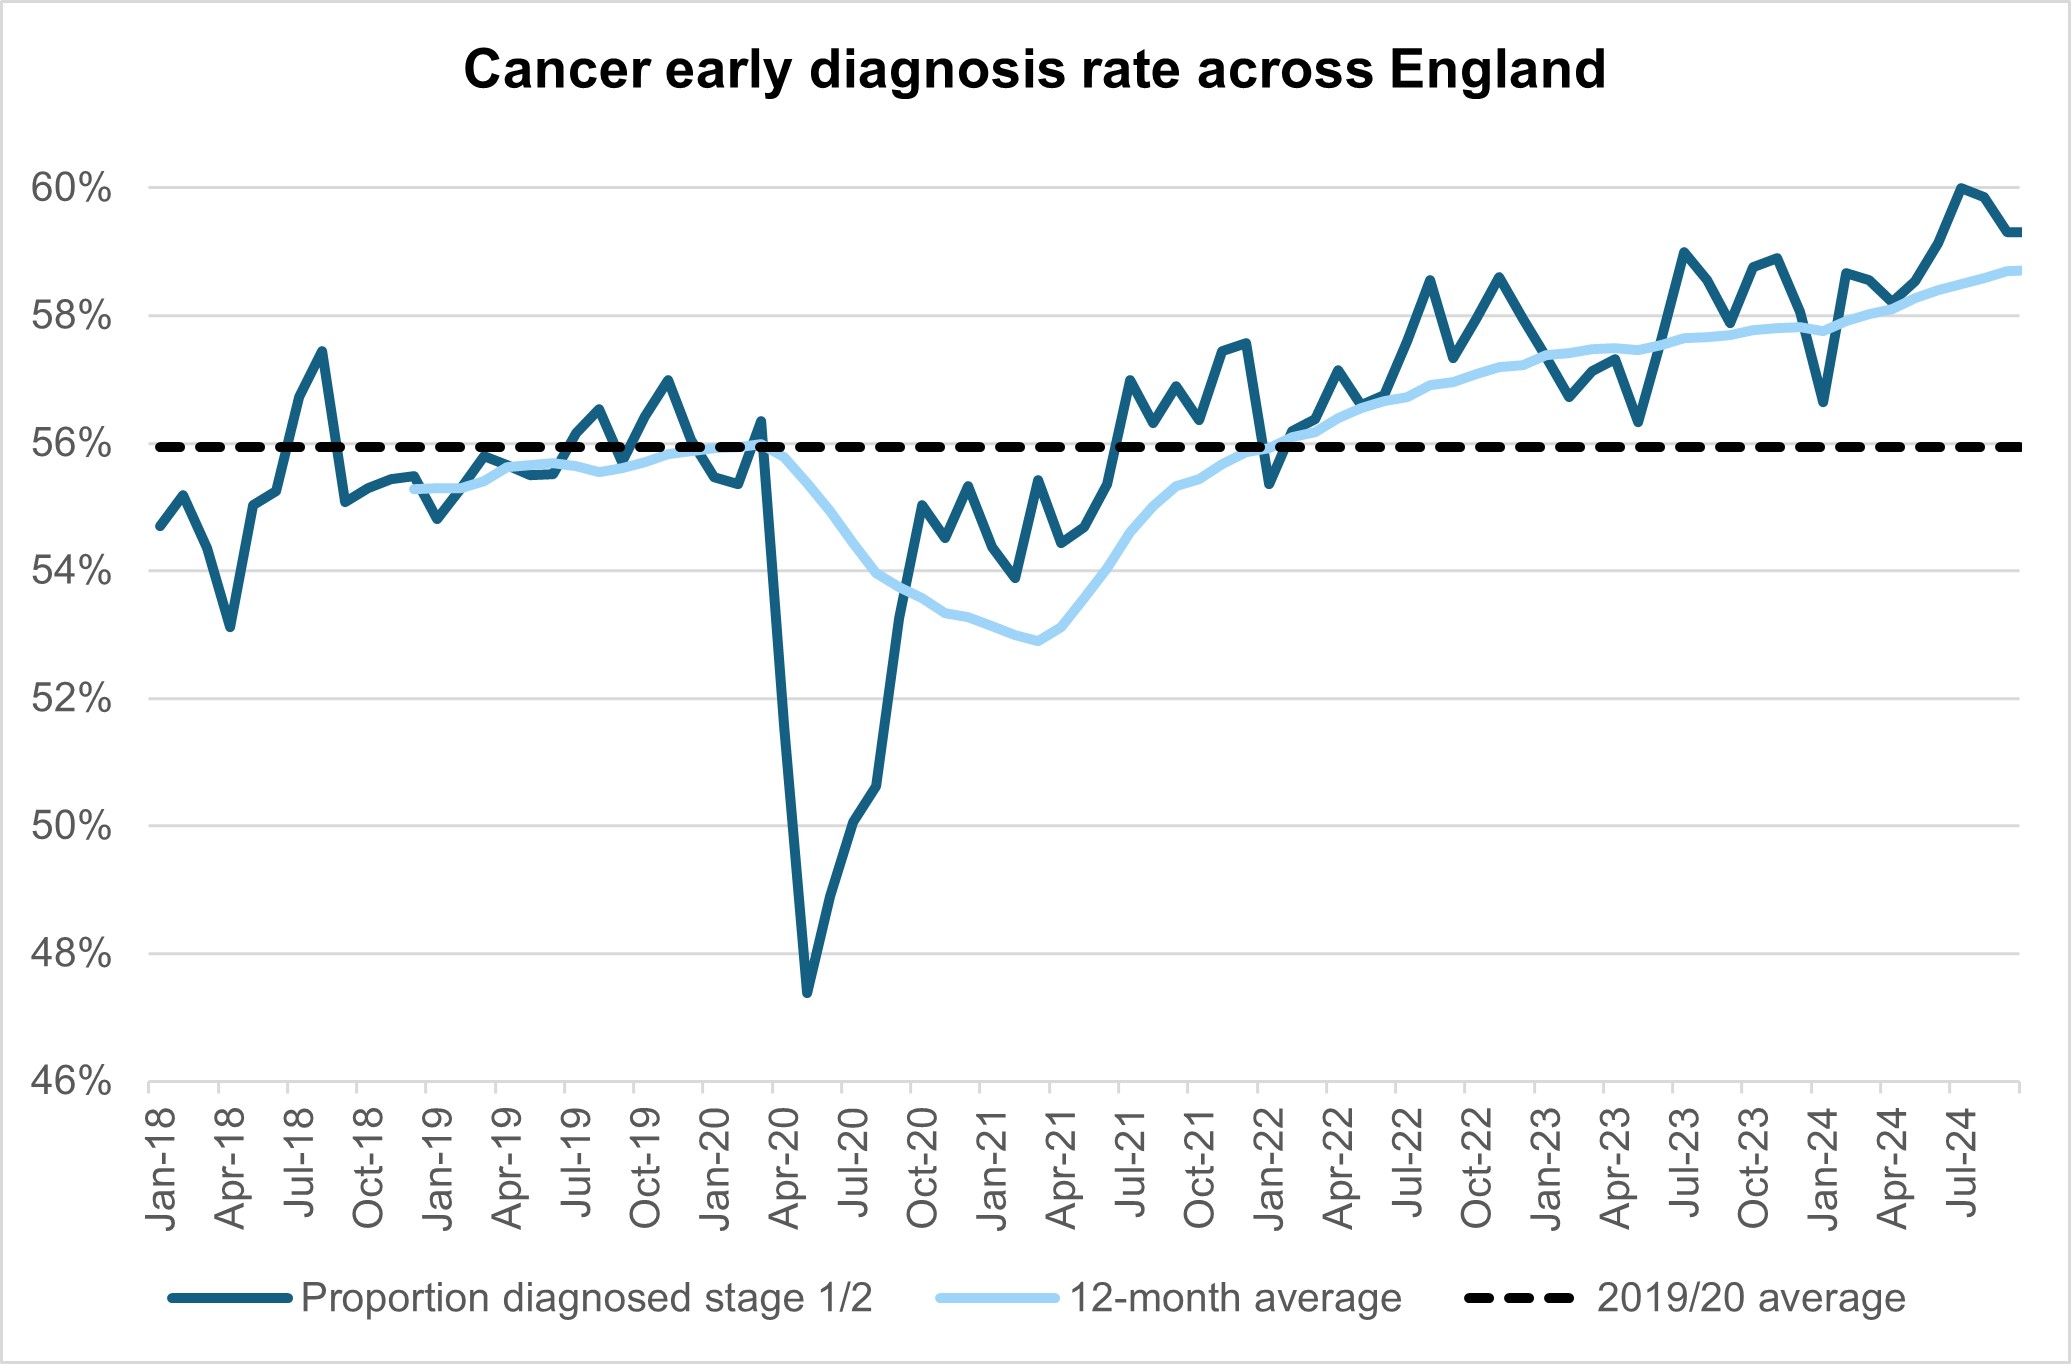
The increase in referrals has also contributed to increases in early diagnosis, which are now about 2 percentage points higher than before the pandemic, cancer survival also continues to improve.
Urgent cancer diagnosis rates across England
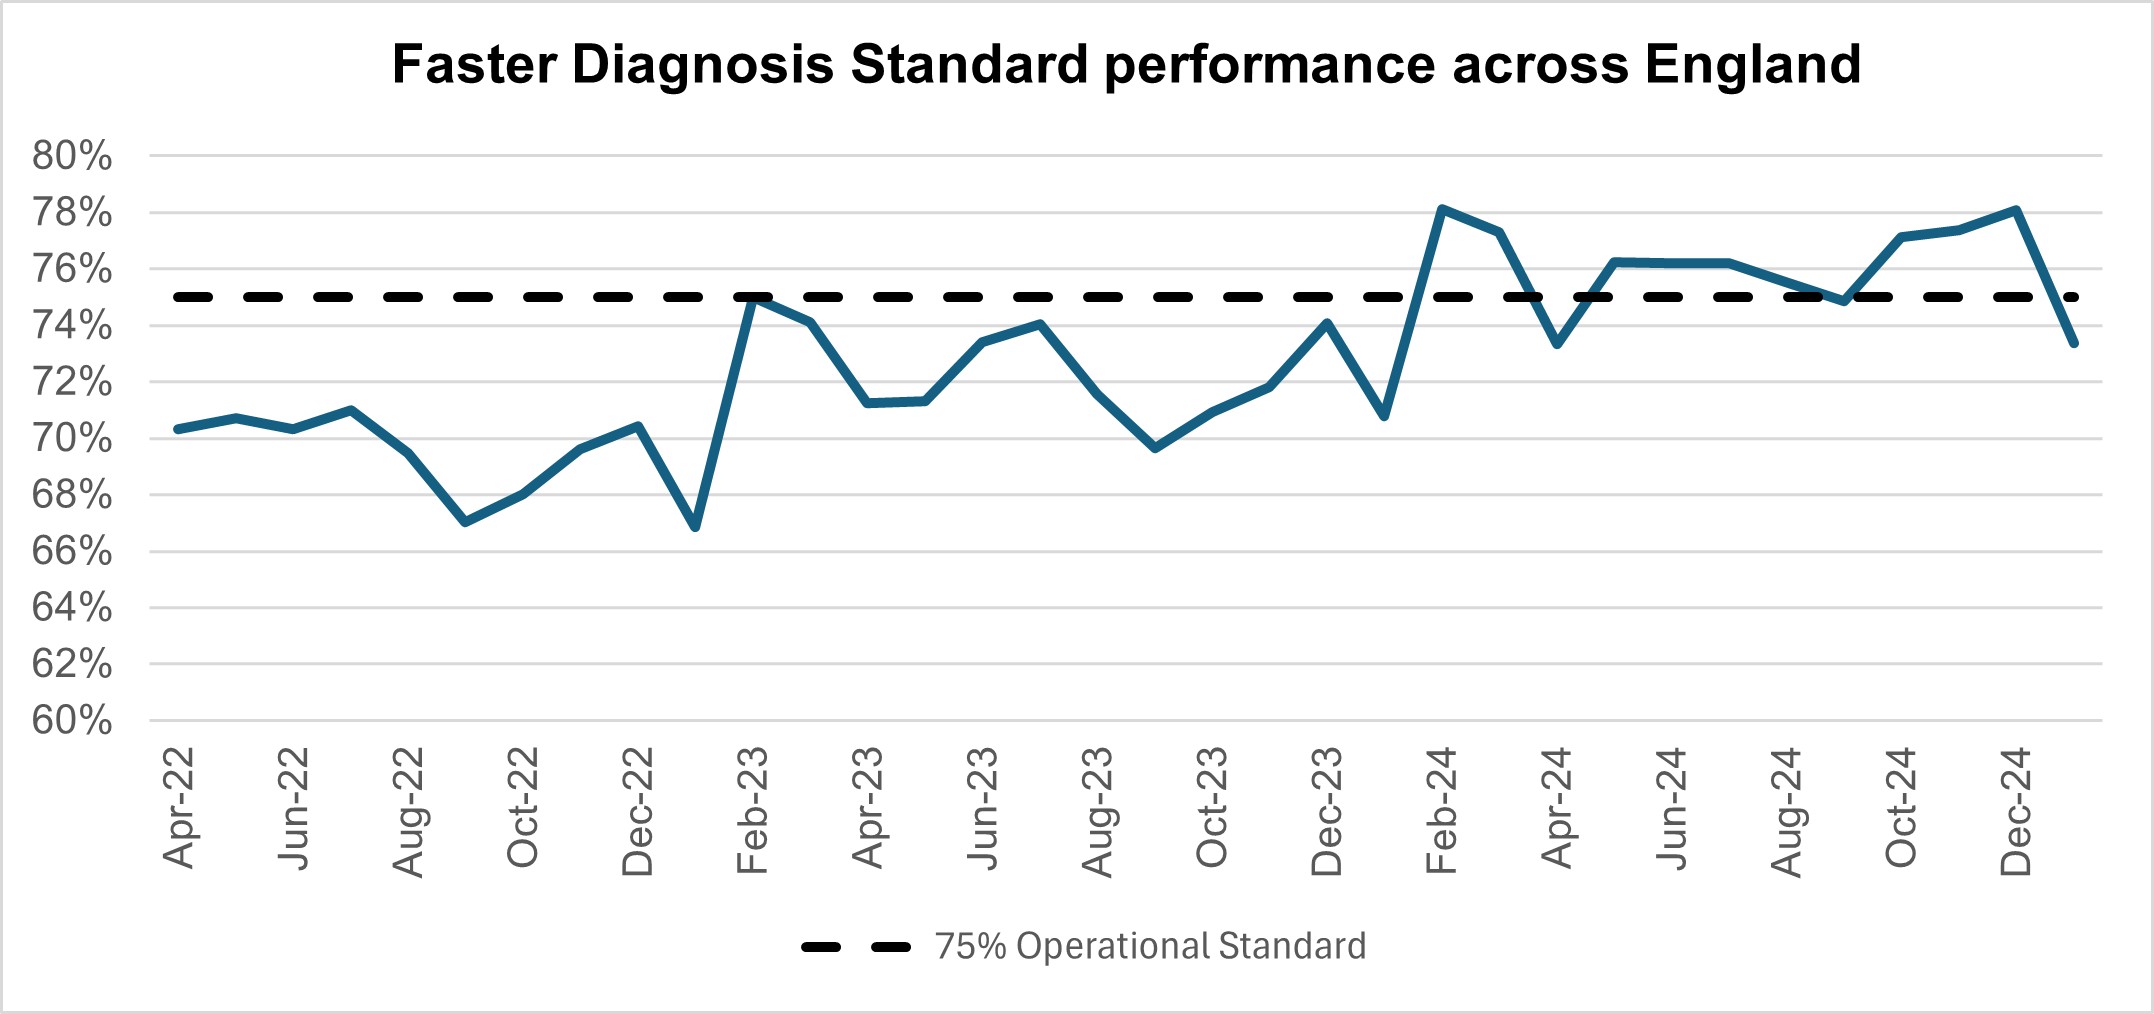
The NHS is working hard to keep up with this increase in demand. It has been accelerating the installation of new diagnostic capacity, much of it in CDCs. Performance against the 28 day faster diagnosis standard to reduce the time between referral and diagnosis of cancer was 73.4% in January 2025. Although this is below the NHS constitutional standard of 75% and represents a 4.7 percentage point reduction from December 2024, it conforms to seasonal reductions in performance that are commonly observed each January. Performance for January 2025 represents a 2.6 percentage point improvement compared to the same point last year.
Faster diagnosis standard performance across England
Performance against the 62 day Urgent Referral to First Treatment Standard to begin first definitive treatment of an urgent suspected cancer referral, breast symptomatic referral, urgent screening referral or a consultant upgrade was 67.3% in January 2025. This was 4.0 percentage points lower than December 2024, although a seasonal reduction in performance is commonly observed each January. January 2025 performance was 4.6% higher than at the same point last year, but still below where we want to see it. The NHS has set the ambition to improve this to 70% by March 2025, as a first step in recovering performance to the NHS constitutional standard of 85%.
62 day urgent referral to first treatment performance
Learning disability and autism
The NHS has made progress in reducing the number of people with a learning disability and autistic people in inpatient mental health settings. There are currently 2,065 people with a learning disability and autistic people in a mental health inpatient setting, compared to 2,910 in March 2015.* This represents a decrease of 29% against a commitment to reduce inpatient numbers by 50% by March 2024.
*As Assuring Transformation is a live data collection system, late reporting will always tend to increase the inpatient count when data are refreshed in subsequent months. The January inpatient count is therefore expected to rise and should be treated as provisional.
Total people who are autistic and/or have a learning disability in mental health hospital
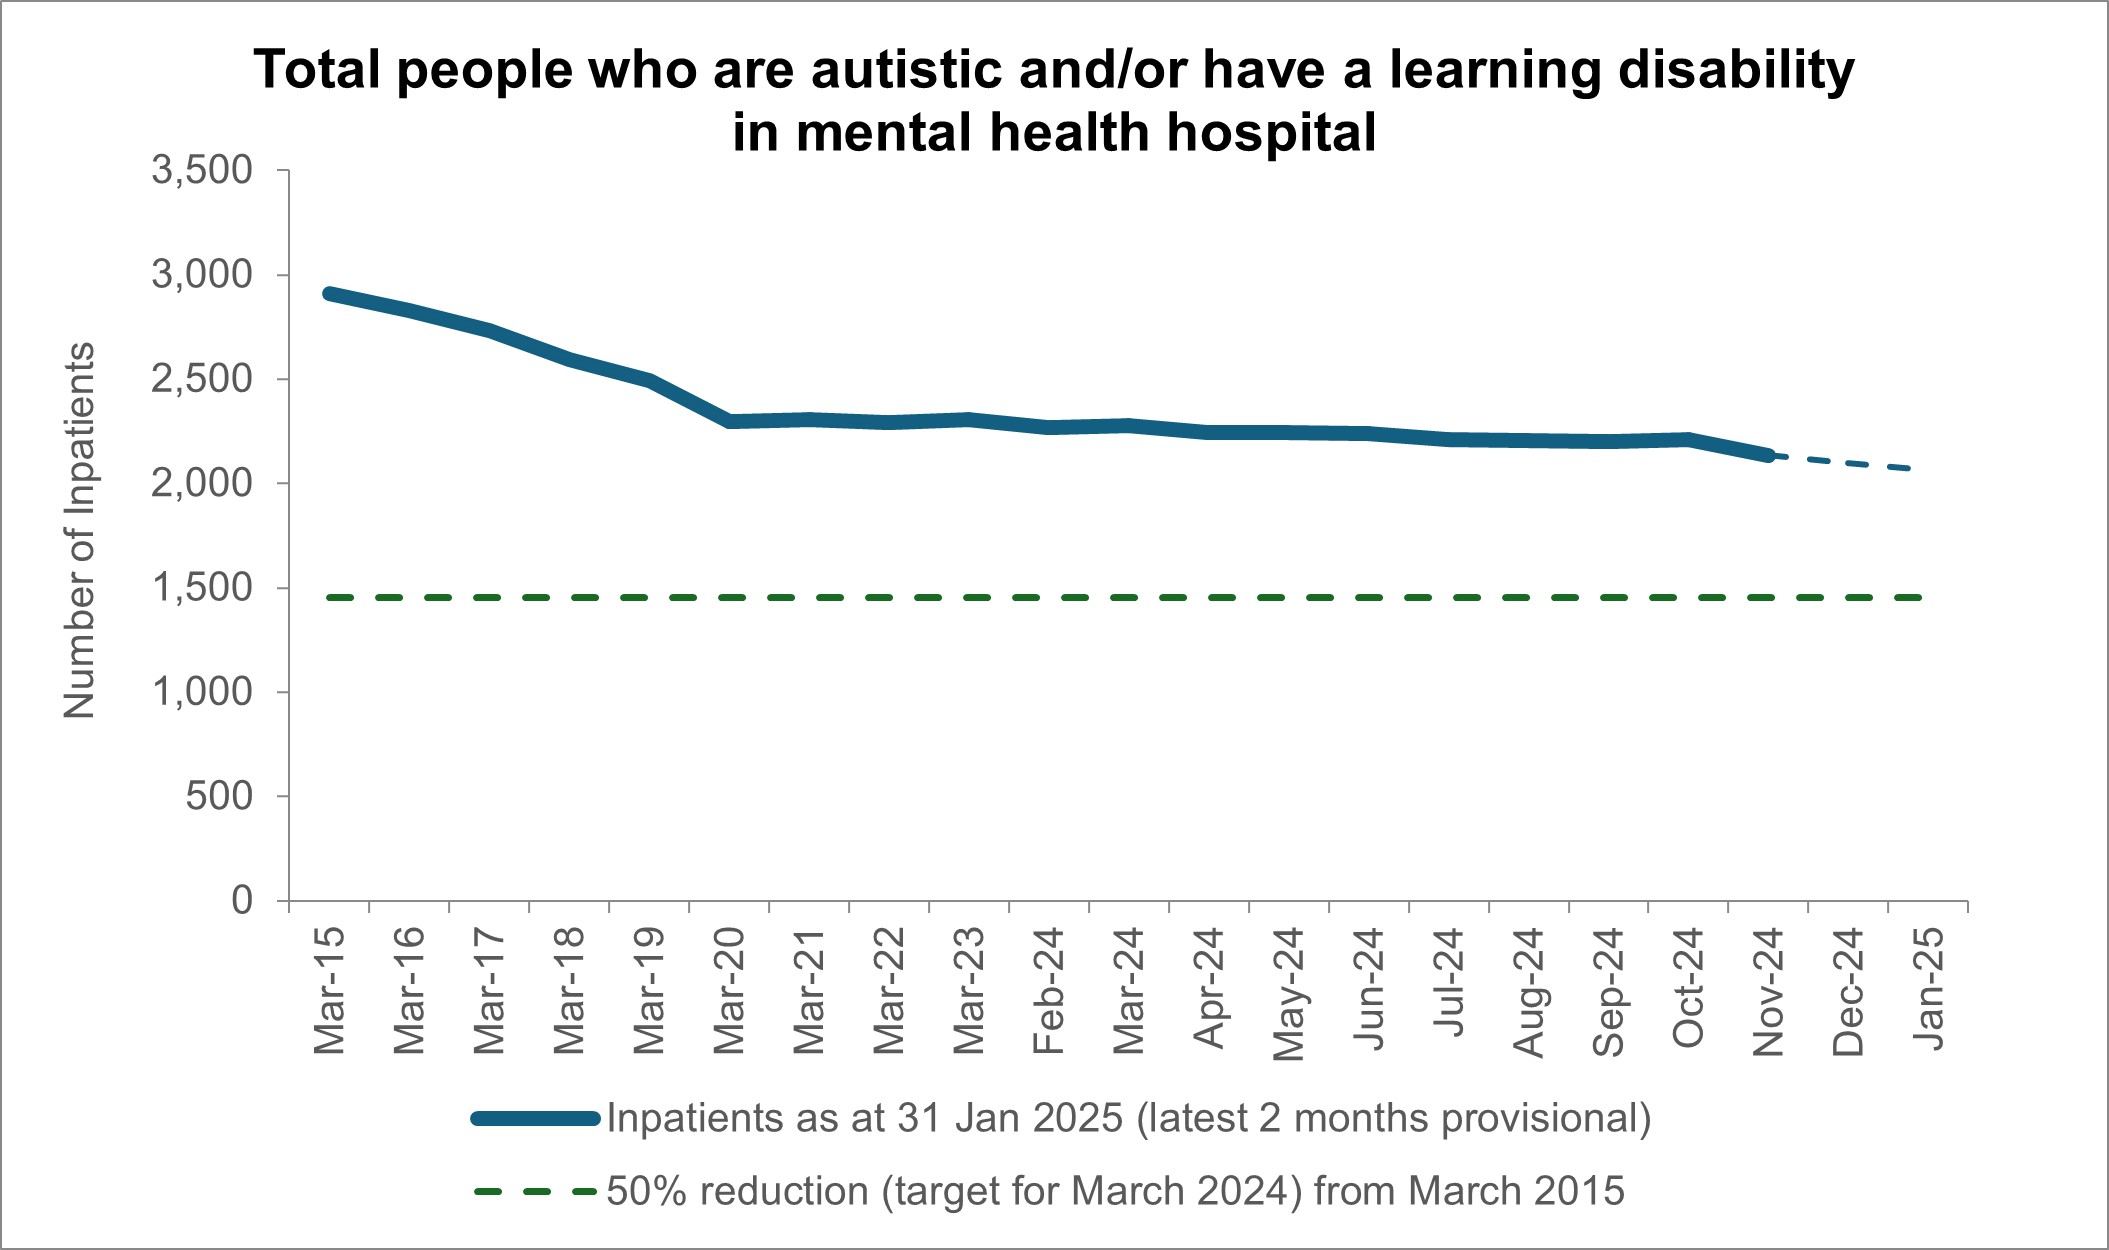
Source: Assuring Transformation, January 2025
There is a significant difference in the trend in the number of inpatients with a learning disability to the number of autistic inpatients. For people who have a learning disability and who do not have an autism diagnosis, there has been a 57% reduction in the number of people in hospital since March 2017.
For people who have a learning disability and also have an autism diagnosis, there has been a 40% reduction in the number of people in hospital since March 2017.
The number of people with an autism diagnosis in hospital inpatient settings has increased by 81% over the same period.
*In the early years of the programme there was under reporting of autistic people and those aged under 18. Trends by patient group are therefore shown from March 2017 when reporting was more stable.
Trends for different groups of people in hospital since March 2017
Source: Assuring Transformation, January 2025
Some of the factors that may impact upon the number of autistic people in a mental health inpatient setting include:
- The increasing number of people recorded in GP records as having an autism diagnosis. In December 2024, 1.46% of people were recorded as autistic, an increase of 0.19% from 1.27% at December 2023.
- People who are autistic have a higher prevalence of mental ill health compared to the general population. The 2024 GP Patient Survey found that 48% of autistic people reported having a mental health condition compared to 14% of the general population.
2025/26 priorities and operational planning guidance for the NHS published in January 2025 asks Integrated Care Boards (ICBs) to move forward on the commitment to reduce reliance on mental health inpatient care for autistic people and people with a learning disability. ICBs are expected to set out plans for how they will achieve a minimum 10% reduction in the number of adults with a learning disability and autistic adults during 2025/26.
The delivery of the minimum 10% reduction by March 2026 will help the NHS move towards there being no more than 30 adults with a learning disability and autistic adults in a mental health hospital per million adult population. The planning guidance also asks ICBs to ensure that no more than 12-15 under 18s who are autistic and/or have a learning disability are in a mental health hospital per million under 18 population.