
Executive summary
This briefing draws on official statistics published here.
- Urgent and emergency (UEC) care services continued to face higher demand in April. The service also dealt with the Easter bank holiday – a time when the whole system typically experiences increased pressure. There was a total of 2,295,820 attendances at A&E departments across England in April. The average daily attendances increased to 76,527 this is 0.7% lower than March’s daily average and 2.5% higher than April 2024.
- 74.8% of patients were admitted, transferred or discharged within four hours compared to 75.0% in March and 74.5% in April 2024, which is below the NHS constitutional standard of 95%.
- The average ambulance response time for category 2 calls was 27 minutes and 34 seconds. This has decreased from 28 minutes and 34 seconds in March 2025 and 30 minutes and 22 seconds in April 2024. This is below the 30 minute target for the year but not the NHS constitutional standard of 18 minutes.
- As of the end of March, there were 7.42 million waits for treatment, an increase of 18,751 from February 2025. The estimated number of patients waiting for care at the end of March was 6.25 million people. Of the 7.42 million pathways on the waiting list in March 25, 1.17 million had a decision to be admitted for treatment.
- There were 180,242 waits of more than 52 weeks for treatment at the end of March, compared to 309,299 at the end of March 24 (down 41.7%) and 193,516 at the end of February 25 (down 6.9%). Waits of more than 65 weeks for treatment was 7,381 at the end of March, reduced compared to 48,967 at the end of March 2024 (down 84.9%) and 13,223 in February 2025 (down 44.2%).
- 2 key ambitions for Cancer Waiting Times performance were set by the NHS Operational Planning Guidance for 2024/25 – to reach 77% for the faster diagnosis standard and 70% for the 62-day urgent referral to first treatment standard by March 2025. Both cancer ambitions were achieved, with performance against the faster diagnosis standard at 78.9% and for the 62-day urgent referral to first treatment standard at 71.4% in March 2025.
- Over the last 3 years the number of organisations submitting data to the mental health services dataset has increased from 284 in March 2023, to 351 submitters in March 2024, to 401 for March 2025.
Urgent and emergency care
Urgent and emergency (UEC) care services continued to face higher demand in April. The service also dealt with the Easter bank holiday – a time when the whole system typically experiences increased pressure.
There were 2,295,820 attendances at A&E departments across England in April. The average daily attendances increased to 76,527 this is 0.7% lower than March’s daily average and 2.5% higher than April 2024.
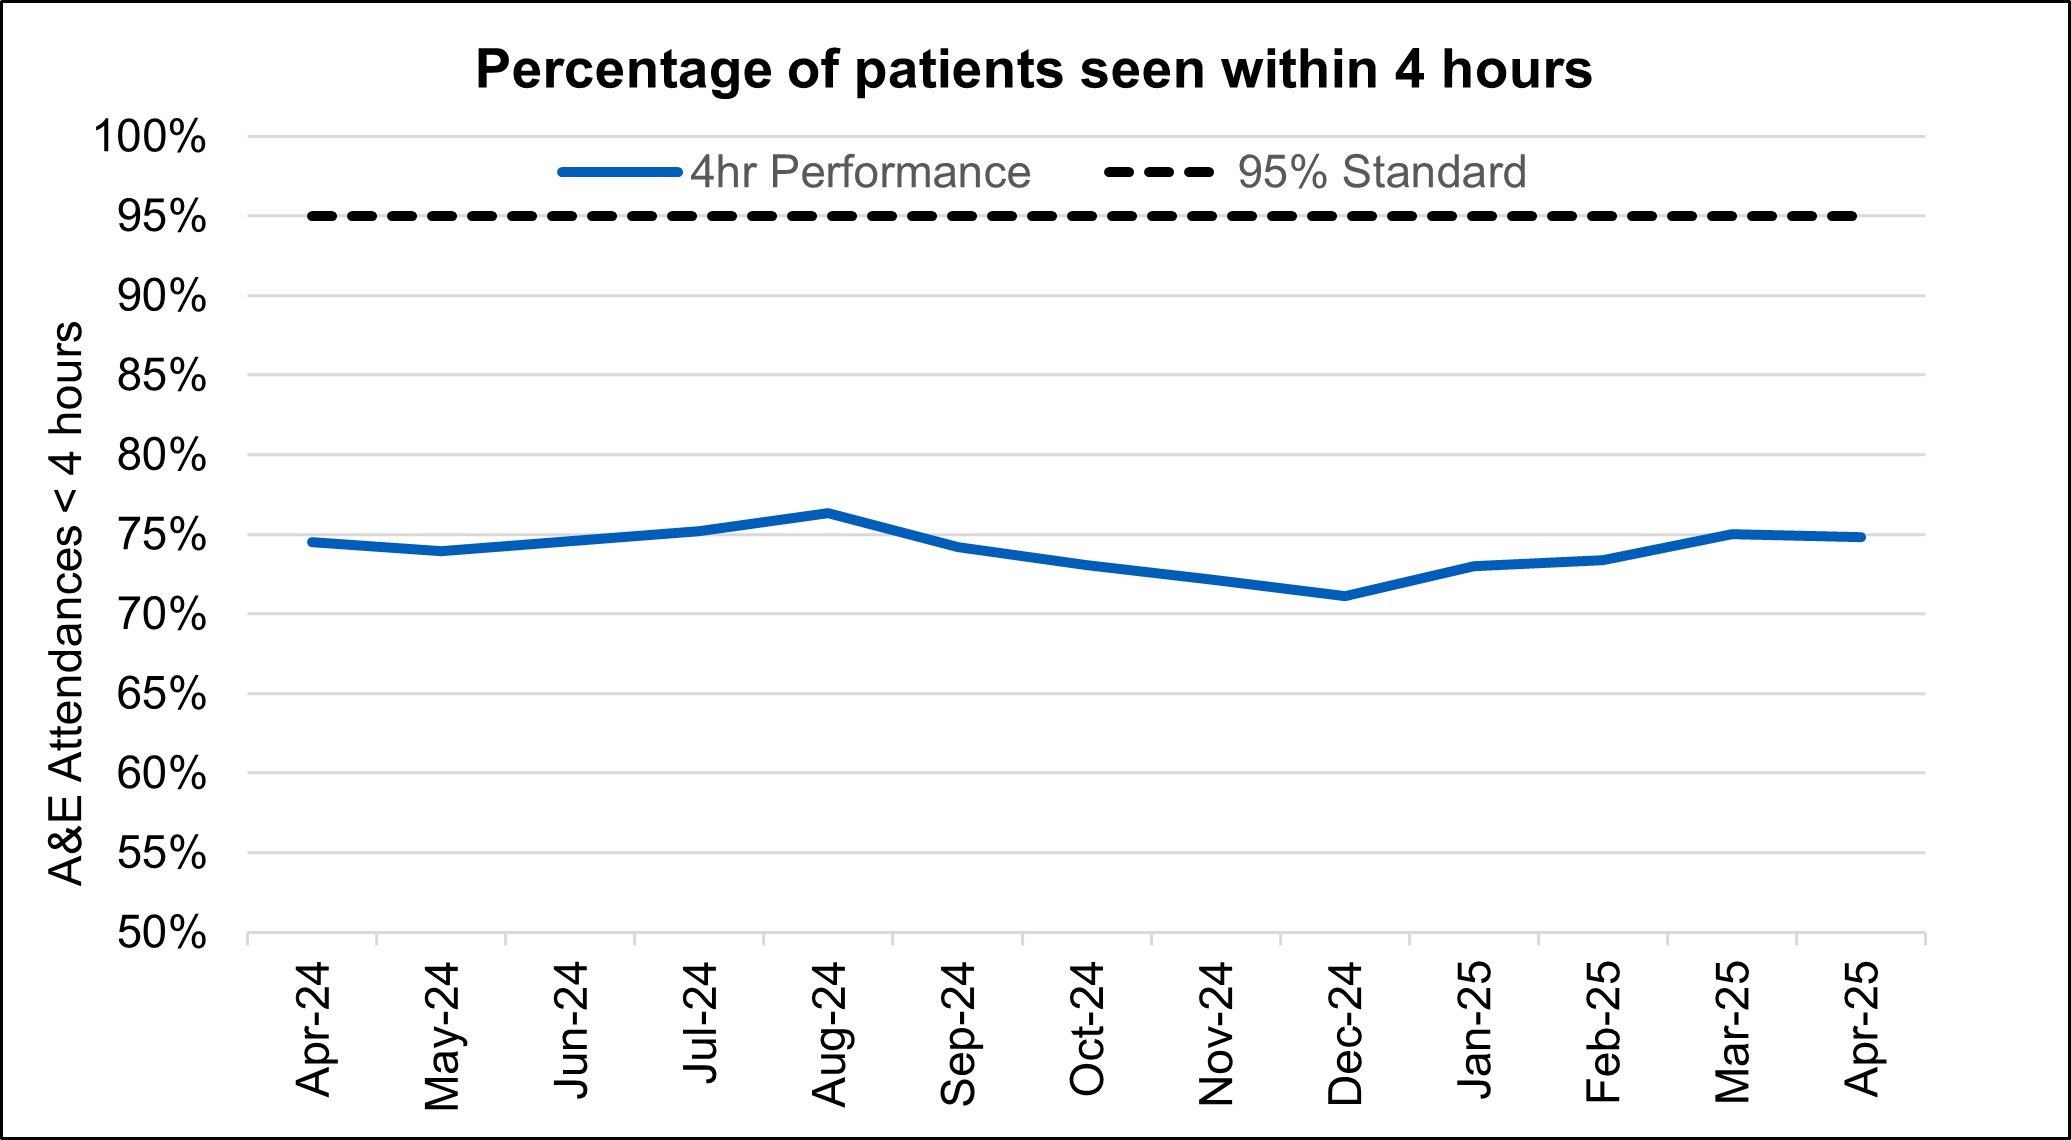
74.8% of patients were admitted, transferred or discharged within four hours compared to 75.0% in March and 74.5% in April 2024, which is below the NHS constitutional standard of 95%.
The provisional figures published for April indicate that 9.9% of patients attending a type 1 A&E department spent 12 hours from arrival in A&E compared with 9.7% last month.
Percentage of patients seen within 4 hours
Ambulance services answered 761,608 calls to 999, or 25,387 per day, a decrease of 3.0% compared to March 2025 and 3.8% more than April 2024. There were 374,575 incidents where a patient was conveyed to A&E or 12.5 thousand per day, 0.3% per day more than in March 2025 and 2.0% more than April 2024.
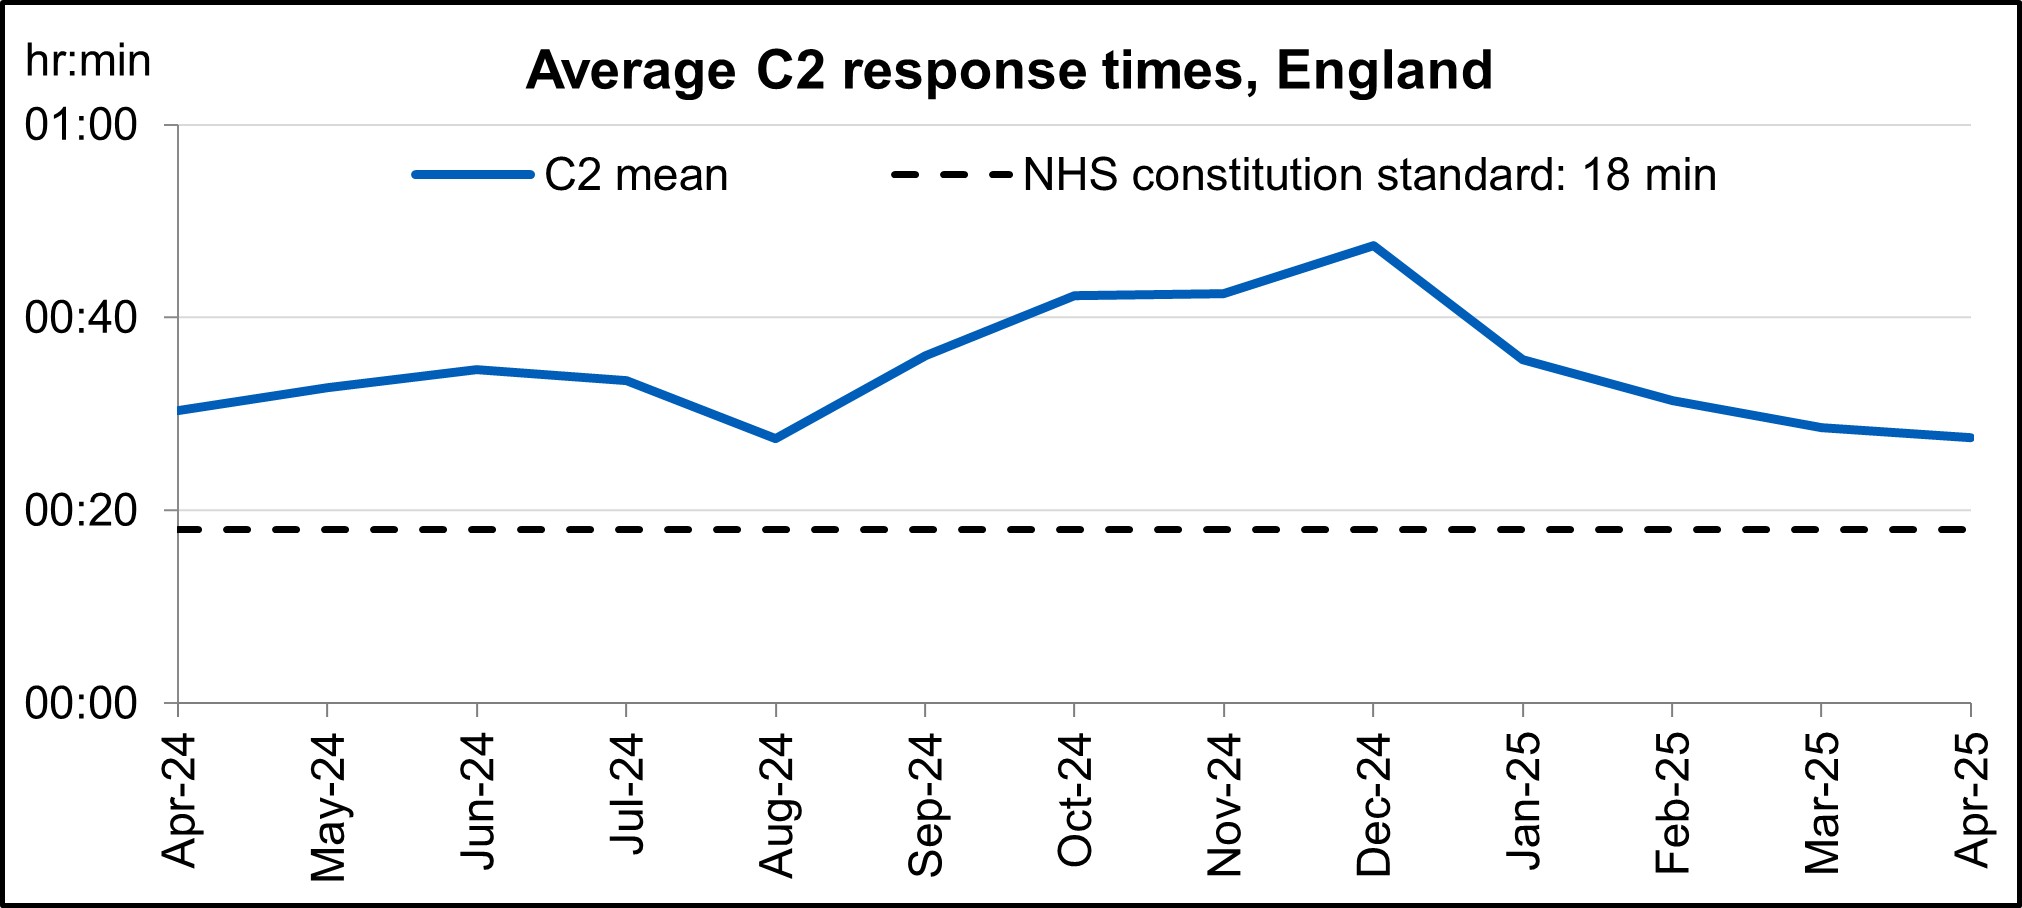
The average ambulance response time for category 2 calls was 27 minutes and 34 seconds. This has decreased from 28 minutes and 34 seconds in March 2025 and 30 minutes and 22 seconds in April 2024. This is below the 30 minute target for the year but not the NHS constitutional standard of 18 minutes.
Average C2 response times, England
‘Hear and Treat’ clinical teams have been embedded in all ambulance control centres to increase the number of patients who can be appropriately treated over the phone. 999 calls are responded to by an ambulance service over the phone instead of sending an ambulance, with a clinician giving treatment and advice remotely.
Since March 2024, 16% of all ambulance calls across England were handled by ‘Hear and Treat’, meaning they did not require an ambulance to be dispatched. As well as improving outcomes for patients, ‘Hear and Treat’ also reduces pressure on emergency departments and improves ambulance response times.
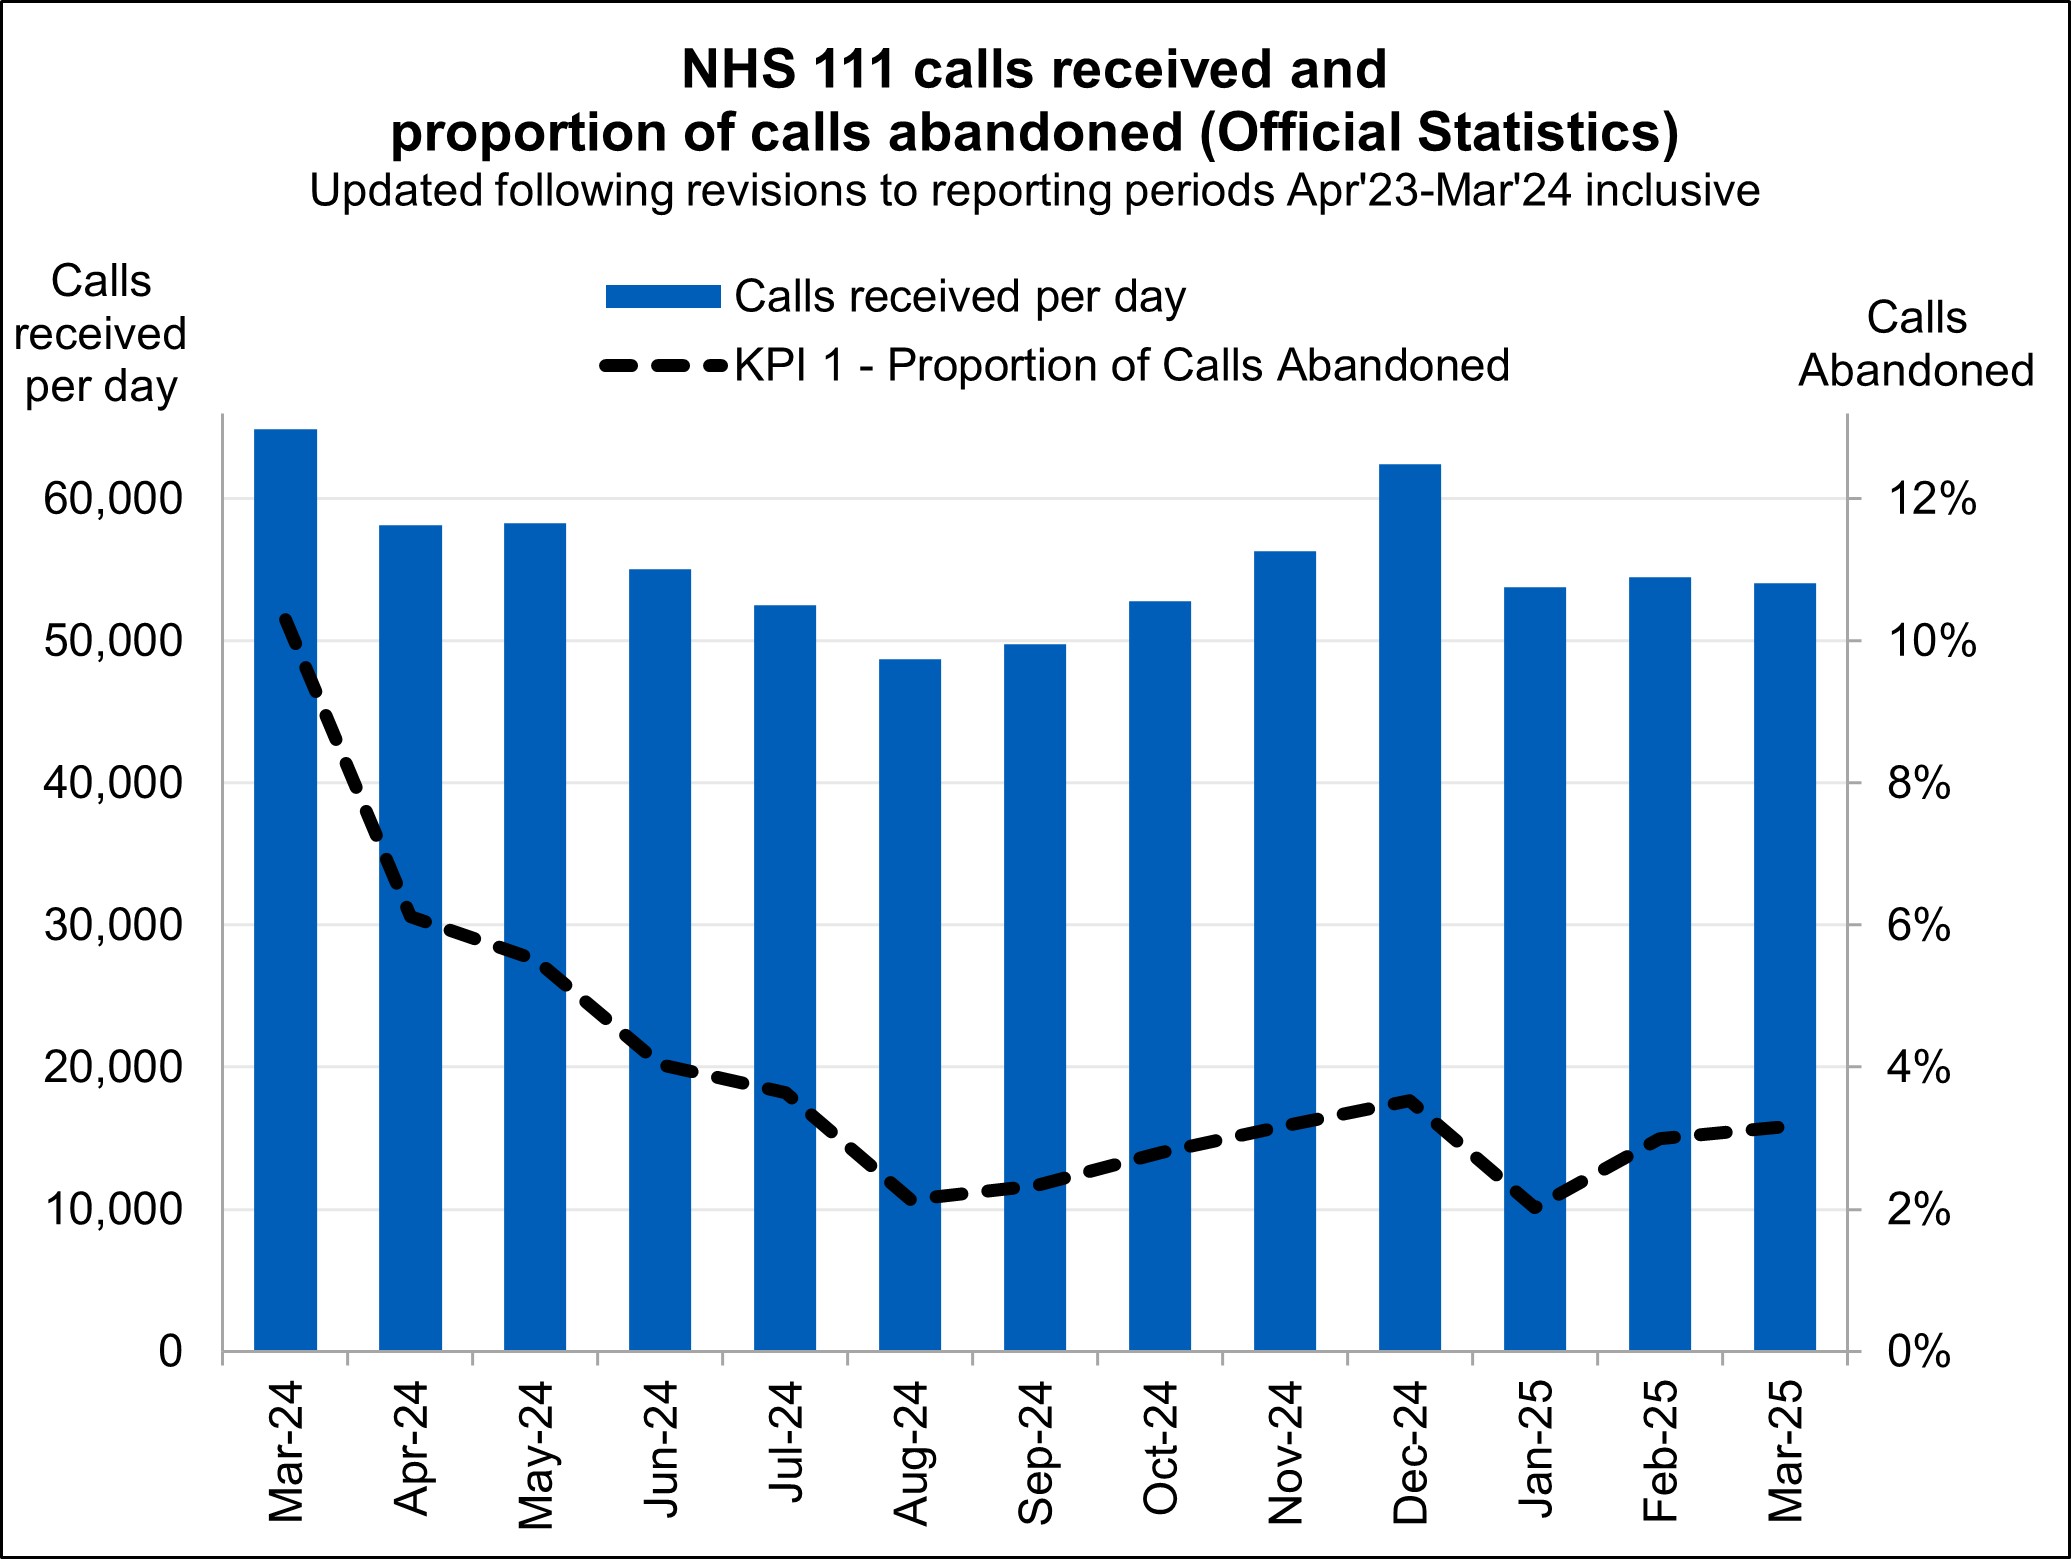
NHS 111 received 1.68 million calls (c. 54.0 thousand per day) in March 2025. Demand per day was 17% down year on year and down 0.8% on February 2025.The proportion of calls abandoned increased 0.2% percentage points from the previous month (now at 3.2%) and the average speed to answer stayed at 57 seconds.
NHS111 calls received and proportion of calls abandoned
(Official statistics) Updated following revisions to reporting periods April 2023 to March 2024 inclusive.
Elective recovery
Elective care covers a broad range of planned, non-emergency services – from tests and scans to outpatient appointments, surgery and cancer treatment.
As of the end of March, there were 7.42 million waits for treatment, an increase of 18,751 from February 2025. The estimated number of patients waiting for care at the end of March was 6.25 million people. Of the 7.42 million pathways on the waiting list in March 25, 1.17 million had a decision to be admitted for treatment.
While NHS staff have worked extremely hard in the aftermath of the pandemic to tackle the elective backlog – reducing long waits and treating the most clinically urgent cases – the NHS is a long way from meeting the required constitutional standard.
The Elective Reform Plan was launched in January 2025, which sets out our intention to return to delivery of the constitutional standard: 92% of patients on the waiting list should have been waiting no longer than 18 weeks from referral to treatment.
The Elective Reform Plan also sets out the ambition to improve the percentage of patients waiting no longer than 18 weeks for a first appointment to 72% by March 2026. The position in the latest management data is 58.3%.*
* Management information for the latest month is taken from the Waiting List Minimum Dataset (WLMDS). Figures include data up to week ending 27 April 2025. WLMDS data is subject to less validation than the published monthly figures. All acute trusts submitted data for week ending 27 April 25.
To meet the 18-week standard and reform elective care by March 2029, we are focusing on empowering patients by giving them more choice and control, reforming delivery by working more productively, delivering care in the right place and aligning funding, performance oversight and delivery standards.
The ambition for 18 weeks performance is to reach the constitutional standard of 92% by March 2029 and 65% by March 2026, the current position is 59.8% (up 0.6 percentage points from February 2025).
There were 180,242 waits of more than 52 weeks for treatment at the end of March, compared to 309,299 at the end of March 24 (down 41.7%) and 193,516 at the end of February 25 (down 6.9%). This represents 2.4% of the total waiting list.
Referral to treatment 52-week waits
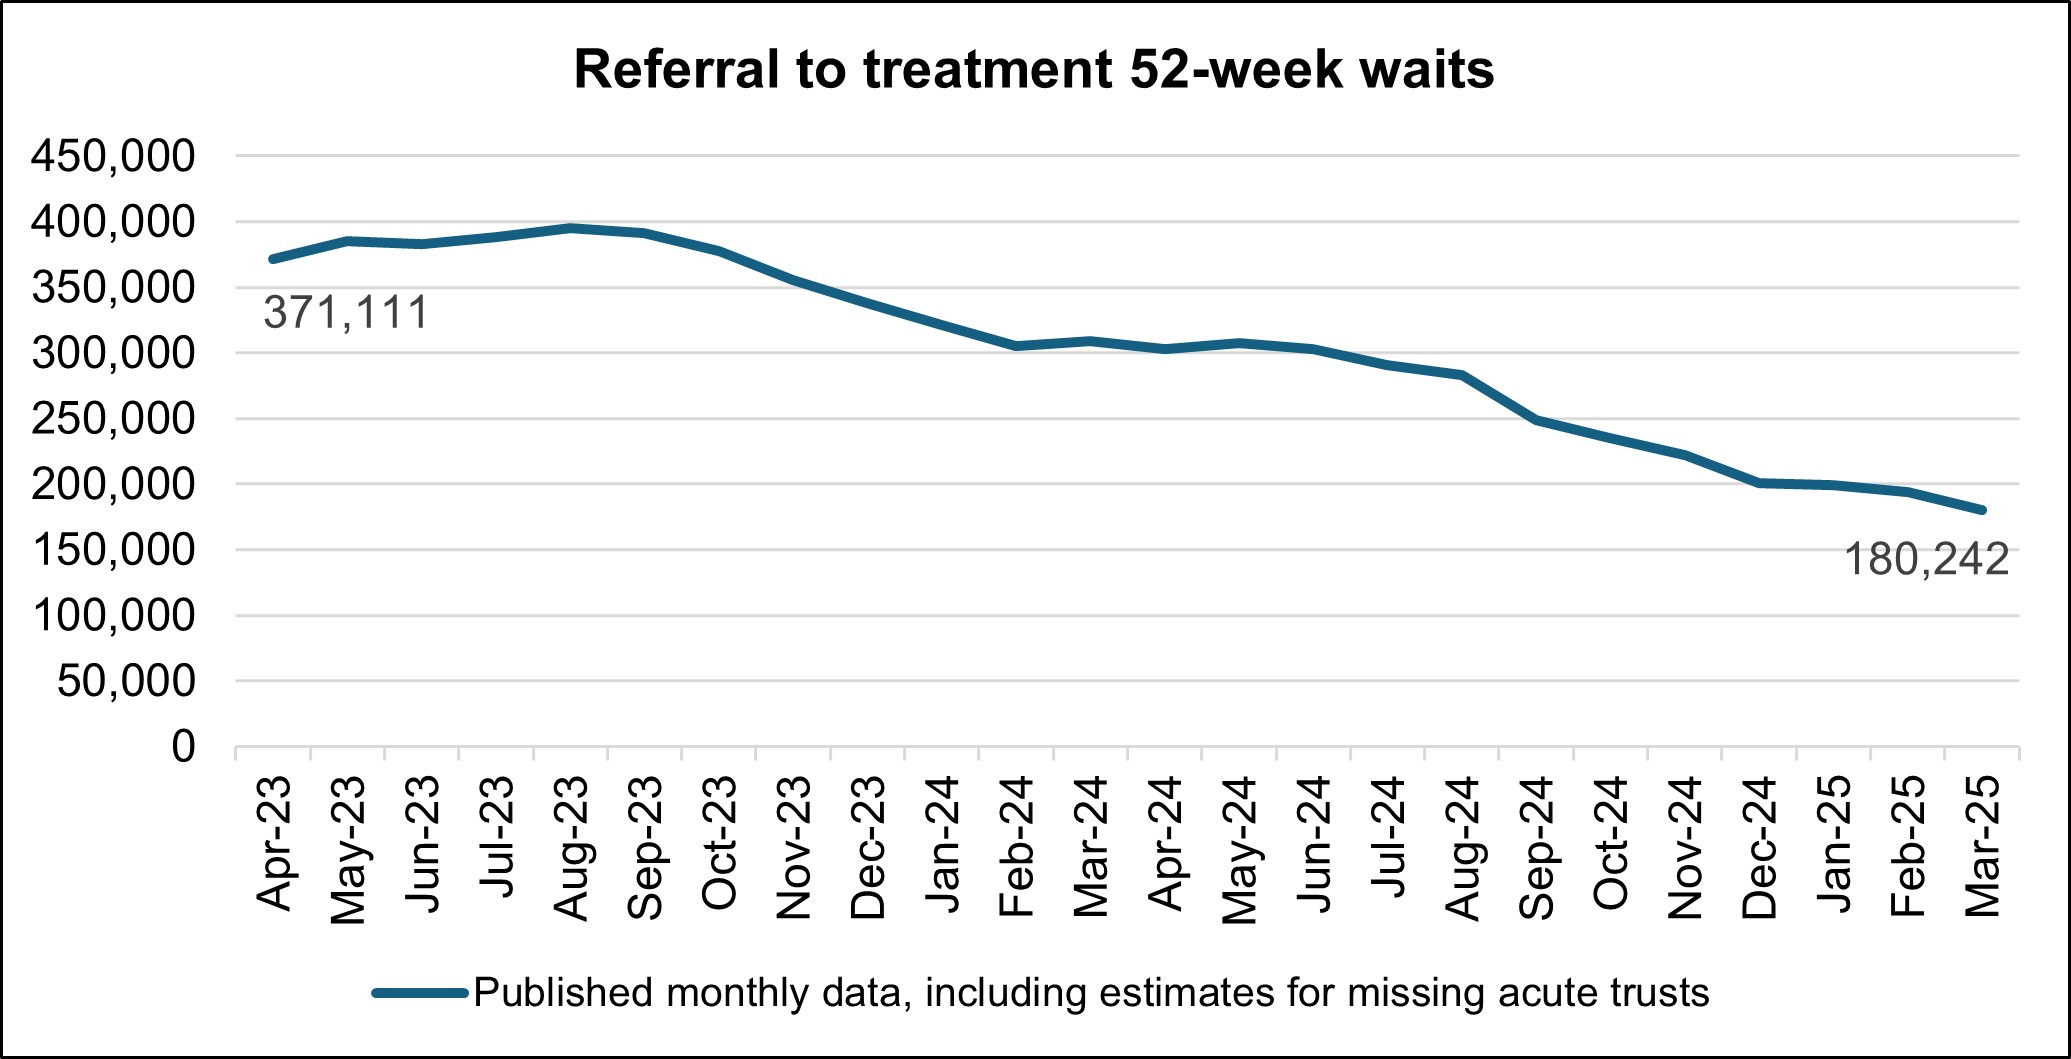
As we shift the focus to the 18-week standard, we will continue to ensure that the longest waits are tackled and the number of patients waiting unacceptably long times continues to reduce.
The % waiting for first attendance within 18 weeks is calculated using:
- Denominator: the number of cases where patients on the waiting list without a decision to admit (i.e. incomplete outpatient pathways) were waiting for a first appointment at the snapshot date
- Numerator: the number of cases where patients on the waiting list without a decision to admit were waiting for a first appointment and had been waiting up to 18 weeks at the snapshot date
Waits of more than 65 weeks for treatment was 7,381 at the end of March, reduced compared to 48,967 at the end of March 2024 (down 84.9%) and 13,223 in February 2025 (down 44.2%).
There has been a reduction in the longest waits for care, 1,164 patients were waiting more than 78 weeks for treatment at the end of March, compared to 4,769 at the end of March 2024 (down 75.6%) and 1,691 in February 2025 (down 31.2%).
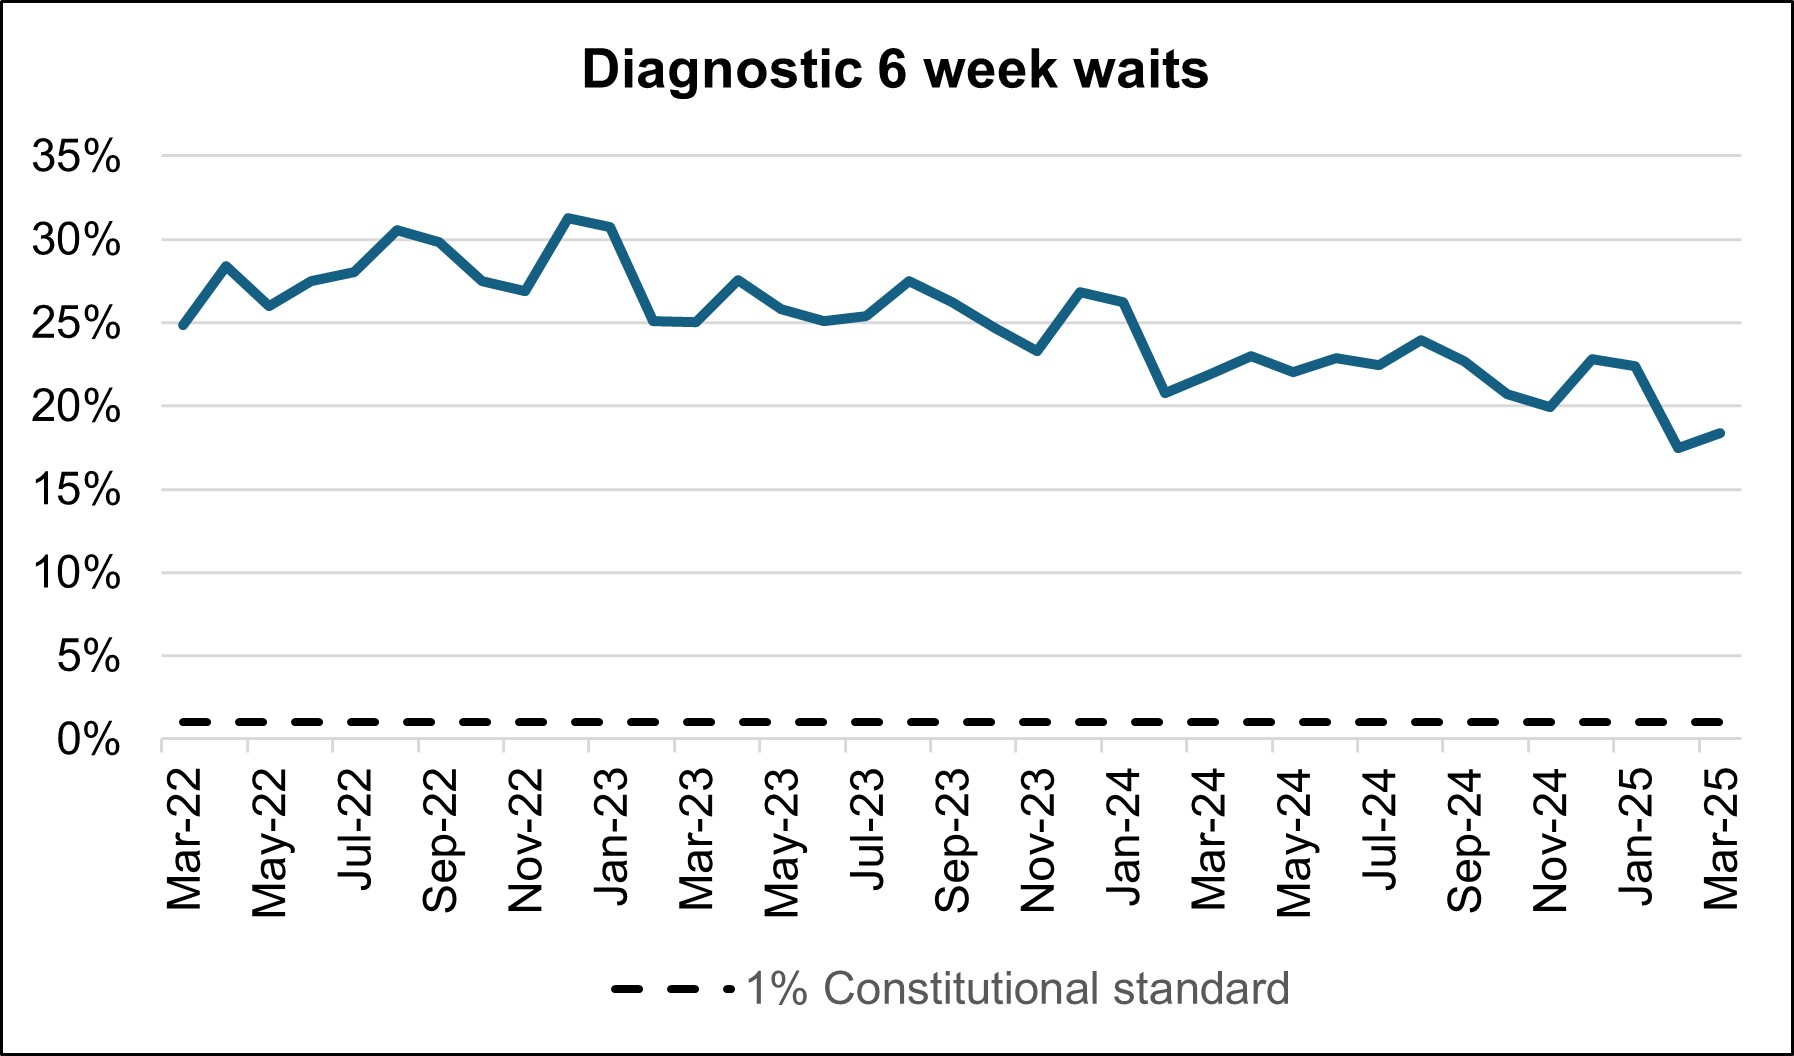
2.5 million diagnostic tests were delivered in March, 10.7% higher than the same month last year (2.3 million in March 2024). At the end of March, there were 1.7 million diagnostic waits, of which 312,700 had waited 6 weeks or more.
The percentage of 6 week waits was 18.4%, up from 17.5% in February 2025 but down from 21.8% in March 2024. Progress is being made towards the interim recovery target of not more than 5% of the waiting list over 6 weeks and an increased percentage of diagnostic activity is supplied by Community Diagnostic Centres.
Diagnostic 6-week waits
By providing a wider range of and capacity for tests and more consulting rooms, CDCs can improve elective pathways for both urgent cancer pathways and routine diagnostic pathways. There are 1.7 million waits for the 15 major diagnostic tests and demand is rising. With 170 community diagnostic centres (CDCs) up and running by the end of March 2025, these centres can take on more of the growing diagnostic demand within elective care.
Cancer
The NHS Operational Planning Guidance for 2024/25 set two key ambitions for Cancer Waiting Times performance, to reach 77% for the Faster Diagnosis Standard and 70% for the 62 day Urgent Referral to First treatment standard by March 2025. As in 2023/24, both of the cancer ambitions were achieved with performance against the Faster Diagnosis Standard at 78.9%, and for the 62 day Urgent Referral to First Treatment standard at 71.4% in March 2025.
The NHS now plans to build on this success, with the NHS planning guidance for 2025/26 increasing the requirement for the Faster Diagnosis Standard to 80% in March 2026 (before formally raising the Constitutional standard to this level from this point forward as announced in August 2023), alongside setting the requirement to increase 62 day Urgent Referral to First Treatment performance to 75%, as a further staging post to fully recovering performance against the 85% standard.
In March 2025, there were 272,165 patients seen following an Urgent Suspected Cancer referral, equivalent to nearly 13,000 patients seen per working day. This is 2.7% more than last month (February 2025), and 1.5% higher than at the same point last year (March 2024). We also saw 55,153 patients received treatment for cancer, equivalent to more than 2,500 patients per working day. This is similar levels to last month, and similar levels to the same point last year (March 2024).
The NHS is working hard to keep up with this increase in demand. We are making strong progress on diagnosing patients earlier, which will improve outcomes and have been accelerating the installation of new diagnostic capacity, much of it in Community Diagnostic Centres.
Cancer early diagnosis rate across England

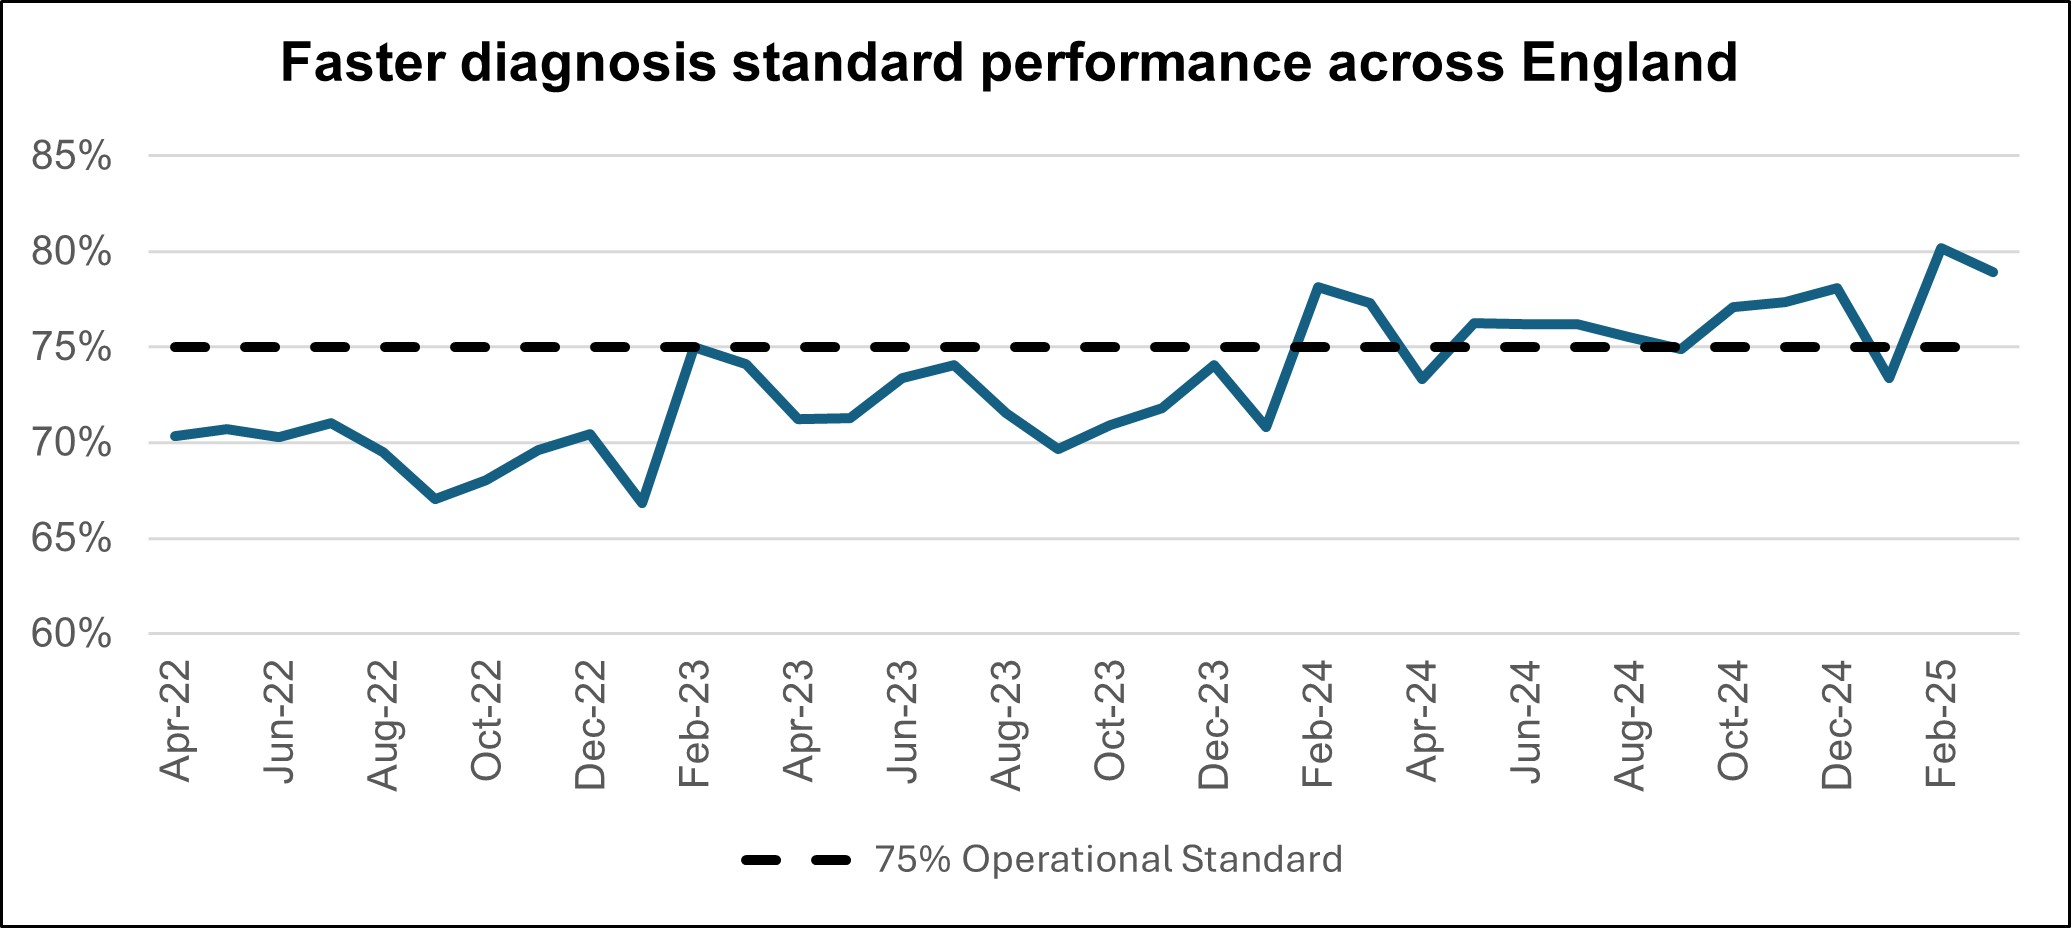
Performance against the 28 day faster diagnosis standard to reduce the time between referral and diagnosis of cancer was 78.9% in March 2025. This is above the NHS constitutional standard of 75% and represents a 1.3 percentage point decrease from February 2025 and conforms to seasonal decreases in performance that are commonly observed each March. Performance for March 2025 represents a 1.6 percentage point increase compared to the same point last year.
Faster diagnosis standard performance across England
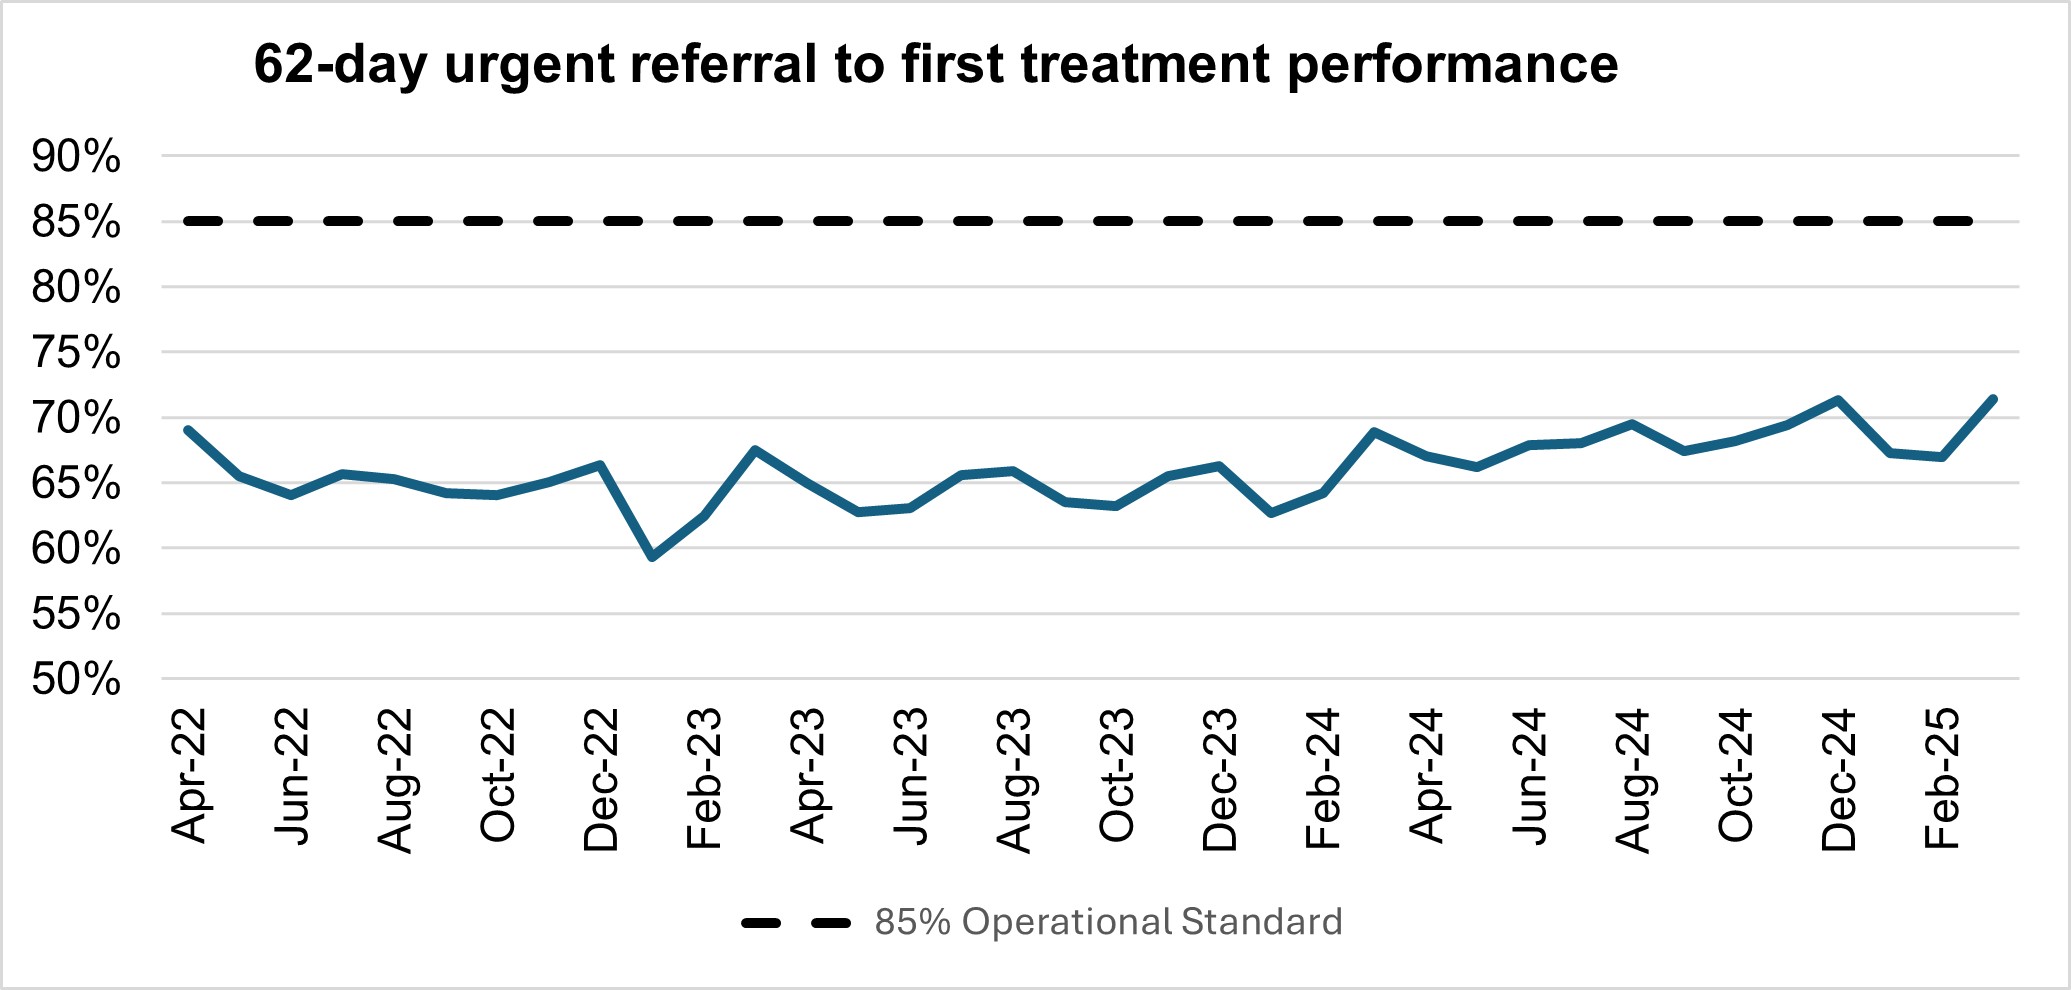
Performance against the 62 day Urgent Referral to First Treatment Standard to begin first definitive treatment of an urgent suspected cancer referral, breast symptomatic referral, urgent screening referral or a consultant upgrade was 71.4% in March 2025. This was 4.4 percentage points higher than February 2025. March’s 2025 performance was 2.5% higher than the same point last year.
62-day urgent referral to first treatment performance
Mental Health
As service access has expanded, so too has data completeness and quality, which is an important but often overlooked part of service transformation.
Over the last 3 years the number of organisations submitting data to the Mental Health Services Dataset has increased from 284 in March 2023, to 351 submitters in March 2024, to 401 for March 2025.
This increase is due to newly submitting providers, often smaller Voluntary Care and Social Enterprise partners, who are key to providing patients with integrated community models of mental health provision, and their contribution to the national dataset is a critical step in recognising and demonstrating the value they provide to patients.