We want to hear from you. Help us understand your digital experience by taking part in our user research. Find out more now.

Introduction
The NHS Oversight Framework (NOF) describes a consistent and transparent approach to assessing NHS providers in 2025/26. For this transitional year, each provider will be scored against a focused set of metrics that target the priorities set out in the 2025/26 NHS priorities and operational planning guidance and allocated to a segment based on their performance against these metrics, from segment 1 (no support) to segment 5 (intensive support through the Provider Improvement Programme).
Although integrated care boards (ICBs) will not be segmented this year, their scores across a range of contextual metrics will be published and NHS England will use these to inform improvement conversations through the year.
To support consistency and transparency in segmentation, we have developed an automated process that follows a set of rules and metrics to derive a provider’s segment. The allocated segment will guide a range of decisions, including our intensity of oversight and scrutiny of each provider, the support they need, our need to intervene or consider using enforcement powers and the granting of additional freedoms.
This manual gives transparency to our decision-making by describing the segmentation process. All underlying data used to derive a segment is available to NHS staff through the Model Health System as well as a publicly accessible dashboard. The delivery metrics technical annex (due to be published shortly) gives the detailed specifications, data sources and scoring methodologies for all metrics that will be scored to inform segmentation. Please read this manual alongside that annex.
Overview of the segmentation process
The automated segmentation process follows 4 sequential steps:
- each metric is scored on a scale of 1 to 4 (some with discrete scores and some continuous) with 1 being the highest rating
- all individual metric scores are consolidated, averaged and quartiled to give a single overall segment of 1, 2, 3 or 4
- an adjustment ensures that any organisation with an underlying financial deficit cannot be allocated to a segment higher than 3
- the segment is finalised. As part of this process the NHS England considers the organisation’s capability and segment to identify the most challenged providers, placing them in segment 5
The following sections describe how each of these steps operates.
Step 1: individual metric scoring
Selecting metrics
We have selected the delivery metrics that underpin segmentation to give a headline view of delivery across a range of domains. They cover core NHS operating objectives, aligned to the 2025/26 NHS priorities and operational planning guidance, financial delivery and quality of care.
The list of metrics is published in Annex A of the NHS Oversight Framework and it will be reviewed annually.
Each metric meets 5 core criteria:
- aligns to a published objective or duty
- is comparable between organisations (of a similar type)
- is based on publicly available data
- can be interpreted without excessive caveats
- provides a clear indicator of ‘good’ performance
Frequency and timeliness
Metrics cover different time periods and have varying lag times, for example survey data is published annually while performance metrics are published on a monthly basis. We will run the segmentation process on a quarterly basis, as soon as possible after all official operating statistics for the previous quarter have been published. In some cases, a provider’s internal information may be more up to date than the data we will be using, but to allow for meaningful comparison we will use verified official statistics wherever possible even if these lag the current performance position.
All metrics will be refreshed quarterly to ensure that each quarter we publish segmentation relating to the verified official position for the previous quarter; that is, segmentation based on quarter 1 data will take place before the end of quarter 2. Where official data is updated monthly, the metric will only be updated when the final quarterly data is produced and not within a quarter, but this will not preclude NHS England from intervening where data indicates declining performance within a quarter. When publishing data for each metric we will clearly display the time period to which it relates.
Weighting
We have deliberately not applied weighting to individual metrics but with one exception. As the rates for different infections cannot be combined into a single measure of healthcare associated infection, the 3 measured rates of infection are individually scored, and the scores are then weighted at one-third value to ensure that their combined score has the same impact as other single metrics.
We will also apply a financial override to ensure no organisation with a financial deficit or in receipt of deficit support can be allocated to a segment higher than 3 overall (see step 3).
Missing data
Where an organisation submits data for a metric, it will receive a score for that metric unless the data is suppressed due to low numbers. Where an organisation does not submit data or the data is suppressed, it will receive a score of 0 and the metric will not contribute to the organisation’s overall score. Where an organisation is not expected to submit data as the metric relates to a function it does not perform, this will also be excluded from scoring models.
Disclosure
We have tried to ensure that metrics are derived from publicly accessible data sources or information that can be shared publicly. In rare cases we may not be able to provide the underlying data; for example, because we do not own the data and do not have permission to publish it. In these circumstances we will still provide scores but only display the underlying data as an anonymised distribution, not the organisation’s specific values. This will allow organisations to see where they sit within a distribution.
Standard scoring models
Each metric receives a score between 1 and 4 (with 1 being the highest performance rating), in line with the following schema:
- where there is a defined operating standard or benchmark for a metric, any organisation reaching that level will be scored 1
- where there is a defined floor (for example, an instruction to improve metric performance from a baseline), any organisation failing to meet that floor will be scored 4
- organisations that do not meet the above conditions, or where those conditions do not exist for the metric, will be sequentially ordered in line with direction of the metric – that is, higher is better or lower is better. The highest and lowest scoring individual organisations will receive a ‘bookend’ score of 1.00 and 4.00 respectively (where no standard or floor exists), 2.00 and 4.00 (where a standard exists as the score of 1 will be reserved for those meeting the standard) or 1.00 and 3.00 (where a floor exists as 4 will be reserved for those not meeting the floor). Those in the middle will receive a score rounded to 2 decimal places based on their position within the range between these bookends as an even spread. This approach limits cliff edges to defined performance thresholds
Worked examples of this scoring schema are shown below.
Worked examples of how scoring using a standard ranking methodology will be applied
Example 1: A metric with a performance standard of 80%
| Lowest performing organisation | Remaining organisations | Highest performing organisation not meeting the target | Organisations meeting the target |
|---|---|---|---|
| Lowest performing individual organisation is scored 4.00 | Organisations scoring between the performance bookends are evenly scored between 2.01 and 3.99 using a percentile rank. Where organisational performance is tied, all organisations receive the same score aligned with the highest performing score in the cluster. For example, if the scores for the organisations in the cluster range from 2.50 to 2.80, all organisations are scored 2.50 | Highest performing individual organisation not meeting the 80% target is scored 2.00 | All organisations that meet or exceed the 80% target are scored 1.00 |
Example 2: A metric with a requirement to improve from a baseline level
| Organisations failing to meet the baseline standard | Lowest performing organisation to exceed baseline standard | Remaining organisations | Highest performing organisation |
|---|---|---|---|
| All organisations that have failed to improve on baseline score 4.00 | Individual organisation with the lowest improvement scores 3.00 | Organisations scoring between the performance bookends are evenly scored between 1.01 and 2.99 using a percentile rank. Where organisational performance is tied, all organisations receive the same score aligned to the highest performing score in the cluster. For example, if the scores for the organisations in the cluster range from 2.50 to 2.80, all organisations are scored 2.50 | Individual organisation with the most improvement scores 1.00 |
Example 3: A metric with no standard or floor and for which higher is better
| Lowest performing organisation | Remaining organisations | Highest performing organisation |
|---|---|---|
| Lowest performing individual organisation scores 4.00 | Organisations scoring between the performance bookends are evenly scored between 1.01 and 3.99 using a percentile rank. Where organisational performance is tied, all organisations receive the same score aligned to the highest performing score in the cluster. For example, if the scores for the organisations in the cluster range from 2.50 to 2.80, all organisations are scored 2.50 | Highest performing individual organisation scores 1.00 |
Bespoke scoring
In some cases, a metric will have a defined threshold, and this can be translated directly to a score without the need for the ranking approach described above. Examples are the Care Quality Commission (CQC) safe rating or neonatal mortality rate, for which performance is reported as a defined bracket that can be directly translated to a 1 to 4 score.
Publication of scoring methodology
The scoring methodology we will use for each metric is fully explained in both the metadata and the technical annex (to be published shortly).
Demonstrating improvement
Metric scores are based on a mix of absolute values and relative performance. They do not consider levels of improvement unless these are specifically built into the metric; for example, percentage increase measures. However, to add more context and where appropriate, we will look to introduce statistical process control (SPC) to demonstrate statistically significant improvement or deterioration in a metric regardless of underlying segment. SPC will not impact on metric scores but may be used to support conversations and evidence gathering for subsequent decisions around allocation of support or intervention.
Step 2: producing an organisational delivery score
Producing a raw delivery score
The raw delivery score for each organisation will be calculated by averaging the individual metric scores; dividing the sum of all metric scores by the number of metrics for which a score is recorded for the organisation – that is, excluding scores of 0. The resulting product is then rounded to 2 decimal places.
Determining the organisational delivery score
We will apply quartiling to the organisational distribution of raw delivery scores to give a raw overall delivery score for each organisation. Organisations in the lowest quartile of raw scores – that is, those with the smallest average metric score – will be scored 1, those with a better than average score but not in the lowest quartile will be scored 2, those with a worse than average score but not in the upper quartile will be scored 3 and those in the upper quartile will be scored 4. This is shown in Figure 1 below.
Figure 1: Process for calculating an organisational delivery score
Please note the data is for illustrative purposes only.
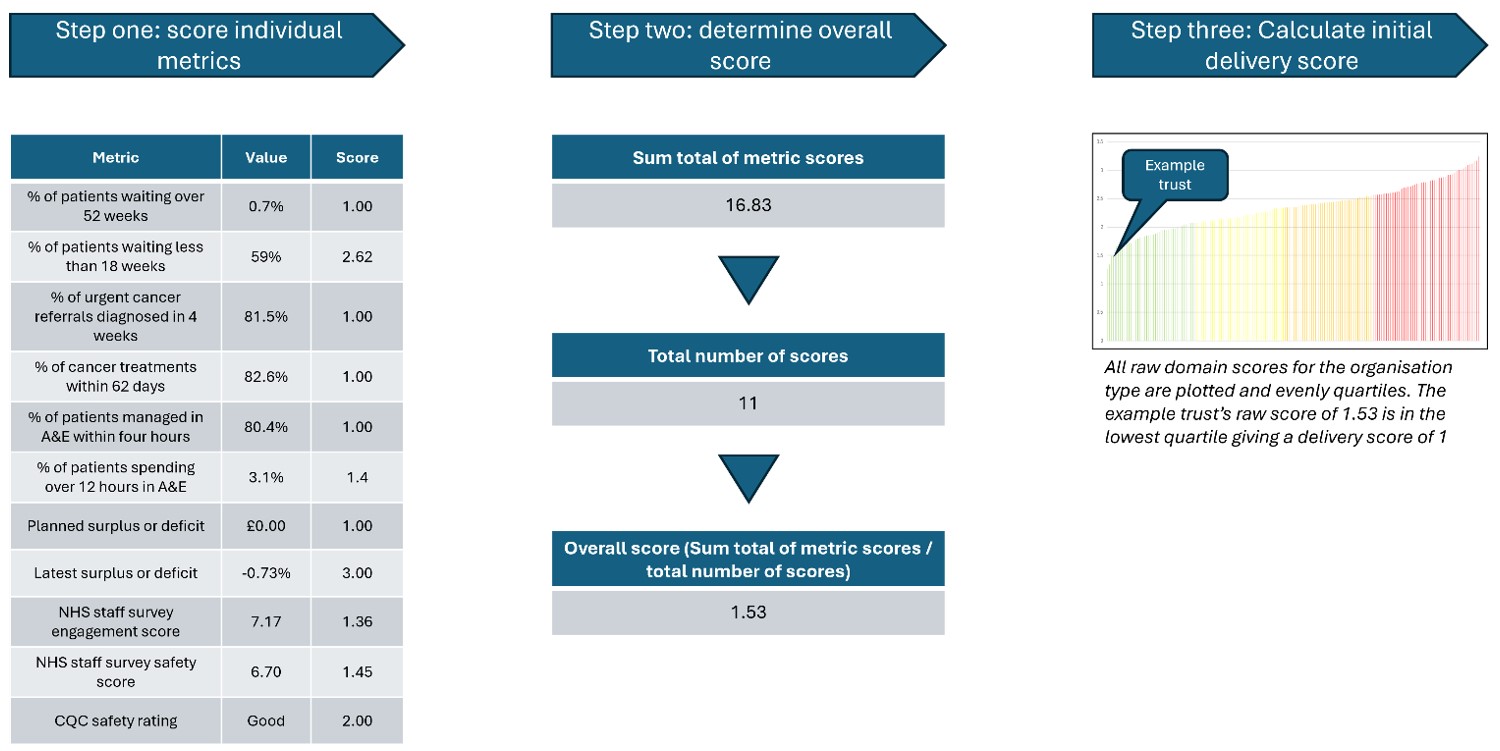
Image test:
Step 1: Score individual metrics
- Metric Value Score
- Percentage of patients waiting over 52 weeks 0.7% 1.00
- Percentage of patients waiting less than 18 weeks 59% 2.62
- Percentage of urgent cancer referrals diagnosed in 4 weeks 81.5% 1.00
- Percentage of cancer treatments within 62 days 82.6% 1.00
- Percentage of patients managed in A&E within 4 hours 80.4% 1.00
- Percentage of patients spending over 12 hours in A&E 3.1 1.4
- Planned surplus or deficit £0.00 1.00
- Latest surplus or deficit -0.73% 3.00
- NHS Staff Survey engagement score 7.17 1.36
- NHS staff survey safety score 6.70 1.45
- CQC safety rating Good 2.00
Step 2: Determine overall score
- Sum of metric scores: 16.83
- Total number of scores: 11
- Overall score (sum of metric scores divided by number of scores): 1.53
Step 3: Calculate initial delivery score
- All raw domain scores for the organisation type are plotted and evenly quartiled. The example trust’s raw score of 1.53 is in the lowest quartile, giving a delivery score of 1.
Step 3: adjusting for financial deficit
It is critical that organisations maintain strong financial grip and control and operate within their allocations. Therefore, segments 1 and 2 are reserved for organisations that do so.
Any provider with a segment of 1 or 2 based on its operational delivery score that is reporting a deficit or is in receipt of deficit support will automatically have its segment downrated to 3. This will be based on organisational not system-wide financial performance.
Step 4: Translating organisational scores to final segment
An organisation’s organisational delivery score, adjusted if applicable for financial deficit, translates directly to the segment it is allocated. For some providers that are allocated to segment 4, the relevant NHS England region will consider their capability rating and determine whether they should be entered into the Provider Improvement Programme (PIP). All providers in the PIP will be placed in segment 5.
Further details on the meaning and implications of allocation to each of the 5 segments can be found in the NHS Oversight Framework.
Provide further contextual performance information
Creating domains
While the segmentation process derives the overall segment for each organisation based on an average metric score, this cannot by itself support improvement or change as it may be based on significant variation in performance at the metric level.
To support segment interpretation and determination of practical next steps, we will also provide a series of domain scores. These scores will be calculated in the same way as that described above for overall organisational delivery score but based on only a subset of metrics rather than the full range. We will provide domain scores for:
- access to services
- effectiveness and experience of care
- patient safety
- finance and productivity
- people and workforce
Domain scores cannot be aggregated to calculate an organisation’s overall score as they are based on varying numbers of metrics and an average calculation.
How to use a domain score
Domain scores are a contextual device for easy identification of potential areas for further investigation or targeted diagnostics. Domain scores could, for example, show that while an organisation is broadly delivering against the NHS operational objectives (a high operating priorities score), it is doing so in a way that is potentially not financially sustainable (a low finance and productivity score). This may indicate the need for targeted review of finances to determine what is driving the potential for a deficit and how this can be addressed while maintaining operational delivery.
Contextual metrics
As set out above, scoring metrics are required to meet 5 core criteria. However, some critical metrics do not but do provide vital context and information. For example, metrics on health inequalities are not directly comparable between systems as their population demographics can be significantly different, but understanding inequality gaps is essential in delivering NHS bodies’ statutory duties to strive to reduce inequality. These contextual metrics are not scored and do not contribute to segmentation but are made available alongside scoring measures. They should be routinely considered and discussed as part of wider system planning and accountability conversations.
The NHS Oversight Framework metrics list (Annex A) lists both the scoring and contextual metrics.
Ensuring continuous improvement
NHS England is committed to ensuring that our methodology remains balanced and effective and we extend our thanks to those individuals and organisations that have supported its development.
We will keep the methodology under constant review to identify areas where it can be improved. We will also review the list of underlying metrics annually to ensure it continues to align with NHS priorities.
If you have any queries regarding the methodology or ideas for how it could be improved, please contact us at nhs.oversightandassessment@nhs.net
Publication of data
To support transparency, NHS England will publish a dashboard to give the public access to the data that underpins segmentation.
Each provider’s domain scores, organisational delivery score and final segmentation will be shown alongside the individual metric scores used to calculate them and the results of their contextual metrics. For ICBs, the dashboard will show the results of the contextual metrics only.
Publication reference: PRN02028_ii