
Version number: 5
First published: February 2019
Updated: March 2023
Updated by: Dr Christine Rivers, Kim Parsons and Pete Loughborough
Classification: OFFICIAL
Publication Gateway reference: 00231
This information can be made available in alternative formats, such as easy read or large print upon request. Please email england.wdes@nhs.net for more details.
1. Overview
As the fifth biggest employer in the world, employing 1.4 million people, the NHS is in a pivotal position to lead the way in the employment of Disabled people in England. The NHS draws on a remarkably rich and diverse workforce who provide high quality care to our patients. We are committed to creating an NHS where all staff are respected and valued for their contributions.
The Workforce Disability Equality Standard (WDES) was introduced in April 2019 as a mandated data collection. The WDES is a collection of 10 metrics that aim to compare the workplace and career experiences of Disabled and non-disabled staff. NHS Trusts and NHS Foundation Trusts are required to report and publish data, on an annual basis, for each of these metrics. In the spirit of openness and transparency, national healthcare organisations have also adopted the WDES.
Trusts*, integrated care boards (ICBs) and national healthcare organisations (also known as arm’s length bodies or ALBs) can use the data they collect to better understand where the inequalities for Disabled colleagues exist. They are progressing actions, through their WDES action plan, to work towards year-on-year improvements.
*Note. Within this technical guidance we have used the term ‘trusts’ to refer to NHS Trusts and NHS Foundation Trusts.
Each WDES data analysis report has highlighted that Disabled job applicants are less likely to be appointed through shortlisting, whilst Disabled NHS staff are:
- more likely to go through performance management capability processes,
- more likely to experience harassment, bullying or abuse,
- less likely to feel that they have equal opportunities for career progress or promotion,
- more likely to feel pressured to attend work,
- less likely to feel valued for their contribution to the organisation,
- and less likely to feel engaged.
Disabled people also continue to be underrepresented in middle to senior pay bands and on boards.
2. Introduction
This document contains the information that will support those tasked with collecting and reporting WDES metrics data and producing WDES action plans. This guidance is part of a package of resources to support organisations achieve measurable and continuous improvements in progressing workforce disability equality.
It will be particularly helpful to HR directors and workforce information specialists, equality leads, Disabled staff and networks, staff-side partners (disability and equality leads) and other colleagues who are involved in implementing the WDES.
This technical guidance will be useful to organisation chief executives, senior management teams and boards who hold local responsibility for ensuring compliance with the WDES. Those who are otherwise committed to supporting the WDES aims will also find this detailed guidance informative.
3. Mandatory coverage of the WDES
The WDES is mandated through the NHS Standard Contract under Service Condition 13.8 for trusts.
The table below is taken from the NHS Standard Contract.
| SC13 Equity of Access, Equality and Non-Discrimination | Applicability |
| 13.8 The Provider (if it is an NHS Trust or an NHS Foundation Trust) must implement and comply with the National Workforce Disability Equality Standard and submit an annual report to the Co-ordinating Commissioner on its compliance. | All |
The scope of the WDES was extended in 2020 to include national healthcare organisations.*
*Note. Whilst it was our original intention, after year two, to widen the scope of the WDES to include other organisations, this has largely been delayed.
4. The importance of the WDES
4.1 The WDES data analysis reports
The evidence set out in the each published annual report highlights that Disabled NHS staff continue to experience inequalities across all of the WDES metrics. The data provides a robust evidence-base and reinforces the need for the WDES to act as a catalyst for change in creating a fairer and more equal NHS.
4.2 The NHS People Plan
The WDES is referenced in the NHS People Plan. Published in 2021, the plan sets out actions to support transformation across the whole NHS. It focuses on how we must all continue to look after each other and foster a culture of inclusion and belonging, as well as take action to grow our workforce, train our people, and work together differently to deliver patient care. The Plan makes clear that the NHS must welcome all, building understanding, encouraging and celebrating diversity in all its forms.
4.3 The NHS Constitution
The NHS is founded on a core set of principles and values that bind together the diverse communities and people it serves – the patients and public – as well as the staff who work in it. The NHS Constitution establishes these principles and values for the NHS in England. It sets out the rights, to which all patients, communities and staff are entitled to, and the pledges and responsibilities which the NHS is committed to achieve, to ensure that the NHS operates fairly and effectively.
The NHS Constitution reiterates the rights of people using NHS services to healthcare that is free from discrimination; it also includes the rights of staff to a workplace that is free of discrimination, and the commitment of the NHS to putting this into practice.
The WDES is deeply rooted in the fundamental values, pledges and responsibilities set out in the NHS People Plan and the NHS Constitution.
4.4 The law and advancing disability equality
The historically poorer employment rates for Disabled people was one of the drivers that led to the introduction of the Disability Discrimination Act (DDA) 1995. The DDA was replaced by the Equality Act 2010, which sought to harmonise and simplify previous equalities legislation; disability is one of the Act’s nine (9) protected characteristics (age, disability, gender reassignment, race, religion or belief, sex, sexual orientation, marriage and civil partnership and pregnancy and maternity).
Section 149 of the Equality Act sets out the Public Sector Equality Duty (PSED), which offers protection in relation to employment, as well as access to goods and services. The PSED strengthens the duty on employers to eliminate discrimination and advance equality of opportunity for staff with protected characteristics, including disability. Implementing the WDES will assist organisations to ensure that they are complying with the provisions of the Equality Act 2010, and the aims of the PSED.
The WDES will also drive improvements for Disabled patients and their care, as it encourages the development of a more diverse, empowered and valued workforce, and a better understanding of disability equality across the NHS workforce.
4.5 Disability and employment
We recognise that there have been historic challenges for Disabled people in accessing employment. Recent official data highlights that, as of December 2021, 8.4 million people of working age were identified as Disabled. This represents 20% of the working age population and is an increase of 327,000 from 2019.
Across the UK, 52.3% of Disabled people were in employment, compared to 81.1% of non-disabled people. In relation to unemployment, the rate for Disabled people was 8.4% in October-December 2021, up from 6.9% a year previously. This compared to an unemployment rate of 4.6% for non-disabled people.
3.6 million Disabled people of working age were economically inactive (i.e., not in work and not looking for work). This was an increase of 226,000 from a year before.
Disabled people were statistically more likely to be economically inactive (economic inactivity rate of 42.9% for Disabled people, compared to 14.9% for non-disabled people).
4.6 Impact of COVID-19 on Disabled people in employment
Official statistics also show that there has been a disproportionate impact on Disabled people in employment during the COVID-19 pandemic. During the pandemic the proportion of Disabled people in employment has gone down, while the proportion who are either unemployed, or economically inactive, has risen from 45.9% to 47.7%.
Whilst non-disabled people have also seen an increase in the proportion who are either unemployed or economically inactive, the increase has been smaller (from 17.8% to 18.9%). This has meant that that the disability employment gap has increased over the past year from 28.1% points to 28.8%.
4.7 Principles that have informed the design of the WDES
The social model of disability, the ethos of ‘Nothing About Us Without Us’ and the concept of ‘Disability as an Asset’, which are advocated by Disabled people and disability rights organisations, underpin the WDES.
Social model of disability
The ‘social model of disability‘ recognises that Disabled people face a range of societal barriers, and these, rather than an individual’s impairment or long-term condition, create disability. These barriers can include:
- Buildings and estates – which may have been poorly designed and are not fully accessible. Older buildings may have also been built at a time before accessibility requirements were legally mandated.
- Limited job and career opportunities – As WDES data has highlighted, Disabled people are less likely to be appointed to jobs in the NHS. Disabled staff in the NHS are also underrepresented in middle to senior pay bands.
- Working environment – WDES data also highlights that a quarter of Disabled staff do not believe that their employer has provided reasonable adjustments. Reasonable adjustments are intended to remove or reduce any barriers that a Disabled colleague may experience in the workplace.
- Attitudinal – Compared to non-disabled colleagues, we also know that Disabled colleagues are more likely to experience harassment, bullying or abuse from patients/the public, managers and colleagues.
The social model helps people to recognise the barriers that make life harder for Disabled people. What is powerful and liberating about the social model is that it reflects the lived experience of Disabled people. It puts forward a radical and practical approach to ending Disabled people’s exclusion and oppression that does not require Disabled people to change who they are in order to be deemed to be entitled to the same rights and opportunities as non-disabled people.
‘Nothing about us without us’
Through their lived experiences, Disabled people have crucial expertise about how they will be affected by actions and decisions. The concept of ‘Nothing about us without us‘ argues that actions and decisions that affect, or are about, Disabled people should be informed by the views of Disabled people. Where appropriate, actions should be taken in partnership with Disabled people.
‘Disability as an Asset’
‘Disability as an Asset’ refers to the benefits of employing Disabled staff and the positive impact that disability inclusion can have in the workplace. A central element of this concept is developing a culture in which people can speak openly and positively about disability and bring their lived experience into work – benefitting workplace culture and patient care. A workplace in which Disabled staff are visible and feel supported will engender greater awareness throughout the workforce. Making disability integral to mainstream policies from the point of application, through induction and continuing development and training, recognises that disability can affect us all and that promoting inclusion is everyone’s business.
5. The WDES Metrics
There are ten (10) WDES metrics.
- Three (3) metrics focus on workforce data;
- Five (5) are based on questions from the NHS Staff Survey;
- One (1) metric focuses on disability representation on boards;
- One (1) metric (metric 9b) focuses on the voices of Disabled staff.
Three WDES metrics (2, 5 and 10) are the equivalent of indicators set out in the Workforce Race Equality Standard (WRES), whilst WDES metric 1 is similar to the WRES indicator on workforce representation. WDES metric 4 is closely related to the two WRES metrics (5 and 6) on bullying and harassment.
WDES metric 9a draws from the NHS staff engagement score, which is an amalgamation of several questions in the NHS Staff Survey. More information about the staff engagement score is provided in Annex B.
WDES metric 9b asks for evidence of action to facilitate the voices of Disabled staff to be heard. Depending on the response, evidence of actions or plans to address the gap should be added to the organisation’s Annual report.
It should be noted that within the WDES metrics the term ‘Disabled compared to non-disabled’, analyses the differences in experience between those staff who have responded ‘Yes’ and ‘No’ to monitoring questions about whether they have a disability. The label “Unknown” is used to refer to the other options recorded on ESR, namely “Prefer not to answer”, “Not declared” and “Unspecified”.
The first three metrics compare workforce data between Disabled and non-disabled staff.
Metric 1
Percentage of staff in Agenda for Change (AfC) pay-bands or medical and dental subgroups and very senior managers (including Executive Board members) compared with the percentage of staff in the overall workforce.
Organisations should undertake this calculation separately for non-clinical and clinical staff in clusters 1 to 4.
| Cluster 1 | AfC Bands under 1, 1, 2, 3 and 4 |
| Cluster 2 | AfC Bands 5, 6 and 7 |
| Cluster 3 | AfC Bands 8a and 8b |
| Cluster 4 | AfC Bands 8c, 8d, 9 and VSM |
| Cluster 5 | Medical and Dental staff, consultants |
| Cluster 6 | Medical and Dental staff, non-consultant career grades |
| Cluster 7 | Medical and Dental staff, trainee grades |
Notes:
- Definitions for these categories are based on Electronic Staff Record occupation codes with the exception of medical and dental staff, which are based on grade codes.
- Bank staff should be excluded from these figures (to be consistent with the WRES data collection).
- VSMs are defined as including:
- chief executives
- executive directors, with the exception of those who are eligible to be on the consultant contract by virtue of their qualification and the requirements of the post
- other senior managers with board level responsibility who report directly to the chief executive.
Non-executive directors should not be included.
Metric 2
Relative likelihood of non-disabled staff compared to Disabled staff being appointed from shortlisting across all posts.
Notes:
- This refers to both external and internal posts.
- If your organisation implements a guaranteed interview scheme, the data may not be comparable with organisations that do not operate such a scheme.
Metric 3
Relative likelihood of Disabled staff compared to non-disabled staff entering the formal capability process on the grounds of performance, as measured by entry into the formal capability procedure.
Notes:
- This metric will be based on data from a two-year rolling average of the current year and the previous year.
- This metric applies to capability on the grounds of performance only and not ill health.
NHS Staff Survey
The question or theme from the NHS Staff Survey which is used to calculate each metric is shown in brackets underneath the title.
Metric 4
(Relates to Q14a-d in the NHS Staff Survey)
Percentage of Disabled staff compared to non-disabled staff experiencing harassment, bullying or abuse from:
- Patients/Service users, their relatives or other members of the public
- Managers
- Other colleagues
- Percentage of Disabled staff compared to non-disabled staff saying that the last time they experienced harassment, bullying or abuse at work, they or a colleague reported it.
Metric 5
(Relates to Q15 in the NHS Staff Survey)
Percentage of Disabled staff compared to non-disabled staff believing that the Trust provides equal opportunities for career progression or promotion.
Metric 6
(Relates to Q11e in the NHS Staff Survey)
Percentage of Disabled staff compared to non-disabled staff saying that they have felt pressure from their manager to come to work, despite not feeling well enough to perform their duties.
Metric 7
(Relates to Q4b in the NHS Staff Survey)
Percentage of Disabled staff compared to non-disabled staff saying that they are satisfied with the extent to which their organisation values their work.
Metric 8
(Relates to Q30b in the NHS Staff Survey)
Percentage of Disabled staff saying that their employer has made reasonable adjustment(s) to enable them to carry out their work.
Note: Prior to 2022, the term “adequate adjustments” was used.
Metric 9a
(Relates to the staff engagement theme of the NHS Staff Survey, made up from Q2a, Q2b, Q2c, Q3c, Q3d, Q3f, Q23a, Q23c and Q23d in the NHS Staff Survey)
The staff engagement score for Disabled staff, compared to non-disabled staff.
Disabled staff engagement
Metric 9b
Has your Trust taken action to facilitate the voices of Disabled staff in your organisation to be heard (Yes or No)?
If yes, please provide at least one practical example of current action being taken in the relevant section of your WDES annual report.
If no, please include what action is planned to address this gap in your WDES annual report.
Board representation
For this metric, compare the difference for Disabled and non-disabled staff.
Metric 10
Percentage difference between the organisation’s board voting membership and its organisation’s overall workforce, disaggregated:
- by voting and non-voting membership of the board
- by executive and non-exec membership of the board.
6. Definitions of disability and improving disability declaration rates
6.1 The definition of disability in NHS data systems
One of the challenges in monitoring workforce disability within the NHS is that the definitions of disability used within the NHS Electronic Staff Record (ESR), NHS Staff Survey and NHS Jobs are not the same (these definitions are included in Annex C). These definitions also vary when compared to the legal definition of disability, as set out in the Equality Act 2010. Work is ongoing to align definitions of disability with the Equality Act’s definition, as well as set up cross-system, agreed disability question(s).
6.2 The importance of improving disability declaration rates
As highlighted in the 2022 WDES data analysis report, overall, 4.2% of the NHS workforce had declared a disability through the NHS Electronic Staff Record. In comparison, approximately 23.2%* of NHS Staff Survey 2021 respondents have indicated that they have a disability or long-term health condition. This equates to a gap of 19.0 percentage points between the ESR and NHS Staff Survey disability declaration rates.
*Note: Applying this proportion to the whole NHS workforce suggests there are 327,067 staff with a long-term condition or illness.
We know that more work is needed to improve the reporting of disability on ESR and the WDES Implementation Team continues to hold conversations with colleagues about what can be done to improve this. We would encourage organisations to continue to undertake analysis to compare their ESR and NHS Staff Survey declaration rates to identify the gap – both in terms of percentages as well as headcount.
Disabled people need to have confidence that providing information on their disability status will not have any negative impact on their workplace or career experiences. Guidance has been produced to support organisations in working to improve disability declaration rates.
7. The links between the WDES, WRES and the Equality Delivery System
7.1 The Workforce Race Equality Standard
The NHS Workforce Race Equality Standard (WRES), which is also mandated through the NHS Standard Contract, is designed to help NHS organisations (and other organisations providing NHS services) improve their performance in advancing race equality and working to address the inequalities experienced by Black and Ethnic Minority (BME) staff, at all levels, including board representation.
7.2 The Equality Delivery System (EDS)
The Equality Delivery System is designed to help health and social care organisations to review and improve their performance for patients, communities and staff in relation to all of the nine (9) protected characteristics outlined in the Equality Act 2010.
The WDES, WRES and the EDS are complementary but distinct. Therefore, there should not be any unnecessary duplication in the collection of data from these initiatives. The WDES metrics data and analyses will assist organisations when implementing EDS, in particular with the outcomes under Goal 3 ‘A representative and supported workforce’; and Goal 4 ‘Inclusive leadership’.
The WDES, WRES and the EDS will also assist organisations in meeting their Public Sector Equality Duty (PSED) requirements. Refer to the Equality Act 2010 and related guidance for a fuller understanding of the PSED.
8. Key considerations when implementing the WDES
8.1 Leadership and governance
Committed leadership must come from senior leaders (board members, executive team, and others in position of influence). Like the WRES and the EDS, the WDES will have maximum impact when it is embedded within mainstream business and governance structures. It is increasingly recognised that without strong leadership, work on equality, diversity and inclusion initiatives are very often short-lived, or at best, have little organisation-wide impact.
In supporting workforce disability equality, senior leaders should look to be visible in what they say and do, both within and outside of their organisations. Boards and executive teams are encouraged to get involved in developmental initiatives and leadership programmes where the emphasis is on inclusive workforces and healthcare services.
Senior leaders should confirm their own commitment to workplaces that are free from discrimination and enable Disabled staff to thrive and flourish based on their skills and talent. This is important, as the WDES may well challenge the leadership of the organisation to positively demonstrate their own commitment to disability equality and inclusion. Organisations should identify a board member to lead or promote the WDES, as they have done with the WRES.
Board-level leadership and senior leader sponsorship is essential if organisations are to meet their contractual and legal equality requirements. This should be allied with shared ownership across the organisation to manage the expectation of regulators, the aspirations of staff and the best interests of their patients.
8.2 Local accountability and engagement
As explained in this technical guidance, organisations have mandated responsibilities to collect, report and publish data and action plans – whilst the involvement of national healthcare organisations is on a voluntary basis. To achieve maximum impact, any work that an organisation undertakes to support the WDES should be done in partnership with staff and local interest groups. Opportunities to engage with key stakeholders can include:
- Disabled staff networks and similar groups;
- local trade unions and other organised staff groups;
- local community groups including Disabled People’s Organisations (DPOs) or Disabled Persons User-Led Organisations (DPULOs) and Equality Councils;
- patient voice representatives, recognising that patients will benefit from a diverse workforce.
8.3 Staff engagement
In adopting and implementing the WDES, organisations should engage with staff, staff networks (particularly Disabled staff networks), and local staff-side organisations. This engagement will provide the organisation with the opportunity to ensure that Disabled staff feel valued, included and respected for the outstanding contribution they make.
Disabled staff involvement is a fundamental part of the whole approach that underpins the WDES. It is important that Disabled staff are fully involved in the WDES implementation. The principle of engaging with and involving Disabled staff in actions and decisions is reflected in metric 9 of the WDES. A visible and inclusive leadership is vital for achieving meaningful engagement with Disabled staff.
Organisations will be more successful in their implementation of the WDES, and other equality initiatives such as the WRES and EDS, when engagement with staff, staff networks, trade unions and other staff organisations is both meaningful and sustained. In some organisations, board members already meet with Disabled staff and their representatives to hear, at first hand their experiences of the workplace.
For significant improvements to be achieved against the WDES metrics, it is essential that the voices of Disabled staff continue to be heard loud and clear. Organisations are strongly encouraged to help establish, resource and support Disabled staff networks and/or find ways of facilitating the voices of Disabled staff. Networks can provide an important source of knowledge, support and experience, and provide a platform for increasing the visibility of Disabled staff.
Organisations should provide a safe place for Disabled staff to share their experiences and be listened to in a compassionate and respected way. Providing opportunities for ongoing dialogue can contribute significantly to the overall success of the organisation’s work on equality, diversity and inclusion.
Examples of how organisations have engaged Disabled staff are detailed in the Action Plans – Good practice chapter of the annual report 2019.
Trade union organisations also have an important role to play in providing intelligence within organisations and in helping to create robust local action plans.
8.4 WDES action planning
In looking to explore the issues that most impact on Disabled staff, and identify actions to take forward in response, organisations should discuss their metrics data with staff and trade unions. Committing to engagement can help shape actions plans that improve the experience of all Disabled staff.
WDES action plans should be developed in partnership with Disabled staff, staff networks, other staff groups and trade unions. It is also beneficial to involve workforce, communications, learning and development, talent management and organisational development (OD) functions in developing and delivering actions.
8.5 Sourcing data and data sources
Organisations should first check that they have the relevant datasets and are able to extract data relating to the WDES metrics. The key datasets are:
- NHS Electronic Staff Record (ESR);
- Local data, such as Human Resources and Employee Relations databases, which will include data on recruitment activity and staff in capability proceedings, with linked information on disability. Organisations that use ESR to record employee relations data will be able to draw data from Business Intelligence reports;
- NHS Staff Survey results (the latest available).
In helping to identify whether the organisation is making positive progress, work should also be undertaken to compare the current dataset with that reported in previous years.
8.6 Reporting data for the 2023 WDES data collection
Since 2021, trust data has been collected using the online Data Collection Framework (DCF) system. Trusts will be able to use the DCF to report the metrics data and respond to qualitative questions (which help us understand the context when we analyse the metrics data).
When completing submissions, organisations are not required to submit data for WDES Metrics 4 to 9a. These metrics relate to the NHS Staff Survey and the WDES Implementation Team already has access to this data.
Organisations should include data for all 10 metrics when discussing, producing and publishing their annual report. The annual report, which should be developed in partnership with the organisation’s Disabled staff network and ratified by the Board, must contain data for all metrics along with an action plan that sets out the actions the organisation will deliver over the coming 12 months and beyond. The annual report should be published on a public-facing website.
8.7 Key dates for 2023
The key dates for the 2023 data collection are below. (The same timeframe applies to the WRES data collection for trusts, ICBs and ALBs, but there are different timescales for the Medical WRES and Bank WRES collections).
| Date | Event |
| April 2023 |
Organisations review their datasets, declaration rates and most recently published annual report. |
| 1 May 2023 |
WDES data collection period opens. |
| 31 May 2023 |
WDES data collection period closes for provider trusts. |
| 31 October 2023 |
Organisations publish their WDES 2023 annual report (which contains the metrics report) and WDES action plan on their website. |
Each board must play a full and visible part in ratifying the organisation’s WDES data and associated action plan. They should be clearly seen to hold ultimate accountability for this work.
The WDES Implementation Team will analyse the metrics data submitted by each organisation. This analysis will be used to produce the annual report.
Organisations that use the DCF will be able to generate a report that contains the metrics data and responses to the qualitative questions.
8.8 Model Health System
Organisations may be keen to benchmark their performance on the WDES against each other and seek peer support where appropriate. To help in this regard, WDES metrics data for each organisation is now available through the Model Health System (Registration to the site is required. The WDES metrics data can be accessed through the Equality, Diversity and Inclusion compartment of the website).
8.9 Confidentiality
The Data Collection Framework (DCF) is a secure system that was introduced for the WDES data collection in 2021. It is important that the colleagues working in organisations with responsibility for analysing the raw data are in roles that allows them to review confidential data. They should understand the importance of checking data for anonymity before it is shared internally or externally.
For metric 1 we would advise that organisations only publish percentages, rather than headcount figures (as that data may relate to a small number and could potentially be personally identifiable). If a organisation believes that the any of the information could be ‘personally identifiable’, they should seek local advice from colleagues with responsibility for organisational data protection compliance.
9. Guidance on sourcing and applying the metrics data
Information about each of the ten metrics, plus definitions of terms, and advice on evidence and sources to consider are given in the following set of tables. Further resources to support organisations in implementing the WDES are listed in Annex D.
Metric 1
Percentage of staff in AfC (Agenda for Change) pay bands or medical and dental subgroups and Very Senior Managers (including Executive Board members) compared with the percentage of staff in the overall workforce.
Organisations should undertake this calculation separately for non-clinical and for clinical staff.
Cluster 1: AfC Bands – Under 1, 1, 2, 3 and 4
Cluster 2: AfC Bands 5, 6 and 7
Cluster 3: AfC Bands 8a and 8b
Cluster 4: AfC Bands 8c, 8d, 9 and VSM (see note below)
Cluster 5: Medical and Dental Staff, consultants
Cluster 6: Medical and Dental Staff, non-consultant career grade
Cluster 7: Medical and dental Staff, trainee grades
Notes:
- Definitions for these categories are based on Electronic Staff Record occupation codes with the exception of medical and dental staff, which are based upon grade codes.
- Where local pay scales are in use, then for non-medical staff or TUPE staff, the equivalent basic salary level should be used to assign them to an equivalent AfC pay band.
- Bank staff should be excluded from these figures (to be consistent with the WRES data collection).
- VSMs are defined as including:
- Chief executives.
- Executive directors, with the exception of those who are eligible to be on the consultant contract by virtue of their qualification and the requirements of the post.
- Other senior managers with board level responsibility who report directly to the chief executive.
Non-executive directors should not be included.
What does metric 1 measure / compare?
This metric compares the data for Disabled and non-disabled staff, across all pay bands and grades within the organisation.
What is the source for metric 1?
Electronic Staff Record (ESR) or its equivalent. A business intelligence (BI) report is available within ESR that has been designed to help organisations with reporting the data for this metric.
What relationship does metric 1 have to the WRES?
This metric is very similar to that found within the WRES (indicator 1). The process and rationale applied to the definitions and calculations for metric 1 for the WDES should be the same as for the WRES.
Definitions in metric 1
The specific grade codes, job roles and basic salary values which are used to produce the pre-populated data can be viewed by organisations.
- The job roles will be the same for the WDES and WRES. “Bands 1-9” refers to staff paid using the national Agenda for Change (AfC) pay scales for these grades. Where local pay scales are in use, then for non-medical staff, the equivalent basic salary level may be used.
- “Medical and Dental subgroups” are staff paid using the Medical and Dental pay scales; the subgroups are identified by using the national grade codes or staff group / job roles.
“Senior Medical Manager” is defined as: a medical consultant who is either a Medical Director, a Deputy Medical Director or who reports directly to a Medical Director or Deputy Medical Director.
“Very Senior Managers (VSM)” are defined using job roles, as explained above.
The “overall workforce” refers to all directly employed staff.
Organisations should exclude all bank and locum staff, students on placement and staff employed by contractors.
Calculating metric 1
The WDES metrics data spreadsheet will calculate the clusters automatically, following input of data by the organisation.
Example of calculation for AfC Cluster 2 (Bands 5, 6 and 7):
- number of Disabled staff in AfC Cluster 2 = 50
- total number of staff in AfC Cluster 2 = 500
- percentage of Disabled staff in AfC Cluster 2 = (50/500) 10%
- number of Disabled staff in overall workforce = 1000
- total number of staff in overall workforce = 4000
- percentage of Disabled staff in overall workforce = (1000/4000) 25%.
Additional considerations
Organisations should compare the proportions of staff records containing the values “Disabled” and “non-disabled”, It may also be helpful to include additional fields such as “Unknown/Null”, and “prefer not to say” to better understand the data. Scrutiny by each cluster will help to identify where barriers to staff progression may be occurring, and to consider actions to address the barriers.
Presenting the data
A WDES action plan template, with guidance, was produced in 2020. Whilst not mandated, organisations may find these resources helpful when identifying the best way of presenting and publishing the metrics data and action plan.
Metric 2
Relative likelihood of Disabled staff compared to non-disabled staff being appointed from shortlisting across all posts.
What does metric 2 measure / compare?
This metric compares the data for non-disabled and Disabled staff in regard to the relative likelihood of being appointed. The metric includes both internal and external recruitment.
What is the source for metric 2?
Depending on local arrangements, this data can be accessed either through ESR, or another system if employed by the organisation.
What relationship does metric 2 have to the WRES?
The WRES has a similar metric that compares the relative likelihood of white applicants being appointed from shortlisting across all posts compared to BME applicants.
Definitions in metric 2
“Relative likelihood” compares the likelihood of non-disabled and Disabled staff being appointed.
“All posts” refers to all directly employed staff. Organisations should exclude all bank and locum staff, students on placement and staff employed by contractors.
“Shortlisted” refers to candidates who have been selected for interview (ie have passed the shortlisting phase).
The two pieces of data required are the number of candidates interviewed (or shortlisted), and the number of candidates who were successful in being offered the job.
Calculating metric 2
The tools supplied in order to record and submit the data will automatically calculate the relative likelihood. To manually calculate it, there are three steps:
- Likelihood of being appointed for non-disabled staff = Number of appointments of non-disabled staff / Number of shortlisted non-disabled staff
- Likelihood of being appointed for Disabled staff = Number of appointments of Disabled staff / Number of shortlisted Disabled staff
- Relative likelihood = Likelihood of being appointed for non-disabled staff / Likelihood of being appointed for Disabled staff
Notes:
- A relative likelihood of 1 indicates that there is no difference: ie non-disabled applicants are equally as likely of being appointed from shortlisting as Disabled applicants.
- A relative likelihood above 1 indicates that non-disabled applicants are more likely to be appointed from shortlisting compared to Disabled applicants: eg a likelihood ratio of 2 indicates non-disabled applicants are twice (2 times) as likely to be appointed from shortlisting as Disabled applicants.
- A relative likelihood below 1 indicates that non-disabled applicants are less likely to be appointed from shortlisting compared to Disabled applicants: eg a likelihood ratio of 0.5 indicates non-disabled applicants are half (0.5 times) as likely to be appointed from shortlisting as Disabled applicants.
Example of calculation:
- Number of shortlisted applicants: non-disabled = 780; Disabled = 210
- Number appointed from shortlisting: non-disabled = 170; Disabled = 30
- Likelihood of shortlisting/appointed: non-disabled = 0.22; Disabled = 0.14
- Relative likelihood of non-disabled staff being appointed from shortlisting compared to Disabled staff (0.22/0.14) is therefore 1.57 times greater.
- A figure below 1.00 indicates that Disabled candidates are more likely to be appointed from shortlisting.
Guaranteed Interview Schemes: What are they?
Any organisation that wishes to have Disability Confident accreditation must guarantee the offer of an interview to a Disabled applicant, as long as that individual meets the minimum criteria (for example, sometimes shown as desirable skills) for a job as defined by the employer.
Additional considerations
Organisations should consider whether there are significant differences between professions or departments. They may also want to look at relative likelihood of Disabled and non-disabled staff being shortlisted from application for both internal and external recruitment campaigns, including “executive search agencies”.
Organisations should consider all the informal advantages some staff may have accrued over others through non-mandatory training and opportunities for acting up, leading projects, mentoring and shadowing. It is also important to ensure that staff who oversee shortlisting and interview processes are appropriately trained, including in the impact of “unconscious bias”.
Organisations should also review recruitment processes for posts at all levels including senior management and board level appointments, ensuring that there is a system for ensuring that a robust process for implementing reasonable adjustments is in place in recruitment processes as well as in employment.
Presenting the data
This metric is a relative likelihood calculation, therefore there will be just one figure (ie 2.5). It is worth including further explanation – for example ‘times greater’ or ‘times lower’ where relevant.
- A relative likelihood of 1 indicates that there is no difference: ie non-disabled applicants are equally as likely of being appointed from shortlisting as Disabled applicants.
- A relative likelihood above 1 indicates that non-disabled applicants are more likely to be appointed from shortlisting compared to Disabled applicants: eg a likelihood ratio of 2 indicates non-disabled applicants are twice (2 times) as likely to be appointed from shortlisting as Disabled applicants.
- A relative likelihood below 1 indicates that non-disabled applicants are less likely to be appointed from shortlisting compared to Disabled applicants: eg a likelihood ratio of 0.5 indicates non-disabled applicants are half (0.5 times) as likely to be appointed from shortlisting as Disabled applicants.
Metric 3
Relative likelihood of Disabled staff compared to non-disabled staff entering the formal capability process, as measured by entry into the formal capability procedure.
What does metric 3 measure / compare?
This metric compares the data for Disabled and non-disabled staff in regard to the relative likelihood of entering the formal capability process. The calculation uses the number of staff going through a capability process for performance management. We ask that organisations report the total number of staff going through the capability process for any reason, and of these how many are for ill health related reasons only in order to explicitly remove these from the calculation. If ill health related issues are dealt with using a separate policy, zero values may be entered for the ill health data.
What is the source for metric 3?
The source for this metric will be where formal capability data is held – this could be from Electronic Staff Record (ESR), or local HR employee relations/ workforce datasets. The field for ‘disability’ may need to be added to the dataset to enable the organisation to report data for this metric.
What relationship does metric 3 have to the WRES?
Whilst this metric is unique to the WDES, the WRES has a similar indicator that focuses on BME staff entering the disciplinary process.
Definitions in metric 3
We recognise that ‘capability’ may be interpreted in different ways across organisations and may sit in a range of policies; some organisations include capability in performance management or other relevant absence policies.
Only staff who enter the formal capability procedure on the grounds of performance, as set out in the organisation’s performance management or equivalent policy, should be included in the calculation. Investigations revealed a number of organisations also included staff entering the formal capability policy on the groups of sickness absence, even though these staff should have been excluded from the calculation. To remove this misunderstanding, both the total number of people entering the formal capability process, and the number entering on grounds of sickness absence alone, are now required.
Any informal capability action should not be included in this definition. Organisations should only count new entries into a formal process.
Calculating metric 3
The tools supplied in order to record and submit the data will automatically calculate the relative likelihood. To manually calculate it, there are three steps:
- Likelihood of entering capability for Disabled staff = Number of Disabled staff entering capability / Total number of Disabled staff
- Likelihood of entering capability for non-disabled staff = Number of non-disabled staff entering capability / Total number of non-disabled staff
- Relative likelihood = Likelihood of entering capability for Disabled staff / Likelihood of entering capability for non-disabled staff
- A relative likelihood of 1 indicates that there is no difference, i.e. Disabled staff are equally as likely as non-disabled staff to enter formal capability processes.
- A relative likelihood above 1 indicates that Disabled staff are more likely to enter formal capability processes than non-disabled staff: e.g. a likelihood ratio of 2 indicates that Disabled staff are twice (2 times) as likely to enter a formal capability process compared to non-disabled staff.
- A relative likelihood below 1 indicates that Disabled staff are less likely to enter formal capability processes compared to non-disabled staff: e.g. a likelihood ratio of 0.5 indicates Disabled staff are half (0.5 times) as likely to enter a formal capability process compared to non-disabled staff.
Example of calculation:
- Number of staff in workforce: Disabled = 200; non-disabled = 800
- Total number of staff entering the formal capability process: Disabled = 25; non-disabled = 40
- Number of staff entering the formal capability process for ill health related reasons: Disabled = 5; non-disabled = 10
- Number of staff entering the formal capability process for performance management issues only: Disabled = 25 – 5 = 20; non-disabled = 40 – 10 = 30
- Likelihood of Disabled staff entering the formal capability process (20/200) = 0.1000
- Likelihood of non-disabled staff entering the formal capability process (30/800) = 0.0375
- Relative likelihood of Disabled staff entering the formal capability process compared to non-disabled staff is therefore 0.1000/0.0375 = 2.66 times greater.
A figure above ‘1’ indicates that Disabled staff members are more likely than non-disabled staff to enter the formal capability process.
Additional considerations
A staff member could enter capability procedures either on the basis of performance or on the basis of ill health (sickness related absence). The calculation for this metric should only include data on the basis of performance, not ill health.
To reduce any higher likelihood of Disabled staff being in capability procedures, organisations should review their performance management policy, and/or their reasonable adjustment policy, to ensure that Disabled staff have appropriate and timely reasonable adjustments in place. Discussion with Disabled staff and networks may also be useful in identifying any root causes to higher likelihoods, and what interventions can be taken to reduce this.
Presenting the data
This metric is a relative likelihood, and therefore there will be just one figure (ie 2.5). It is worth including further explanation – for example ‘times greater’ or ‘times lower’ where relevant.
Metric 4
Percentage of Disabled staff compared to non-disabled staff experiencing harassment, bullying or abuse from:
- patients/service users, their relatives or other members of the public
- managers
- other colleagues
- percentage of Disabled staff compared to non-disabled staff saying that the last time they experienced harassment, bullying or abuse at work, they or a colleague reported it.
What does metric 4 measure / compare?
This metric compares the responses for Disabled and non-disabled staff.
What is the source for metric 4?
The WDES metric is based on data drawn from all 4 elements (a-d) of the NHS staff survey, Question 13.
What relationship does metric 4 have to the WRES?
The WRES includes indicators relating to bullying, harassment or abuse from staff and patients.
Calculating metric 4
Trusts and ICBs do not need to report data for this metric as it can be sourced directly from the NHS Staff Survey team. However, the data should be discussed internally, including with the board and Disabled staff network, and included within the organisation’s annual report.
Additional considerations
Organisations will want to compare their NHS Staff Survey responses against appropriate workforce data (eg recorded harassment, bullying or abuse from managers, colleagues or patients, relatives or the public in the last 12 months) and understand any discrepancies.
There should also be a focus on increasing both the NHS Staff Survey sample size and response rate, particularly from Disabled staff.
Metric 5
Percentage of Disabled staff compared to non-disabled staff believing that the organisation provides equal opportunities for career progression or promotion.
What does metric 5 measure / compare?
This metric compares the responses for Disabled and non-disabled staff.
What is the source for metric 5?
The data for this metric is drawn from the NHS Staff Survey, Question 15.
What relationship does metric 5 have to the WRES?
This metric is the same as WRES Indicator 7.
Calculating metric 5
Trusts and ICBs do not need to report data for this metric as it can be sourced directly from the NHS Staff Survey team. However, the data should be discussed internally, including with the board and Disabled staff network, and included within the organisation’s annual report.
Additional considerations
There should also be a focus on increasing both NHS Staff Survey sample size and response rate, particularly from Disabled staff.
Metric 6
Percentage of Disabled staff compared to non-disabled staff saying that they have felt pressure from their manager to come to work, despite not feeling well enough to perform their duties.
What does metric 6 measure / compare?
This metric compares the responses for Disabled and non-disabled staff.
What is the source for metric 6?
The data for this metric is drawn from the NHS Staff Survey, Question 11e.
What relationship does metric 6 have to the WRES?
This metric is unique to the WDES.
Calculating metric 6
Trusts and ICBs do not need to report data for this metric as it can be sourced directly from the NHS Staff Survey team. However, the data should be discussed internally, including with the board and Disabled staff network, and included within the organisation’s annual report.
Additional considerations
There should be a focus on increasing both NHS Staff Survey sample size and response rate, particularly from Disabled staff.
Metric 7
Percentage of Disabled staff compared to non-disabled staff saying that they are satisfied with the extent to which their organisation values their work.
What does metric 7 measure / compare?
This metric compares the responses for Disabled and non-disabled staff.
What is the source for metric 7?
The data for this metric is drawn from the NHS Staff Survey, Question 4b.
What relationship does metric 7 have to the WRES?
This metric is unique to the WDES.
Calculating metric 7
Trusts and ICBs do not need to report data for this metric as it can be sourced directly from the NHS Staff Survey team. However, the data should be discussed internally, including with the board and Disabled staff network, and included within the organisation’s annual report.
Additional considerations
There should be a focus on increasing both NHS Staff Survey sample size and response rate, particularly from Disabled staff.
Metric 8
Percentage of Disabled staff saying that their employer has made adequate adjustment(s) to enable them to carry out their work.
What does metric 8 measure / compare?
This metric only includes the responses of Disabled staff.
What is the source for metric 8?
The data for this metric is drawn from the NHS Staff Survey, Question 28b. The NHS Staff Survey uses the term ‘adequate’, so we use this term within this metric. However, we recognise that ‘reasonable’ or ‘workplace’ adjustments are more commonly used terms.
What relationship does metric 8 have to the WRES?
This metric is unique to the WDES.
Calculating metric 8
Trusts and ICBs do not need to report data for this metric as it can be sourced directly from the NHS Staff Survey team. However, the data should be discussed internally, including with the board and Disabled staff network, and included within the organisation’s annual report.
Additional considerations
There should be a focus on increasing both NHS Staff Survey sample size and response rate, particularly from Disabled staff.
Metric 9
- The staff engagement score for Disabled staff, compared to non-disabled staff.
- Has your Organisation taken action to facilitate the voices of Disabled staff in your organisation to be heard (yes or no)?
Note: For your Organisation’s response to b)
If yes, please provide at least one practical example of current action being taken in the relevant section of your annual report. If no, please include what action is planned to address this gap in your annual report.
What does metric 9 measure / compare?
Part a)
This part of the metric compares the organisation’ staff engagement score for Disabled staff and non-disabled staff.
Part b)
Part b of this metric asks for evidence that the organisation has taken action to facilitate the voices of Disabled staff.
What is the source for metric 9?
Part a)
The staff engagement theme score is a composite score, drawn from 9 individual questions in the NHS Staff Survey (Q2a, Q2b, Q2c, Q3c, Q3d, Q3f, Q23a, Q23c and Q23d). For further information about the staff engagement score, see Annex B of this technical guidance.
Part b)
The information for this part of the metric will be sourced from the organisation’ own actions.
What relationship does metric 9 have to the WRES?
This metric is unique to the WDES.
Calculating metric 9
Part a)
Trusts and ICBs do not need to report data for this metric as it can be sourced directly from the NHS Staff Survey team. However, the data should be discussed internally, including with the board and Disabled staff network, and included within the organisation’s annual report.
Part b)
The responses should be included in the organisation’s annual report.
Additional considerations
Part a)
There should be a focus on increasing both NHS Staff Survey sample size and response rate, particularly from Disabled staff. The staff engagement score should be discussed with Disabled colleagues and staff network.
Part b)
Refer to the previous WDES data analysis reports for examples of engagement with Disabled colleagues and networks.
Metric 10
Percentage difference between the organisation’s board membership and its organisation’s overall workforce, disaggregated:
- by voting and non-voting membership of the board
- by executive and non-exec membership of the board.
What does metric 10 measure / compare?
This metric compares the responses for Disabled and non-disabled staff.
What is the source for metric 10?
The data for this metric is drawn from the NHS Electronic Staff Record (ESR).
Definitions in metric 10
“Board” membership in this context includes all members of the board irrespective of whether they are executive or non-executive members and whether they are voting or non-voting members of the board who may have been co-opted.
“Voting” membership of the board are usually the executive board members employed by the organisation. “Non-executive” members are generally not voting members of the board.
“Executive membership” is an employee of the organisation and sits on an organisation’s board of directors and advises current organisational management on specific operations, eg Medical Director or Finance Director, as opposed to a non-executive director who is a member of the board of directors of the organisation and does not form part of the executive management team. Non-executive directors are not employees of the organisation or affiliated with it in any other way.
ESR enables reporting on board members (executive and non-executive) if the appropriate ‘Job Roles’ have been applied. This will enable comparison to be made against the organisation’ workforce and the population being served. ‘Job Roles’ include Chair, Chief Executive, Finance Director, Other Executive Directors, Board Level Directors, Non-Executive Directors, Medical Director, Nursing Director.
What relationship does metric 10 have to the WRES?
WRES Indicator 9 focuses on board membership.
Calculating metric 10
Example of calculation:
The organisation has 5% Disabled workforce and 1 of its 8, ie 12.5%, voting members on the board has a declared disability. The percentage difference between the organisations’ board voting membership and its overall workforce will be +7.5 percentage points.
Additional considerations
The percentage figures for Disabled and non-disabled staff will have been calculated in metric 1.
Note:
- Foundation Trusts may also want to consider the disability status of governors, and whether they are broadly representative of the local population.
- Organisations should ensure that their executive search agencies are committed to diversity in their policies and processes.
- Organisations should plan for and promote equity for future applicants for all board positions from diverse backgrounds.
10. Annex A: Key terms
| WDES Data Collection Framework (DCF) | The online system introduced in 2021 for the WDES data collection. |
| Annual report | Organisations are asked (mandated for trusts) to publish this report, on an annual basis, by 31 October. The report must contain the organisation’s metrics data, action plan and evidence for Metric 9b. |
11. Annex B: How the NHS Staff Survey staff engagement score is calculated
The staff engagement score is a composite score calculated using the responses to nine individual questions:
Q2a. “I look forward to going to work.”
Q2b. “I am enthusiastic about my job.”
Q2c. “Time passes quickly when I am working.”
Q3c. “There are frequent opportunities for me to show initiative in my role.”
Q3d. “I am able to make suggestions to improve the work of my team / department.”
Q3f. “I am able to make improvements happen in my area of work.”
Q23a. “Care of patients / service users is my organisation’s top priority.”
Q23c. “I would recommend my organisation as a place to work.”
Q23d. “If a friend or relative needed treatment I would be happy with the standard of care provided by this organisation.”
Responses for all questions contributing to the themes are rescored to achieve a scale of 0-10. Table 1 details the scores allocated to each response option.
Table 1. Theme = Staff engagement
|
2021 |
Score for response option 1 |
Score for response option 2 |
Score for response option 3 |
Score for response option 4 |
Score for response option 5 |
|
Q2a |
0 |
2.5 |
5 |
7.5 |
10 |
|
Q2b |
0 |
2.5 |
5 |
7.5 |
10 |
|
Q2c |
0 |
2.5 |
5 |
7.5 |
10 |
|
Q3c |
0 |
2.5 |
5 |
7.5 |
10 |
|
Q3d |
0 |
2.5 |
5 |
7.5 |
10 |
|
Q3f |
0 |
2.5 |
5 |
7.5 |
10 |
|
Q23a |
0 |
2.5 |
5 |
7.5 |
10 |
|
Q23c |
0 |
2.5 |
5 |
7.5 |
10 |
|
Q23d |
0 |
2.5 |
5 |
7.5 |
10 |
The theme score is calculated based on 3 separate sub-scales, where all participants who get a score for at least 2/3 of the sub-scales get a staff engagement score, which is the mean of the sub-scale scores.
The sub-scales are:
- motivation (Q2a, Q2b, Q2c)
- ability to contribute to improvements (Q3c, Q3d, Q3f)
- recommendation of the organisation as a place to work/receive treatment (Q23a, Q23c, Q23d).
Participants need to reply to at least 2/3 of the questions in a sub-scale to get a score for it. The sub-scale scores are the mean of their contributing rescored questions.
12. Annex C: Definitions of disability – the Equality Act 2010, the NHS Staff Survey, NHS Jobs and ESR Self-Service
Equality Act 2010 – Legal definition of disability
A person (P) has a disability if—
(a) P has a physical or mental impairment, and
(b) the impairment has a substantial and long-term adverse effect on P’s ability to carry out normal day-to-day activities.
NHS Staff Survey disability monitoring question
Q28a. Do you have any physical or mental health conditions or illnesses lasting or expected to last for 12 months or more?
If YES, please answer part b below; if NO, go to Question 29
Q28b. Has your employer made adequate adjustment(s) to enable you to carry out your work?
1 Yes
2 No
3 No adjustment required
NHS Jobs disability monitoring question
The Equality Act 2010 protects Disabled people – including those with long term health conditions, learning disabilities and so called “hidden” disabilities such as dyslexia.
If you tell us that you have a disability, we can make reasonable adjustments to ensure that any selection processes – including the interview – are fair and equitable.
* Do you consider yourself to have a disability?
- Yes
- No
- I do not wish to disclose this information.
Please state the type of impairment which applies to you. People may experience more than one type of impairment, in which case you may indicate more than one. If none of the categories apply, please mark ‘other’.
- Physical impairment
- Learning Disability/Difficulty
- Sensory impairment
- Long-standing illness
- Mental health condition
- Other
If you have a disability, do you wish to be considered under the guaranteed interview scheme if you meet the minimum criteria as specified in the person specification?
- Yes
- No
Disability monitoring information entered via NHS Jobs will be automatically transferred where organisations are utilising the recruitment interface.
An increasing number of organisations are providing staff with access to the ESR self-service portal, which enables individuals to add or amend their personal disability information. This function can be accessed via the following route:
ESR Portal > My ESR Dashboard > My Personal Information > Disability Information
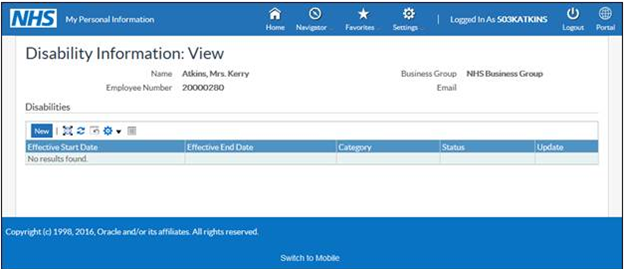
Image description:
A screenshot of ESR displaying the Disability Information: View page.
The disability categories below are available for selection in ESR:
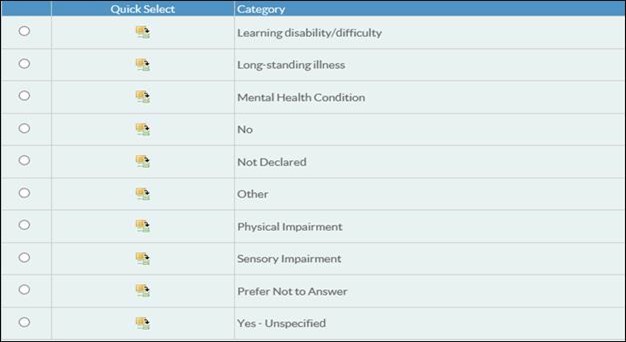
Image description:
Disability categories on ESR are:
- Learning disability/difficulty
- Long-standing illness
- Mental Health Condition
- No
- Not Declared
- Other
- Physical Impairment
- Sensory Impairment
- Prefer Not to Answer
- Yes – Unspecified
13. Annex D: Additional references, tools and resources
WDES resources
A range of resources have been produced to support organisations in implementing the WDES. These resources are available at NHS England, NHS Employers and FutureNHS (log in required).
Further reading
The tools resources listed below are useful to consider in building an understanding of the context about workforce disability equality and supporting the experiences of Disabled staff. To help with navigation they have been structured in line with the WDES metrics.
WDES Metric 1 – Workforce representation
- House of Commons Library (2021) Disabled people in employment.
- Department for Work and Pensions (2022) Guidance on employing Disabled people and people with health conditions.
- NHS Employers (2020) A guide to improving staff disability data.
WDES Metric 2 – Recruitment shortlisting
- NHS England and NHS Employers. WDES webinar: Recruiting and retaining Disabled staff – line manager responsibilities.
- Disability Confident (2014) Guidance and resources about employing disabled people.
WDES Metric 3 – Capability
WDES Metric 4 – Harassment, bullying and abuse
- NHS England (2020) NHS Civility and Respect Toolkit and Guide to managing with kindness, civility and respect.
- Social Partnership Forum (2019) have published information on creating a culture of civility, compassion and respect. This includes resources on actions to reduce harassment, bullying and abuse.
- NHS Employers have published an infographic tackling bullying in the NHS (2022) and further guidance and information on workplace bullying (2019) in partnership with NHS Staff Council’s Health Safety and Wellbeing Partnership Group.
WDES Metric 5 – Career promotion and progression
- Health Education England have published information and resources on the Health Careers website that may be useful to read in regard to supporting Disabled people work for the NHS careers, including answering “Can I train to be a doctor if I have a disability?“
WDES Metric 6 – Presenteeism
- NHS Employers have produced information about disability leave and the main differences compared to disability-related sickness absence. The information highlights the benefits of having a disability leave policy and shares good practice examples from other organisations, along with links to resources providing further support.
WDES Metric 7 – Valuing Disabled staff
WDES Metric 8 – Reasonable adjustments
- NHS Employers (2020) Information on reasonable adjustments in the workplace.
- Equality and Human Rights Commission (2019) Employing people: workplace adjustments.
WDES Metric 9 – Disabled staff engagement
- NHS Employers. Online guidance about staff networks.
- PurpleSpace – PurpleSpace is the world’s only networking and professional development hub for Disabled employees, network and resource group leaders and allies.
WDES Metric 10 – Board representation
14. Annex E: Support and queries
For resources, information and queries relating to the WDES, please contact the WDES Implementation Team:
Email – england.wdes@nhs.net
WDES Data Collection helpdesk email address – england.wdes-datahelpdesk@nhs.net (this email address is for data collection queries only).
Webpage – https://www.england.nhs.uk/about/equality/equality-hub/wdes/