
Foreword
As well as delivering high quality healthcare for millions, the NHS also provides employment for more than a million people in some of the most valued, varied and skilled roles in the country.
We have recently witnessed two landmark moments in the 75-year history of the NHS. The publishing of the NHS Long Term Workforce Plan is the first time the government has asked the NHS to produce a comprehensive workforce plan; a once-in-a-generation opportunity to put staffing on a sustainable footing and improve patient care. Meanwhile the NHS Equality, Diversity and Inclusion (EDI) Improvement Plan recognises that the NHS is more diverse than it has ever been. The plan sets out six high impact actions, to ensure our staff work in an environment where they feel they belong, can safely raise concerns and provide the best possible care to our patients.
As NHS Staff Survey data shows, nearly 1 in 4 members of our NHS workforce has lived experience of a disability or long-term condition. If we are to achieve the ambitions set out in the NHS Long Term Workforce Plan – to improve training and retention and deliver new ways of working – we must also do so through a disability-inclusive lens. The NHS EDI Improvement Plan sets out actions and interventions that NHS organisations can adopt as they work to build workplaces that enable our staff to thrive.
The vast lived experience of disability within the NHS workforce is captured in this 2023 report on the Workforce Disability Equality Standard (WDES), which remains the UK’s only mandated standard on the working lives of disabled staff. The WDES metrics data continues to help us keep our minds targeted on where we can prioritise actions to improve current performance.
Thanks to a maturing body of evidence, the WDES offers a rich and thought-provoking exploration of how the NHS, as an employer, can best care for and protect colleagues across the broad spectrum of disability.
I am particularly pleased to note that there has been a further improvement in the WDES metric on workforce representation. The proportion of staff whose disability status is ‘unknown’ has reduced to its lowest recorded level. This is a measurement of the work that trusts have delivered to reduce barriers and create inclusive workplaces; with more staff feeling confident to share information about their disabilities.
I also welcome the further improvements in the representation of disabled people on boards, which brings greater diversity in lived experiences into senior decision-making and benefits both the workforce and our patients.
We remain committed to reducing the disparities that disabled staff experience and to improving the talent pipeline for disabled NHS staff.
Dr Navina Evans CBE, Chief Workforce, Training and Education Officer, NHS England
Key findings
Workforce representation
4.9% of the workforce declared a disability through the NHS electronic staff record (ESR) in 2023, an increase of 0.7 percentage points since 2022. The number of people declaring a long-term condition or illness anonymously in the NHS Staff Survey has also increased, from 22.4% in 2021 to 23.4% in 2022.
Capability
The relative likelihood of a disabled colleague being in capability is 2.17. This means that disabled staff are more than twice as likely to be in the capability process on the grounds of performance.
Career progression
52.1% of disabled staff believed they had equal opportunities for career progression or promotion. This is an increase from 51.3% in 2022.
Feeling valued
35.2% of disabled staff reported that they felt valued for their contribution.
Staff engagement
The staff engagement score for disabled staff was 6.4, the third consecutive year it has fallen. 100% of trusts said that they had facilitated the voices of disabled staff to be heard.
Recruitment
The relative likelihood of a disabled job applicant being appointed through shortlisting has improved from 1.18 in 2019 to 0.99 in 2022. This national average suggests disabled and non-disabled applicants are equally likely to be recruited, but experience varies at trust level.
Harassment, bullying or abuse
33.2% of disabled staff reported having experienced bullying, harassment or abuse from patients, service users or the public, 16.1% from managers and 24.8% from other colleagues.
Presenteeism
27.7% of disabled staff experienced presenteeism. We continue to observe steady improvements in this metric since 2020.
Workplace adjustments
73.4% of disabled staff reported they had the reasonable adjustment(s) required to perform their duties.
Board representation
5.7% of board members declared a disability through ESR in 2023, an increase of 1.1 percentage points since 2022.
Overview of metrics
Statement of metrics
The results for the 10 Workforce Disability Equality Standard (WDES) metrics are shown in Table 1 and Table 2. For some metrics, an upwards trajectory is positive (an improvement), while for others it represents a negative impact. For example, the upwards trend for metric 1 is an improvement, while for metric 3 it represents a worsening position.
Table 1: WDES metrics based on 2023 electronic staff record (ESR [1]) and human resources/recruitment databases (5-year trends)
|
Metric |
Label |
2019 |
2020 |
2021 |
2022 |
2023 | 5-year trend |
|
1 |
Declaration rate |
3.1% |
3.4% |
3.7% |
4.2% |
4.9% | Green |
|
2 |
Recruitment |
1.18 |
1.20 |
1.11 |
1.09 |
0.99 | Green |
|
3 |
Capability |
1.53 |
1.94 |
2.01 |
2.17 | Red | |
|
9b |
Disabled voices |
85.0% |
92.8% |
97.2% |
99.5% |
100.0% | Green |
|
10 |
Board membership |
2.0% |
3.0% |
3.7% |
4.6% |
5.7% | Green |
[1] ESR is the system used to record HR data in the NHS.
Table 2: WDES metrics based on 2022 NHS Staff Survey data (5-year trends)
|
Metric |
Label |
Category |
2018 |
2019 |
2020 |
2021 |
2022 | |
|
4a |
Harassment, bullying or abuse by patients/public |
Disabled |
34.1% |
34.2% |
31.9% |
33.0% |
33.2% | |
|
Non-disabled |
27.1% |
27.4% |
25.5% |
25.7% |
26.0% | |||
|
Difference |
7.0% |
6.8% |
6.4% |
7.3% |
7.2% | |||
|
4b |
Harassment, bullying or abuse by manager |
Disabled |
19.4% |
18.5% |
18.5% |
17.0% |
16.1% | |
|
Non-disabled |
11.5% |
10.8% |
10.6% |
9.6% |
9.2% | |||
|
Difference |
7.9% |
7.8% |
7.9% |
7.4% |
6.9% | |||
|
4c |
Harassment, bullying or abuse by colleagues |
Disabled |
26.4% |
26.3% |
25.6% |
25.0% |
24.8% | |
|
Non-disabled |
17.2% |
17.3% |
16.7% |
16.4% |
16.5% | |||
|
Difference |
9.2% |
9.0% |
8.8% |
8.6% |
8.3% | |||
|
4d |
Reporting of harassment, bullying or abuse |
Disabled |
48.2% |
49.7% |
49.8% |
49.9% |
51.3% | |
|
Non-disabled |
47.3% |
48.5% |
48.2% |
48.6% |
49.5% | |||
|
Difference |
0.8% |
1.2% |
1.6% |
1.2% |
1.8% | |||
|
5 |
Career development |
Disabled |
50.9% |
51.9% |
51.5% |
51.3% |
52.1% | |
|
Non-disabled |
57.6% |
57.9% |
57.7% |
57.2% |
57.7% | |||
|
Difference |
-6.7% |
-6.1% |
-6.1% |
-5.9% |
-5.6% | |||
|
6 |
Presenteeism |
Disabled |
32.1% |
30.6% |
31.1% |
29.9% |
27.7% | |
|
Non-disabled |
22.4% |
21.2% |
22.9% |
22.1% |
19.9% | |||
|
Difference |
9.6% |
9.4% |
8.2% |
7.9% |
7.8% | |||
|
7 |
Feeling valued |
Disabled |
37.3% |
39.1% |
39.4% |
35.1% |
35.2% | |
|
Non-disabled |
48.5% |
50.4% |
50.7% |
44.9% |
45.0% | |||
|
Difference |
-11.2% |
-11.3% |
-11.3% |
-9.8% |
-9.8% | |||
|
8 |
Workplace adjustments |
Disabled |
73.3% |
73.8% |
76.6% |
72.2% |
73.4% | |
|
9a |
Staff engagement |
Disabled |
6.6 |
6.6 |
6.7 |
6.5 |
6.4 | |
|
Non-disabled |
7.1 |
7.1 |
7.2 |
7.0 |
6.9 | |||
|
Difference |
-0.5 |
-0.5 |
-0.5 |
-0.5 |
-0.5 |
Sources of data
The metrics are derived from 2 data sources:
- Data provided directly by trusts. This data was collected in May 2023. As part of the NHS Standard Contract, trusts are mandated to provide data for metrics 1, 2, 3, 9b and 10. Data has been collected in this way for 5 years, creating consistency and allowing trends to be identified. In addition to submitting quantitative data, NHS organisations supply qualitative information that provides valuable context and insight into actions taken to improve equity for disabled staff. The online system used to the collect this data is called the Data collection framework (DCF).
- Data from the NHS Staff Survey. Every trust is required to participate in the annual NHS Staff Survey. Data from the relevant questions is used to calculate metrics 4, 5, 6, 7, 8 and 9a. Except for metric 8, the survey questions providing this data have been consistent since 2017 allowing a 5-year trend to be reported. For metric 8, the Staff Survey question up until 2021 used the term “adequate adjustments”: in 2022, this was changed to “reasonable adjustments”. The results up until 2021 are shown with a different background to identify this change in definition. The NHS Staff Survey is titled by the year in which the data was collected. Data from latest survey is available at the time of writing (2022) is used in this report.
This report provides analysis and insights into the quantitative and qualitative data collected from trusts and the NHS Staff Survey. The insights inform us about specific actions taken by organisations to improve their disability equality that appear to have a positive impact.
Workforce Disability Equality Standard (WDES) metrics analysis
Metric 1 – Workforce representation
Definition: Percentage of disabled staff in Agenda for Change (AfC [2]) bands 1 to 9, very senior manager (VSM) (including executive board members), medical/dental and other staff, compared with the percentage of non-disabled staff in these categories.
[2] AfC is the pay structure that covers clinical and non-clinical staff. It does not apply to medical or dental staff. Band 1 is the lowest band (although some data has been collected for staff on less than Band 1 rates, such as staff on apprenticeships) and band 9 is the highest on the main scale, with VSM and ESM bands higher still.
Headline: Overall declaration has increased from 3.1% in 2019 to 4.9% in 2023
Table 3: Percentage disability declaration rates 2023
|
Total |
Non-clinical |
Clinical |
Medical/dental | |
|
Disabled |
4.9% |
5.8% |
5.0% |
2.2% |
|
Non-disabled |
78.4% |
77.8% |
79.1% |
75.2% |
|
Unknown |
16.6% |
16.4% |
15.9% |
22.6% |
The NHS Equality, Diversity and Inclusion (EDI) Improvement Plan and the NHS Long Term Workforce Plan make clear that we must continue to create workplace cultures that enable and empower staff to share information about their disabilities and long-term conditions.
Summary insight from data collection
- as of 31 March 2023, 70,866 (4.9%) staff declared a disability on electronic staff record (ESR), an increase of 19.9% from 2022. However, this is significantly lower than the 142,730 (23.4%) of staff who reported a long-term illness or condition through the 2022 NHS Staff Survey. Reporting on the NHS Staff Survey is more reflective of the UK population working-age population, where 23% have identified as disabled through HM Government Family Resources Survey (2021/22)
- at trust level, disability declaration rates vary from 2.2% to 13.7%
- the disability declaration category ‘unknown’, encompassing ‘prefer not to answer’, ‘not declared’ and ‘unspecified’, has reduced from 25.4% in 2019 to 16.6% in 2023
- only 1 trust has an ‘unknown’ rate of over 50% in 2023 (compared to 9 trusts in 2019)
- Declaration rates among medical/dental staff remain particularly low in some trusts, especially among trainees. 32 trusts have an ‘unknown’ rate of over 50% for this staff group, with 1 at 100%. Conversely, 50 trusts have an ‘unknown’ rate for medical/dental trainees of less than 5%
- the best performing trust in terms of ‘unknown’ declarations has a rate of 1.8%: 10 trusts have an ‘unknown’ declaration rate of less than 5%
- disability declaration rates for senior staff [3] are 2.2% in 2023, compared to 1.8% in 2022. The declaration rates are lower for senior staff than for other pay bands:
- in 2023, the disability declaration rate for AfC band 8c and above was 3.9%, compared to 5.2% for AfC bands below 8c
- in 2023, the disability declaration rate for consultants was 1.5%, compared to 2.8% for other medical/dental staff groups
- 21 trusts (a reduction from 63 in 2019) have no staff with a declared disability in AfC band 8c or above
- 4 trusts have no staff with a declared disability in any senior position (a reduction from 24 in 2019)
- the trust type with the lowest disability declaration rate is acute (4.2%): the highest is mental health (7.4%)
- for the NHS to have a representative workforce it is helpful to look at the prevalence of disability in the general population in each region (as recorded in the Family Resources Survey)
[3] Staff at band 8c or above if on the AfC pay scale, or consultants on medical/dental pay scales, or board members.
Table 4: Disability prevalence by region
|
Disability declaration rate on ESR |
Declaration rate from Staff Survey [4] |
Population prevalence of disability (all ages) | |
|
North West |
4.9% |
25.1% |
28% |
|
North East and Yorkshire |
5.1% |
26.1% |
27% |
|
East of England |
4.6% |
24.3% |
24% |
|
Midlands |
5.1% |
24.6% |
27% |
|
London |
4.4% |
18.1% |
17% |
|
South West |
4.6% |
24.3% |
24% |
|
South East |
5.5% |
22.6% |
21% |
[4] The terminology used in the NHS Staff Survey is “any physical or mental health conditions or illnesses lasting or expected to last for 12 months or more”.
We observed that the top performing trusts for this metric developed specific work programmes. This included:
- running specific and targeted ESR events and campaigns
- raising awareness of disability in the workplace through multi-channel lived experience presentations
- promoting and developing disability specific policies, for example disability leave and reasonable adjustments
- organising line manager pan-disability awareness training
- introducing retention initiatives.
A further increase by 1.0 percentage point would result in an additional 14,381 staff declaring a disability across England.
Metric 2 – Recruitment
Definition: Relative likelihood of disabled applicants being appointed from shortlisting compared to non-disabled applicants.
Headline: On average across trusts in England, the chance of a disabled candidate being appointed is not statistically significantly different [5] from that for a non-disabled candidate
[5] Using the four-fifths rule. See further supplementary information in Appendix 1.
Table 5: Relative likelihood of disabled applicants being appointed from shortlisting compared to non-disabled applicants
|
2019 |
2020 |
2021 |
2022 |
2023 |
|
1.18 |
1.20 |
1.11 |
1.08 |
0.99 |
Summary insight from data collection
- the relative likelihood of appointment for disabled people has improved from 1.18 in 2019 to 0.99 in 2023 – a situation where disabled applicants are slightly favoured over non-disabled applicants on average. A figure of 1.0 represents equity of opportunity
- no findings are statistically significant when the data is split by trust type or size, region, or any other factor
- relative likelihoods vary between trusts from 0.26 (disabled interviewees are 3.8 times more likely to be appointed than non-disabled interviewees) to 5.15 (non-disabled interviewees are 5 times more likely to be appointed than disabled interviewees)
Trusts that statistically favour non-disabled applicants (relative likelihood of over 1.25) have a lower disability declaration rate than other trusts.
Table 6: Trusts with statistically significant adverse recruitment for disabled staff
|
2019 |
2020 |
2021 |
2022 |
2023 | ||
|
Trusts that statistically favour non-disabled applicants |
Number |
123 |
103 |
86 |
60 |
54 |
|
Disability declaration rate |
2.9% |
3.3% |
3.5% |
3.8% |
4.2% | |
|
All other trusts |
Number |
104 |
119 |
131 |
153 |
158 |
|
Disability declaration rate |
3.3% |
3.6% |
3.9% |
4.4% |
5.2% |
While the statistical test suggests that on average recruitment practices are fair for disabled applicants, the results for individual trusts vary considerably. Some trusts are 5 times more likely to appoint non-disabled applicants than disabled applicants. Additionally, many staff do not declare a disability during the recruitment process, suggesting that a continued focus is needed on creating inclusive cultures and practices that give people confidence in declaring a disability at the application stage.
High impact action 2 of the NHS EDI Improvement Plan requires organisations to embed fair and inclusive recruitment processes and talent management strategies that target under-representation. To support and encourage disabled candidates to apply for NHS roles through a recruitment process, top performing trusts have taken actions such as supported recruitment days, training for managers on guaranteed interview process, and the provision of adjustments for candidates.
In the NHS Long Term Workforce Plan, we have committed to improving recruitment practices so they do not disadvantage any protected groups and encourage people with lived experience of healthcare services to apply.
A further 0.1 improvement in the relative likelihood (from 0.99 to 0.89) would result in an additional 1,950 disabled applicants being appointed across England.
Metric 3 – Capability
Definition: Relative likelihood of disabled staff compared to non-disabled staff entering the formal capability process on the grounds of performance.
Headline: Disabled staff are twice as likely as non-disabled staff to enter the formal capability process on the grounds of performance
Table 7: Relative likelihood of disabled staff compared to non-disabled staff entering the formal capability process on the grounds of performance
|
2019 |
2020 |
2021 |
2022 |
2023 |
|
See note [6] |
1.53 |
1.94 |
2.01 |
2.17 |
[6] Provision of this data in 2019 was voluntary and so the results obtained are not considered representative.
The data for the 4 years (2020-23) shows that disabled staff are increasingly overrepresented in capability procedures. 4.9% of the total workforce have declared a disability. This compares to:
- 8.0% of staff who are in the formal capability process on the grounds of ill-health
- 9.1% of staff who are in the formal capability process on the grounds of performance.
The number of cases overall and in some trusts is very small, and therefore we:
- have not disaggregated the data further
- advise that drawing any conclusions at anything more detailed than national level (for example, trust, region and trust type) should only be done with care.
Trusts with a higher relative likelihood (above 1.25) should undertake further investigations to identify potential causes, bearing in mind that small numbers (fewer than 11 disabled staff entering the capability process on the grounds of performance) may not be evidence of institutional issues.
Metric 4 – Harassment, bullying or abuse
This metric is split into 4 parts:
Metric 4a: Harassment, bullying or abuse from patients, service users, their relatives or other members of the public.
Metric 4b: Harassment, bullying or abuse from managers.
Metric 4c: Harassment, bullying or abuse from other colleagues.
Metric 4d: Percentage of staff who reported harassment, bullying or abuse the last time it happened.
High impact action 6 requires NHS organisations to create an environment that eliminates the conditions in which bullying, discrimination, harassment and physical violence at work occur. This is also reference in the NHS Long Term workforce Plan.
Metric 4a – Harassment, bullying or abuse from patients, service users, their relatives or other members of the public
Definition: Percentage of disabled staff compared to non-disabled staff experiencing harassment, bullying or abuse in the last 12 months from patients, service users, relatives or members of the public.
Headline: 1 in 3 disabled staff experience harassment, bullying or abuse from patients, service users, their relatives, or members of the public
Table 8: Proportion of disabled and non-disabled staff experiencing harassment, bullying or abuse from patients, service users or the public
|
Year |
Disabled |
Non-disabled |
Difference (disabled from non-disabled) |
|
2018 |
34.1% |
27.1% |
+7.0 percentage points |
|
2019 |
34.2% |
27.4% |
+6.8 percentage points |
|
2020 |
31.9% |
25.5% |
+6.4 percentage points |
|
2021 |
33.0% |
25.7% |
+7.3 percentage points |
|
2022 |
33.2% |
26.0% |
+7.2 percentage points |
Figure 1: Proportion of disabled and non-disabled staff experiencing harassment, bullying or abuse from patients, service users or the public

Figure 1 above is a line chart showing that a higher proportion of disabled staff, compared to non-disabled staff, experienced harassment, bullying or abuse from patients, service user or the public in the period 2018 to 2022.
Summary insight from data collection
A third of disabled staff (33.2%) report that they have experienced bullying, harassment or abuse from patients, service users or the public. Levels are 6 to 7 percentage points higher than for non-disabled staff, a difference that has remained relatively constant over the last 5 years.
Since 2020, the COVID-19 pandemic limited the number of face-to-face appointments, significantly reducing the number of times negative interactions could occur. This is reflected in a significant drop (improvement) in this metric. In 2021, with the start of the easing of COVID-19 restrictions, the number of face-to-face appointments increased and so did the level of harassment; and this increase continued into 2022.
Across trusts, the proportion of disabled staff who experience harassment, bullying or abuse from patients, service users or the public varies from 13.5% (the best) to 62.0% (the worst). There is a strong correlation with trust type: just over 1 in 4 disabled staff in community trusts experience harassment, bullying or abuse from patients. The proportion in acute and mental health trusts is about 5 percentage points worse, and in ambulance trusts about 20 percentage points worse still.
Between 2018 and 2020, the gap between the proportions of disabled staff and non-disabled staff experiencing harassment, bullying or abuse from patients, service users or the public had been slowly reducing. However, in 2021, this widened to 7.3 percentage points, the biggest gap in the last 5 years, and this gap has been consistent in 2023.
We did not observe any actions that are significantly reducing the level of incidents. A sustained focus is required to shift the current position. A 1.0 percentage point decrease would result in 1,418 fewer incidents across England.
Metric 4b – Harassment, bullying or abuse from managers
Definition: Percentage of disabled staff compared to non-disabled staff experiencing harassment, bullying or abuse in the last 12 months from managers.
Headline: 16.1% of disabled staff and 9.2% of non-disabled staff report experiencing harassment, bullying or abuse from managers
Table 9: Proportion of disabled and non-disabled staff experiencing harassment, bullying or abuse from managers
|
Year |
Disabled |
Non-disabled |
Difference (disabled from non-disabled) |
|
2018 |
19.4% |
11.5% |
+7.9 percentage points |
|
2019 |
18.5% |
10.8% |
+7.8 percentage points |
|
2020 |
18.5% |
10.6% |
+7.9 percentage points |
|
2021 |
17.0% |
9.6% |
+7.4 percentage points |
|
2022 |
16.1% |
9.2% |
+6.9 percentage points |
Figure 2: Proportion of disabled and non-disabled staff experiencing harassment, bullying or abuse from managers
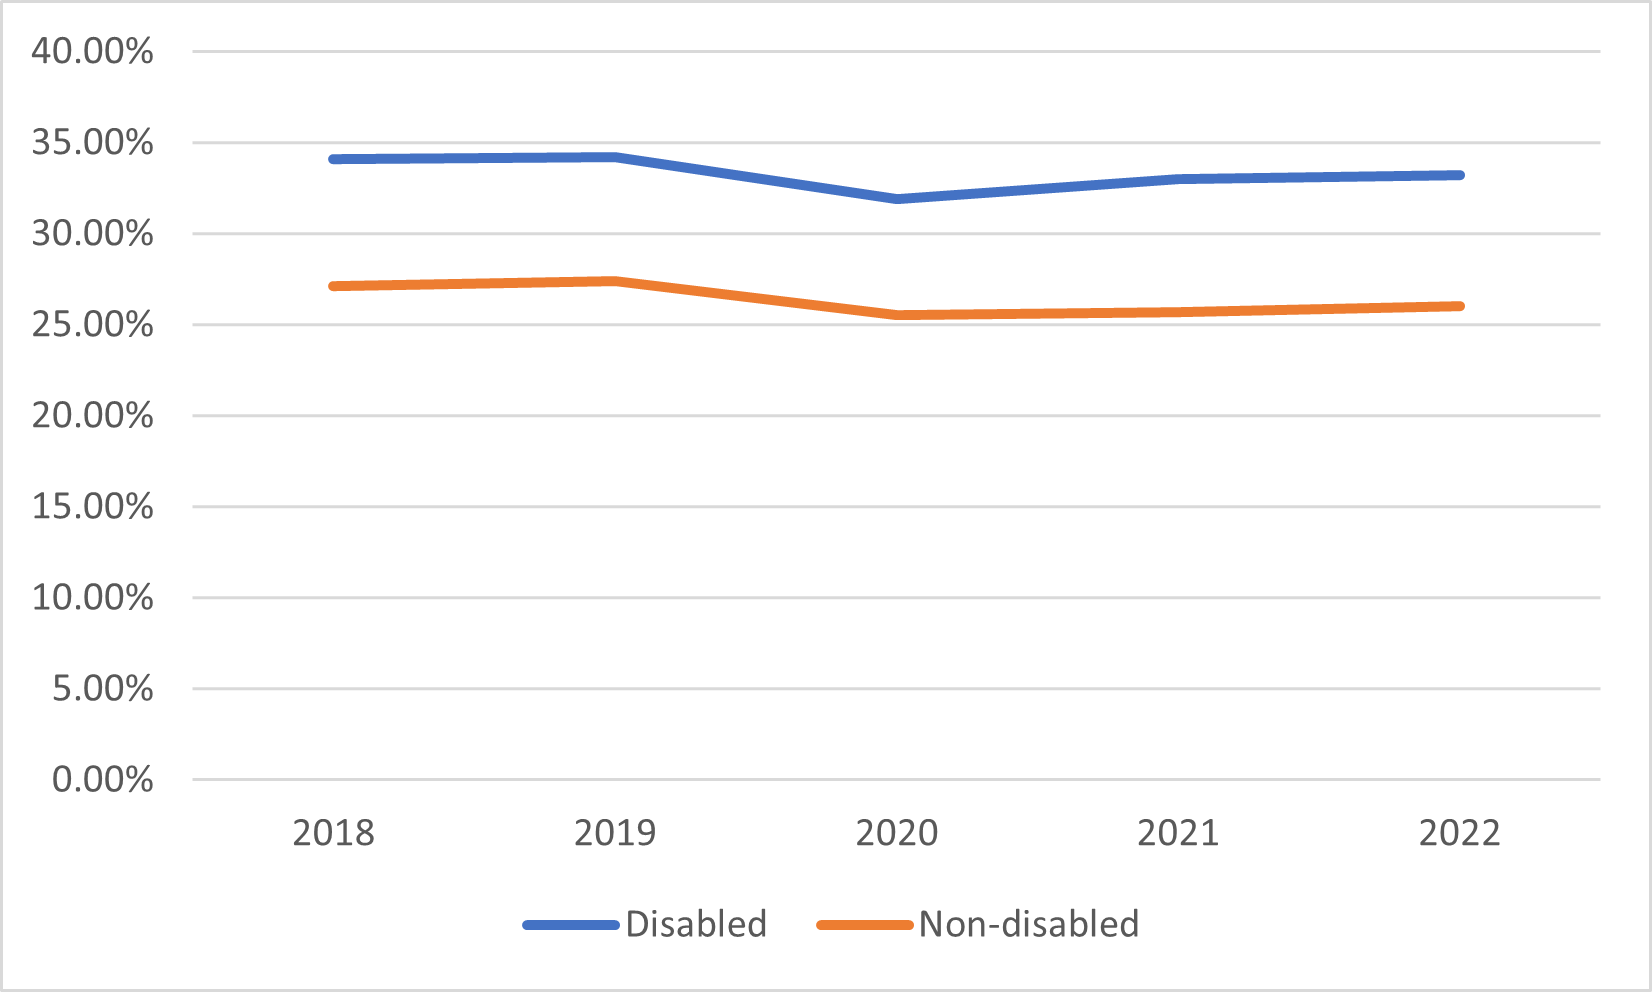
Figure 2 above is a line chart showing that a higher proportion of disabled staff, compared to non-disabled staff, experienced harassment, bullying or abuse from managers in the period 2018 to 2022.
Summary insight from data collection
Around a sixth of disabled staff say that they have experienced harassment, bullying or abuse from their managers. The difference between disabled and non-disabled staff is slowly reducing and is now 6.9 percentage points.
The proportion of disabled staff who experience harassment, bullying or abuse from managers varies in trusts from 6.8% (the best) to 35.1% (the worst). There is a strong correlation with trust type: the proportion of disabled staff in the ambulance sector who report harassment, bullying or abuse from their line manager is 2 times the level reported by staff in mental health or community trusts.
A further 1.0 percentage point decrease would result in 1,408 fewer incidents across England.
Metric 4c – Harassment, bullying or abuse from other colleagues
Definition: Percentage of disabled staff compared to non-disabled staff experiencing harassment, bullying or abuse in the last 12 months from other colleagues.
Headline: 1 in 4 disabled staff experience harassment, bullying or abuse from colleagues. This is 8.3 percentage points higher than for non-disabled staff
Table 10: Proportion of disabled and non-disabled staff experiencing harassment, bullying or abuse from other colleagues
|
Year |
Disabled |
Non-disabled |
Difference (disabled from non-disabled) |
|
2018 |
26.4% |
17.2% |
+9.2 percentage points |
|
2019 |
26.3% |
17.3% |
+9.0 percentage points |
|
2020 |
25.6% |
16.7% |
+8.8 percentage points |
|
2021 |
25.0% |
16.4% |
+8.6 percentage points |
|
2022 |
24.8% |
16.5% |
+8.3 percentage points |
Figure 3: Proportion of disabled and non-disabled staff experiencing harassment, bullying or abuse from other colleagues
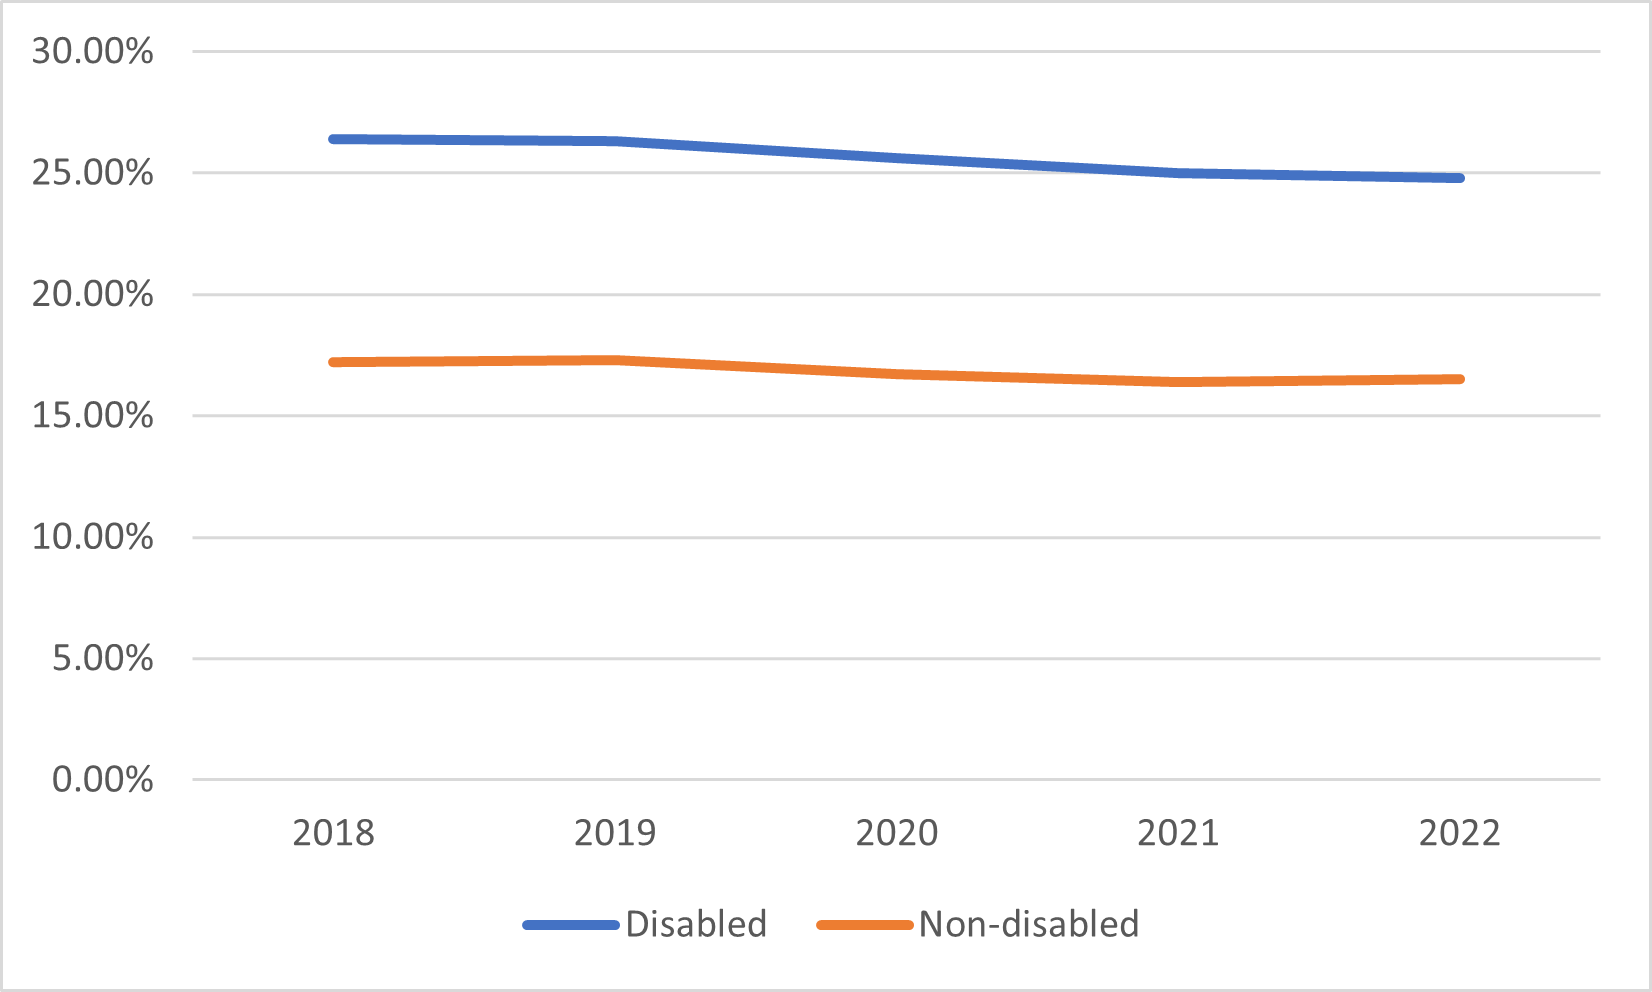
Figure 3 above is a line chart showing that a higher proportion of disabled staff, compared to non-disabled staff, experienced harassment, bullying or abuse from other colleagues in the period 2018 to 2022.
Summary insight from data collection
In trusts, the proportion of disabled staff who experience harassment, bullying or abuse from other colleagues varies from 13.1% (the best) to 42.4% (the worst). Results for trusts type are different than for metrics 4a and 4b. 27.0% of disabled staff in acute trusts report harassment, bullying or abuse from other colleagues, compared to 25.2% in ambulance trusts, 20.0% in mental health trusts and 17.9% in community trusts.
A further 1.0 percentage point decrease would result in 1,404 fewer incidents across England.
Metric 4d – Reporting harassment, bullying or abuse
Definition: Percentage of staff who reported harassment, bullying or abuse the last time it happened.
Headline: Just over half of disabled staff reported the last incidence of harassment, bullying or abuse
Table 11: Percentage of disabled and non-disabled staff who reported harassment, bullying or abuse the last time it happened
|
Year |
Disabled |
Non-disabled |
Difference (disabled from non-disabled) |
|
2018 |
48.2% |
47.3% |
+0.8 percentage points |
|
2019 |
49.7% |
48.5% |
+1.2 percentage points |
|
2020 |
49.8% |
48.2% |
+1.6 percentage points |
|
2021 |
49.9% |
48.6% |
+1.2 percentage points |
|
2022 |
51.3% |
49.5% |
+1.8 percentage points |
Figure 4: Percentage of disabled and non-disabled staff who reported the last incidence of harassment, bullying or abuse
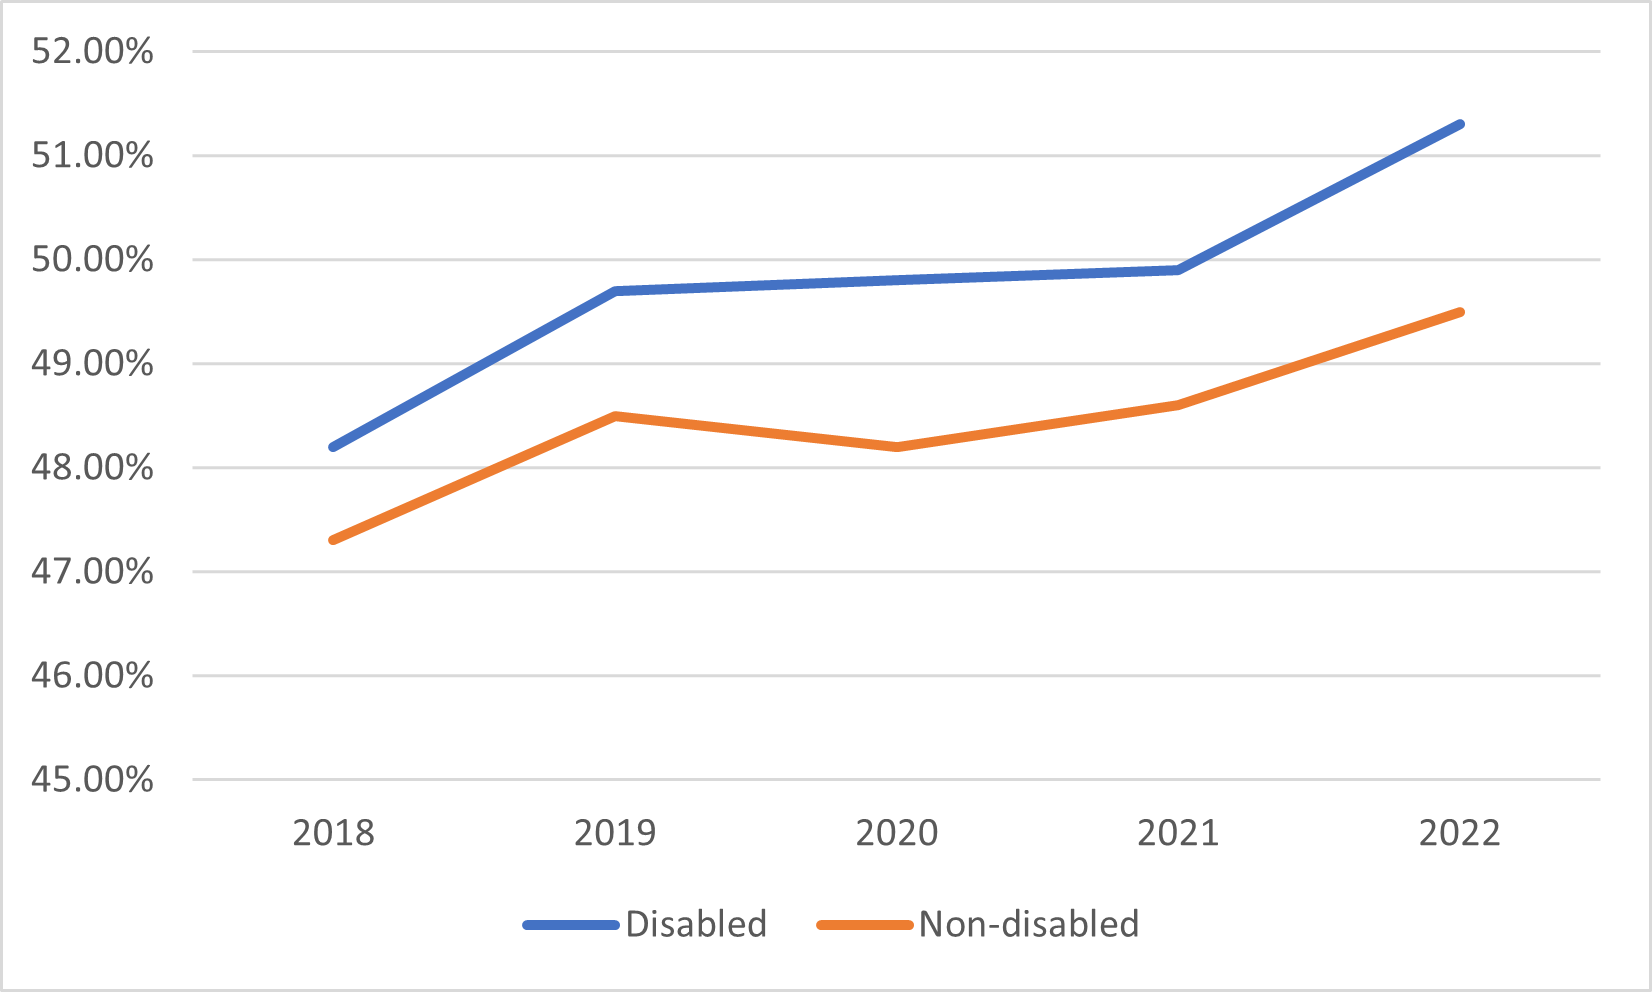
Figure 4 above is a line chart showing that a higher percentage of disabled staff, compared to non-disabled staff, reported the last incidence of harassment, bullying or abuse in the period 2018 to 2022.
Summary insight from data collection
Overall, more disabled staff are reporting bullying, harassment or abuse.
Disabled and non-disabled are both increasingly likely to report an incident. However, the data also shows that only about 1 in 2 of incidents are being reported. A continued focus is needed on interventions in the workplace that reduce levels of harassment and improve a culture of speaking up.
Across trusts the proportion of disabled staff who reported the latest incidence of harassment, bullying or abuse varies from 75.8% (the best) to 33.3% (the worst). Incidents of harassment, bullying or abuse against disabled staff are most likely to be reported in mental health trusts (59.6%) closely followed by community trusts (58.3%) and least likely to be reported in ambulance trusts (46.6%).
A further 1.0 percentage point increase would result in 618 more staff reporting incidents across England.
We observed that the top performing trusts developed work programmes that included a ‘Nobody left behind’ equality, diversity and inclusion strategy, co-producing a Respect campaign with staff networks, developing a microagression reporting form and running reverse mentoring and respectful resolution training.
Metric 5 – Career progression
Definition: Percentage of disabled staff compared to non-disabled staff believing their trust provides equal opportunities for career progression or promotion.
Headline: Just over half of disabled staff believe their organisation treats everyone equally regarding career progression or promotion
In the NHS Long Term Workforce Plan we have committed to improving career progression opportunities for disabled staff. However, the data shows that just over 50% of disabled staff currently believe that there are equal opportunities for career progression. The difference between disabled and non-disabled staff who believe their trust provides equal opportunity has slowly reduced and is now 5.7 percentage points.
Table 12: Percentage of disabled and non-disabled staff who believe their trust provides equal opportunities for career progression or promotion
|
Year |
Disabled |
Non-disabled |
Difference (disabled from non-disabled) |
|
2018 |
50.9% |
57.6% |
-6.7 percentage points |
|
2019 |
51.9% |
57.9% |
-6.1 percentage points |
|
2020 |
51.5% |
57.7% |
-6.1 percentage points |
|
2021 |
51.3% |
57.2% |
-5.9 percentage points |
|
2022 |
52.1% |
57.7% |
-5.7 percentage points |
Figure 5: Percentage of disabled and non-disabled staff who believe their trust provides equal opportunities for career progression or promotion
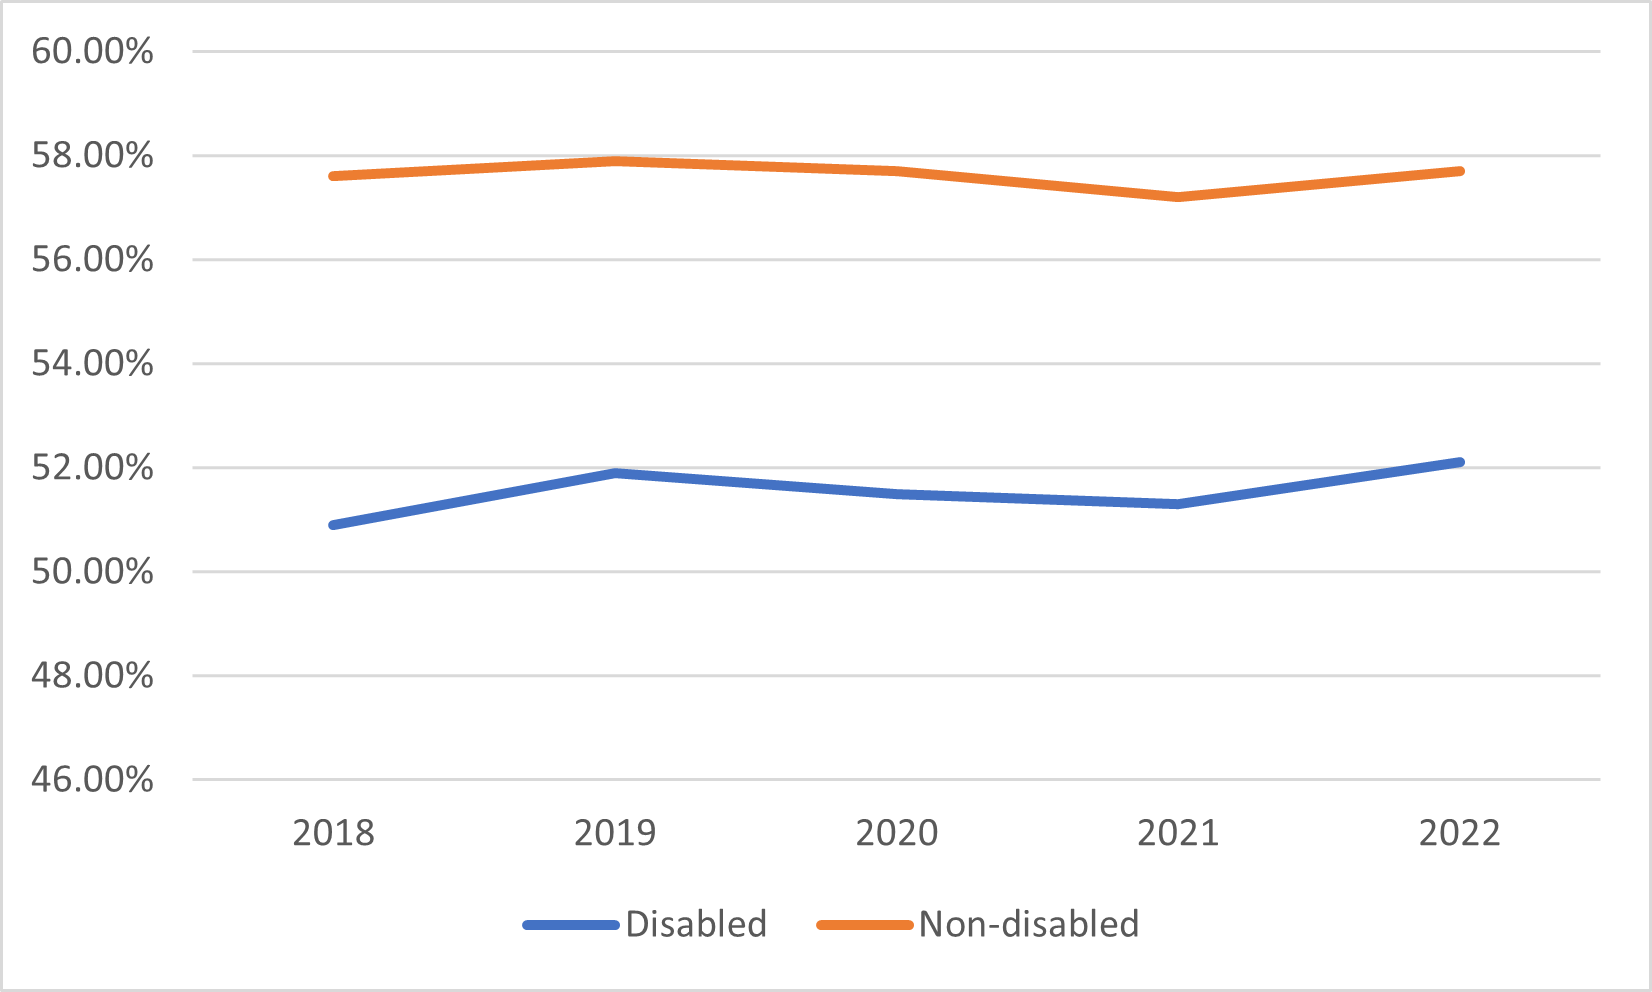
Figure 5 above is a line chart showing that a higher percentage of non-disabled staff, compared to disabled staff, believe their trust provides equal opportunities for career progression or promotion in the period 2018 to 2022.
Across trusts, the percentage of disabled staff believing they have equal opportunities for career progression or promotion ranges from 67.6% (best) to 24.7% (worst).
A further 1.0 percentage point increase would result in 1,414 more disabled staff believing that they have equal opportunities for career progression and promotion across England.
We observed that the top performing trusts had actively worked to support neurodivergent staff, and targeted disabled staff to participate in coaching programmes.
Metric 6 – Presenteeism
Definition: Percentage of disabled staff compared to non-disabled staff saying that they have felt pressure from their manager to come to work, despite not feeling well enough to perform their duties.
Headline: Less than 30% of disabled staff experience presenteeism; this is the lowest level in 5 years
Table 13: Percentage of disabled and non-disabled staff saying that they have felt pressure from their manager to come to work, despite not feeling well enough to perform their duties
|
Year |
Disabled |
Non-disabled |
Difference (disabled from non-disabled) |
|
2018 |
32.1% |
22.4% |
+9.6 percentage points |
|
2019 |
30.6% |
21.2% |
+9.4 percentage points |
|
2020 |
31.1% |
22.9% |
+8.2 percentage points |
|
2021 |
29.9% |
22.1% |
+7.9 percentage points |
|
2022 |
27.7% |
19.9% |
+7.8 percentage points |
Figure 6: Percentage of disabled and non-disabled staff saying that they have felt pressure from their manager to come to work, despite not feeling well enough to perform their duties
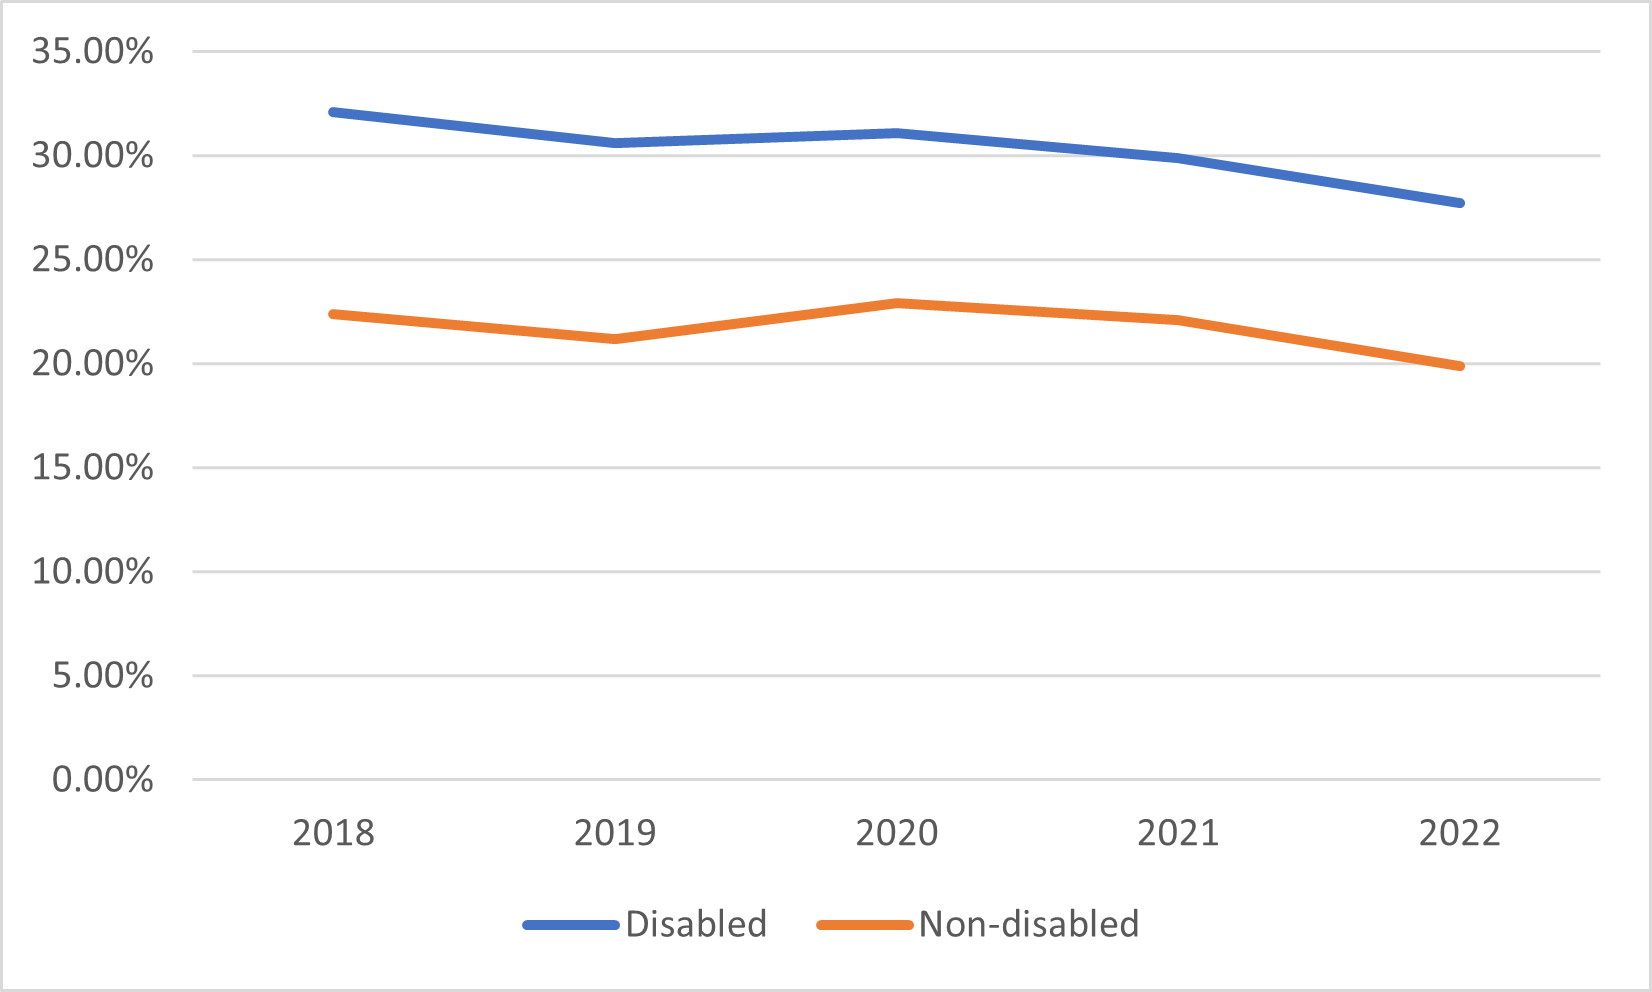
Figure 6 above is a line chart showing that a higher percentage of disabled staff, compared to non-disabled staff, say that they have felt pressure from their manager to come to work, despite not feeling well enough to perform their duties in the period 2018 to 2022.
There are significantly higher rates of presenteeism among disabled staff than non-disabled staff. The difference in this metric between disabled and non-disabled staff remains significant but has fallen from 9.6 percentage points in 2018 to 7.8 percentages points in 2022.
Across trusts, the proportion of disabled staff saying that they have felt pressure from their manager to come to work despite not feeling well enough to perform their duties ranges from 11.3% (best) to 56.9% (worst). Rates among disabled staff in ambulance trusts (40.7%) are more than twice that of disabled staff in mental health trusts (19.4%).
4 trusts have a presenteeism rate for disabled staff of over 40%: this is down from 10 trusts in 2021.
A further 1.0 percentage point reduction would result in 1,013 fewer disabled staff experiencing presenteeism across England.
We observed that the top performing trusts developed work programmes. This included:
- creating an approach to managing absence based on individual needs, not sickness absence triggers
- analysing sickness absence records as a basis for decision making. Records show disabled staff have less absence when flexible policies are in place
- providing guidance and training for line managers about how to support workplace adjustments and access equipment when required
- creating a disability and carers’ leave policy.
Metric 7 – Feeling valued
Definition: Percentage of disabled staff compared to non-disabled staff saying that they are satisfied with the extent to which their organisation values their work.
Headline: The proportion of disabled staff who feel valued by their employer was relatively unchanged in 2022 after a fall 4.3 percentage points the previous year (from 39.4% in 2020 to 35.1% in 2021)
Table 14: Percentage of disabled and non-disabled staff saying that they are satisfied with the extent to which their organisation values their work
|
Year |
Disabled |
Non-disabled |
Difference (disabled from non-disabled) |
|
2018 |
37.3% |
48.5% |
-11.2 percentage points |
|
2019 |
39.1% |
50.4% |
-11.3 percentage points |
|
2020 |
39.4% |
50.7% |
-11.3 percentage points |
|
2021 |
35.1% |
44.9% |
-9.8 percentage points |
|
2022 |
35.2% |
45.0% |
-9.8 percentage points |
Figure 7: Percentage of disabled and non-disabled staff saying that they are satisfied with the extent to which their organisation values their work
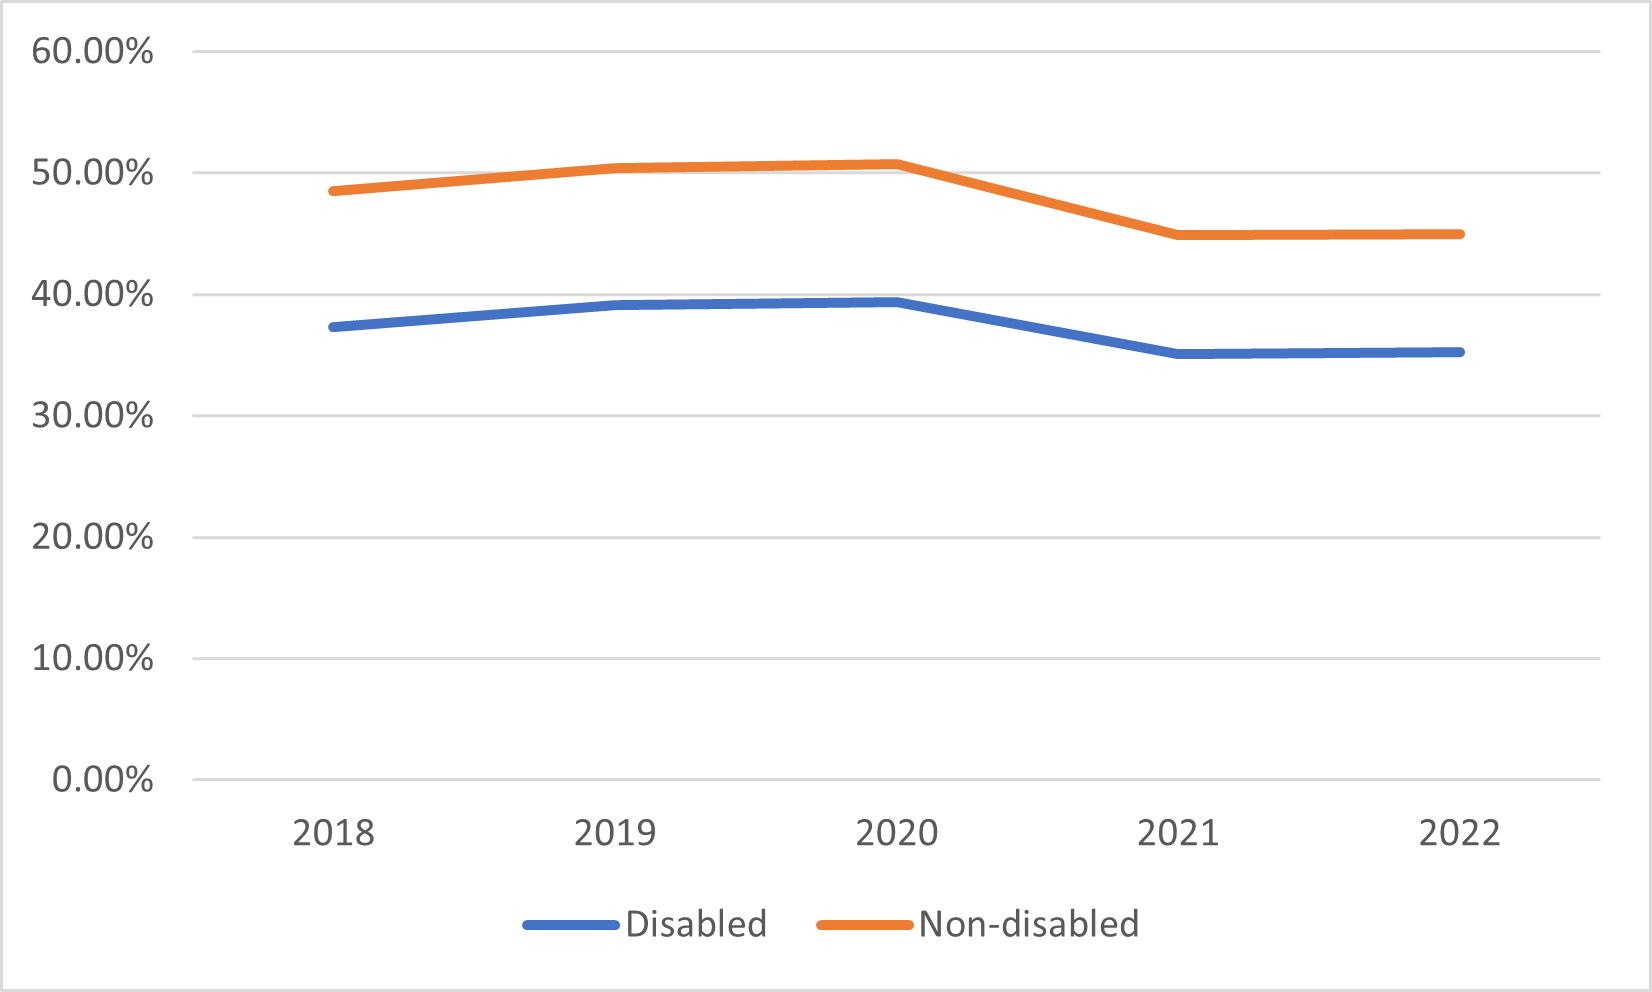
Figure 7 is a line chart showing that a higher percentage of non-disabled staff, compared to disabled staff, say that they are satisfied with the extent to which their organisation values their work in the period 2018 to 2022.
Following the NHS people promise theme “We are recognised and rewarded”, the NHS Long Term Workforce Plan acknowledges that a more strategic and aligned approach is needed to improve reward and recognition for staff.
Only around a third of disabled staff (35.2%) are satisfied with the extent to which their organisation values their work. This compares with 45.0% for non-disabled staff.
Across trusts, the percentage ranges from 53.6% (best) to 16.3% (worst). Ambulance trusts have the lowest level of feeling valued among their disabled staff (20.8%), with mental health trusts and community trusts over twice that proportion.
Trusts must give further consideration to specific actions that improve how valued disabled staff feel. A further 1.0 percentage point increase would result in 1,419 more disabled staff feeling valued across the country.
Metric 8 – Workplace adjustments
Definition: Percentage of disabled staff saying that their employer has made reasonable adjustment(s) to enable them to carry out their work.
Headline: The proportion of disabled staff who obtained the workplace adjustments they need to perform their work effectively increased by 1.2 percentage points, from 72.2% in 2021 to 73.4% in 2022
Table 15: Percentage of disabled staff saying that their employer has made the workplace adjustment(s) necessary to enable them to carry out their work
|
Year |
Definition |
Disabled |
|
2018 |
“Adequate adjustments” |
73.3% |
|
2019 |
“Adequate adjustments” |
73.8% |
|
2020 |
“Adequate adjustments” |
76.6% |
|
2021 |
“Adequate adjustments” |
72.2% |
|
2022 |
“Reasonable adjustments” |
73.4% |
Figure 8: Percentage of disabled staff saying that their employer has made the workplace adjustment(s) necessary to enable them to carry out their work
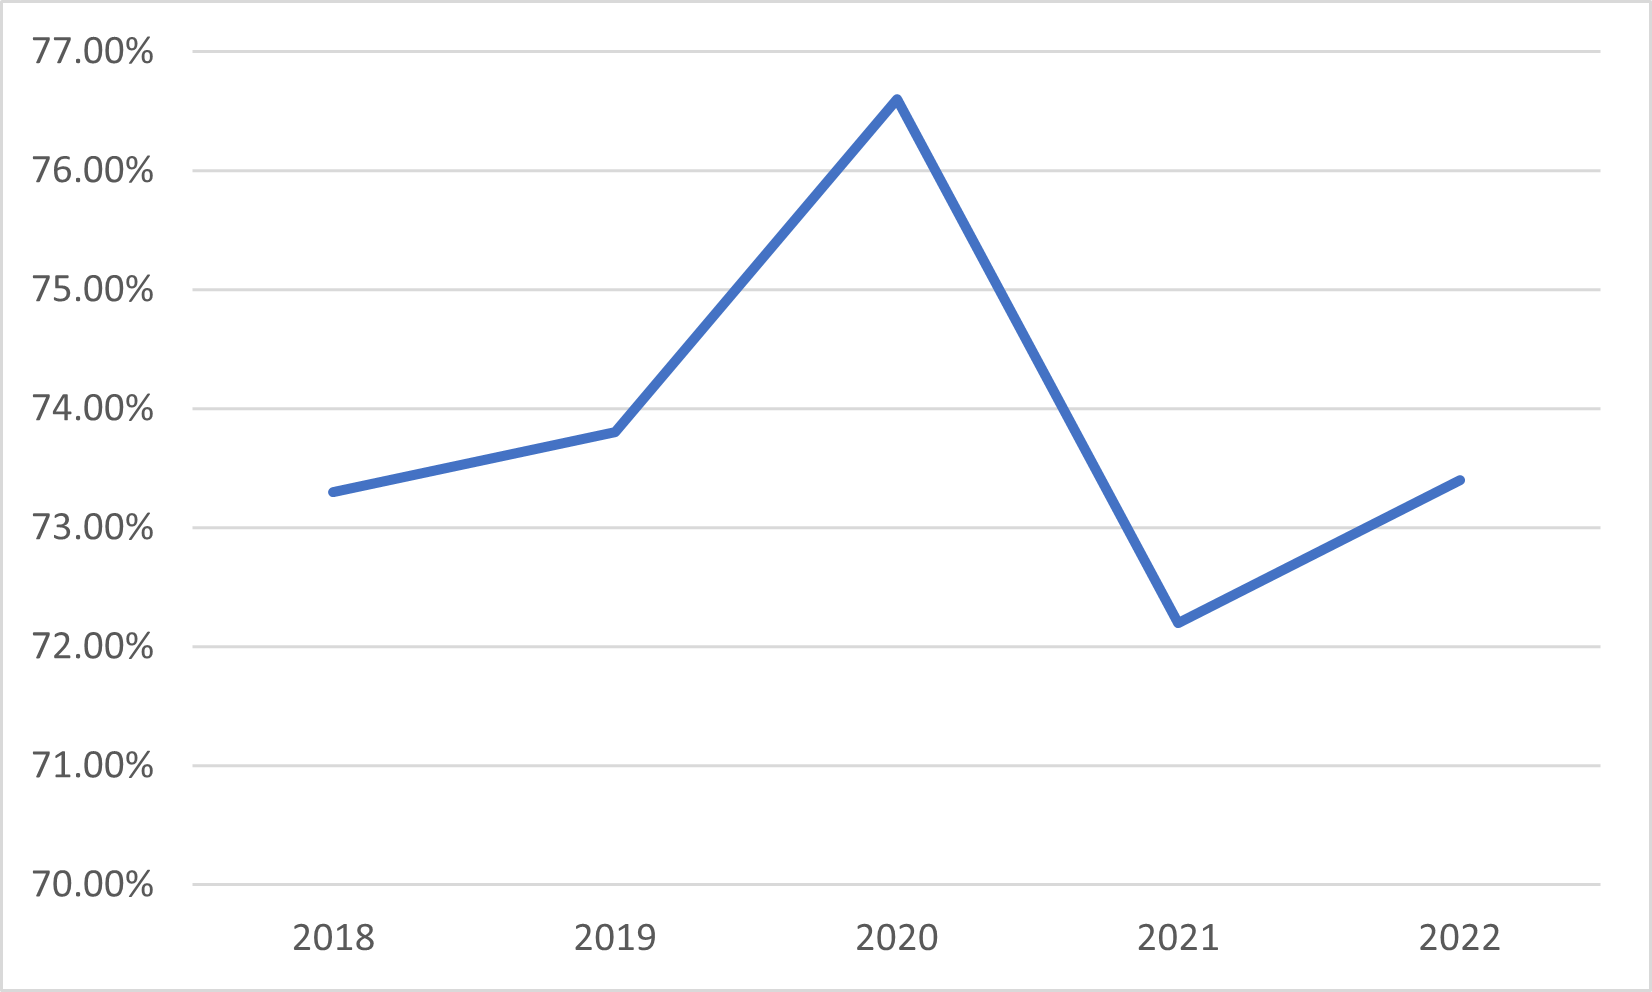
Figure 8 above is a line chart showing that the percentage of disabled staff saying that their employer has made the workplace adjustments(s) necessary to enable them to carry out their work was 73.3% in 2018, peaked at 76.6% in 2020, and was 73.4% in 2022.
Three quarters of disabled staff (73.4%) are satisfied with their workplace adjustments.
Across trusts the percentage of disabled staff saying that their employer has made workplace adjustment(s) to enable them to carry out their work ranges from 88.6% (best) to 53.4% (worst). 4 trusts have a rate of less than 60% and 39 trusts have a rate of over 80%.
A further 1.0 percentage point reduction would result in 841 more disabled staff across England feeling satisfied with their workplace adjustments.
We identified that the top performing trusts for this metric had developed work programmes. This included:
- creating a process to ensure all line managers are aware of the legal requirement to provide workplace adjustments and the process for delivering them
- providing online intranet information to ensure all staff know about workplace adjustments
- providing information on access to work during the reasonable adjustment application process
- creating a video to help colleagues and managers through the workplace adjustments process
- producing a reasonable adjustments guidance document, that included a list of potential options
- providing training for managers on workplace adjustments and holding compassionate conversations.
Metric 9 – Staff engagement
Metric 9a – Staff engagement score
Definition: The staff engagement score for disabled staff from the NHS Staff Survey, compared to non-disabled staff.
Headline: The staff engagement score for disabled staff in 2022 was 6.4, which is 0.5 points lower than that for non-disabled staff
Table 16: Staff engagement score
|
Year |
Disabled |
Non-disabled |
Difference (disabled from non-disabled) |
|
2018 |
6.6 |
7.1 |
-0.5 |
|
2019 |
6.6 |
7.1 |
-0.5 |
|
2020 |
6.7 |
7.2 |
-0.5 |
|
2021 |
6.5 |
7.0 |
-0.5 |
|
2022 |
6.4 |
6.9 |
-0.5 |
Figure 9: Staff engagement score
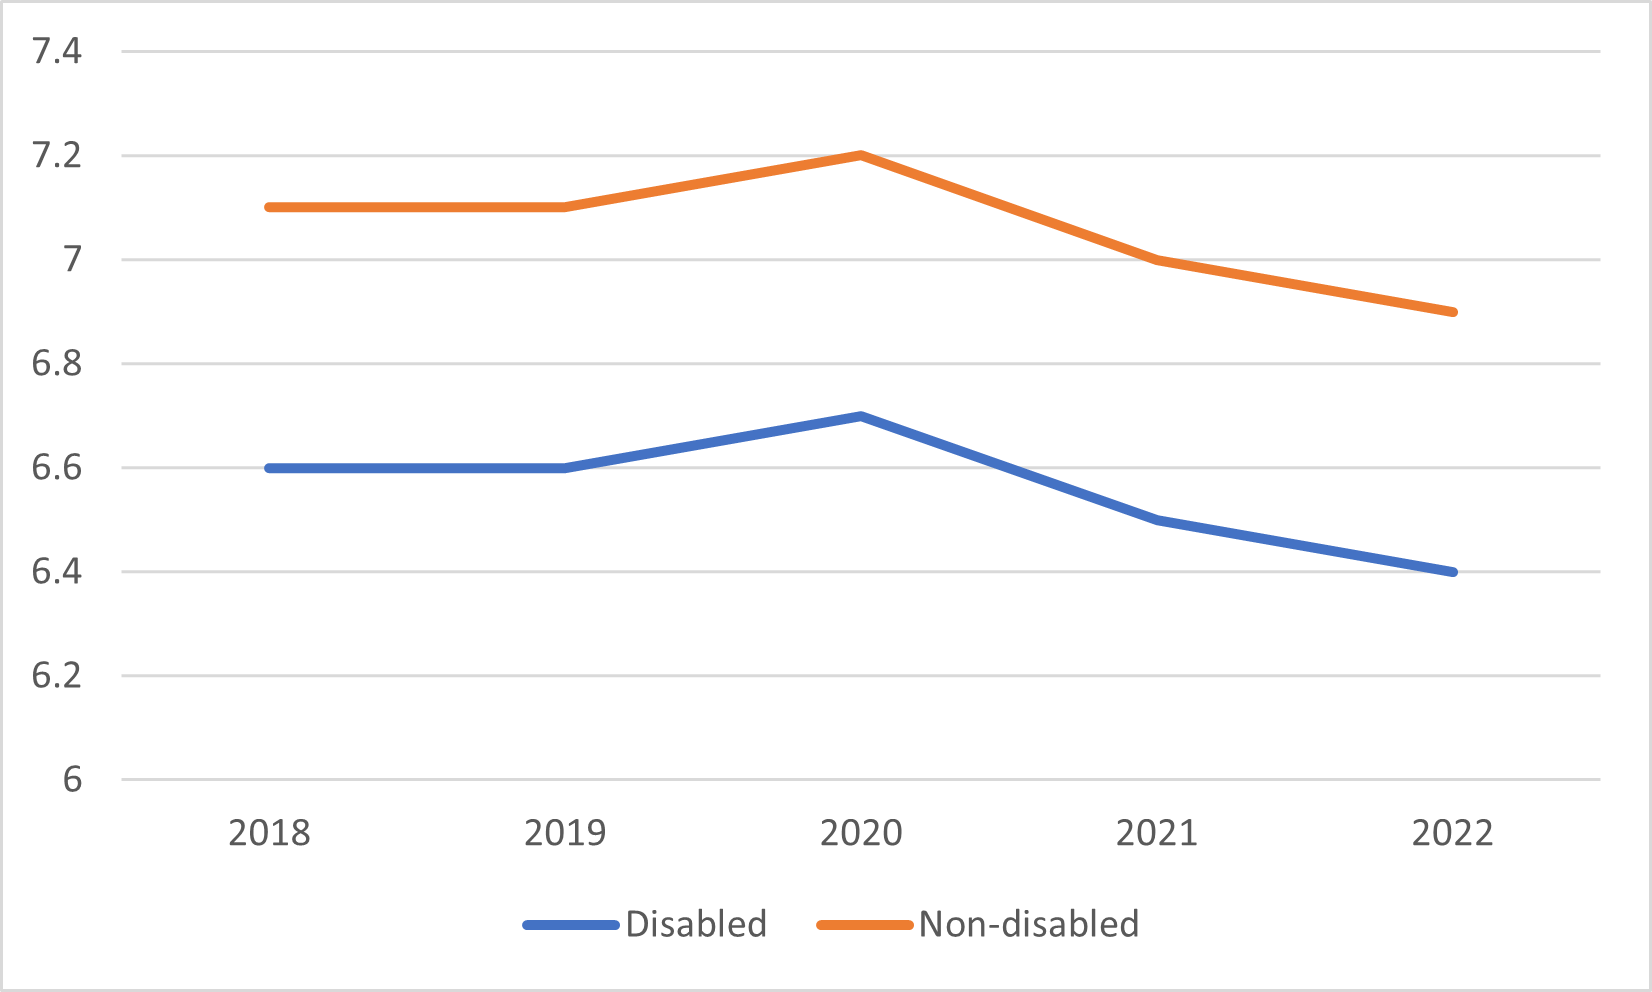
Figure 9 above is a line chart showing that disabled staff, compared to non-disabled staff, had a lower staff engagement score in the period 2018 to 2022.
Engagement with disabled staff was consistent up until 2020, but has since reduced each year by a statistically significant margin, as it has done for non-disabled staff. The difference between disabled and non-disabled staff has remained at -0.5 since 2018.
Across trusts, the staff engagement score for disabled staff ranges from 7.30 (best) to 4.93 (worst). The scores for ambulance trusts are significantly worse (more than 1.0) than for other trust types.
Our analysis highlights that trusts must do more to improve staff engagement. We would encourage trusts to engage staff networks in identifying actions to achieve this.
Metric 9b – Voices of disabled staff
Definition: has your trust taken action to facilitate the voices of disabled staff in your organisation to be heard?
Headline: In 2023, all 212 trusts declared that they had taken action to facilitate the voices of disabled staff to be heard
The NHS people promise theme of “We each have a voice that counts” means that all voices need to be heard and considered in decision making. Every trust in the country is now, for the first time, listening to the voices of disabled staff and so allowing everyone to make a difference.
The importance of staff voice is also recognised in the NHS Long Term Workforce Plan, which states that all NHS organisations will be encouraged to assess the effectiveness of current methods of staff communication and ensure they have a listening approach in place that best engages staff and ensures feedback is acted upon.
We identified that the top performing trusts had developed work programmes including:
- creating multiple channels to allow staff to speak up and raise concerns
- utilising Schwartz Rounds to facilitate conversations on lived experience
- training all line managers to hold supportive conversations with disabled staff
- inviting staff networks to present at board meetings
- ensuring staff networks have executive sponsors who meet with the networks regularly
- providing training sessions to raise awareness and discussion on such as neurodivergence
Metric 10 – Board representation
Definition: percentage of the board’s membership who have declared a disability.
Headline: The disability declaration rate among board members is now 5.7%, which is an increase of 1.1 percentage points since 2022 and 0.8 percentage points higher than it is for the overall workforce
Table 17: 2023 Board membership
|
2023 Board membership |
Overall workforce |
Rate of long-term condition or illness from Staff Survey | |||||
|
Voting |
Non-voting |
Exec |
Non-exec |
Total | |||
|
Disabled |
5.6% |
6.1% |
5.4% |
6.0% |
5.7% |
4.9% |
23.4% |
|
Non-disabled |
74.5% |
75.4% |
79.1% |
70.5% |
74.7% |
78.4% |
75.8% |
|
Unknown |
19.9% |
18.4% |
15.5% |
23.5% |
19.5% |
16.6% |
0.8% |
Summary insight from data collection
- 193 board members have declared a disability, a rise of 130 since 2019
- the declaration rate of board members is higher than the overall workforce, having risen from 4.6% in 2022 to 5.7% in 2023. The largest increases are for non-voting members (an increase of 2.2 percentage points) and executive members (an increase of 1.2 percentage points)
- the highest board declaration rate is 35.7% (a slight fall from 2022): there are only 3 trusts with a declaration rate above either the average rate for the workforce shown in the NHS Staff Survey (23.4%) or the disability prevalence rates in the general population (24%)
- 88 boards (41.5%) have no members who have declared a disability (this has fallen from 74.9% in 2019)
- only 26 boards (12.3%) have more than 1 board member who has declared a disability
- non-voting directors have the highest proportion of disabled members (6.1%, up from 3.9% in 2022)
- non-executive directors have the second highest proportion of disabled members (6.0%), but the highest proportion of ‘unknown’ status (nearly 1 in 4)
- 5.4% of executive board members have declared a disability (up from 4.2% in 2022)
- disabled board members make up 5.6% of the voting members of boards (up from 4.8% in 2022)
- ‘unknown’ status is higher among board members at 19.5% compared with the rate for the overall workforce (16.6%)
- 23 trusts have at least half of their board members with an ‘unknown’ status. While this does include members who have declared “prefer not to say”, this typically makes up less than 1% of responses, meaning the rest are board members who have not actively made a declaration of their status on ESR
- acute trusts have the lowest proportion of board members who have declared a disability (4.4%): mental health trusts have the highest (8.5%)
A further 1.0 percentage point increase would result in 34 more disabled board members across England.
We observed that the top 10 performing trusts for this metric had developed work programmes including raising the visibility of senior disabled staff and the introduction of ‘inclusive leadership’ modules in leadership development programmes.
Qualitative actions
Within this report we have included more detailed data analysis from the qualitative part of the Workforce Disability Equality Standard (WDES) collection, which highlights actions from trusts that are improving their performance. We have included a spotlight on the work of the top 10 percent of trusts for each metric. These examples feature the types of work that other trusts and NHS organisations could consider when planning actions targeted at improving the career and workplace experiences of disabled staff.
Based upon the qualitative data analysis, this section of the report presents our observations on some of the positive actions that have made a demonstrable impact on improvement of WDES metrics, although the exact scale and multiplicity of impact across each of the metrics is varied.
Table 18: Observations on actions that had impact on metrics performance
|
Action |
Scale of impact |
|
Using the NHS Employers disability passport |
Improvement of 1.1 percentage points for metric 1. |
|
Being a “Mindful Employer” |
Improvement of 0.9 to 4.0 percentage points for metrics 1, 4a-d, 5, 6, 7
We observed a positive impact of 0.09 on the relative likelihood of recruitment measured in metric 2. |
|
Signing the Disability Employment Charter |
Improvement of 0.9 to 6.9 percentage points for metrics 1, 4a-d, 5, 6, 7, 8.
We observed a positive impact of 0.34 on the relative likelihood of recruitment.
|
|
Undertaking health and wellbeing conversations with all staff that include opportunities to discuss disability |
Improvement of 0.9 to 4.1 percentage points for metrics 1, 4b-d, 6, and 7.
|
|
Taking part in the NHS Employers Diversity in Health and Care Partners Programme |
Improvement of 1.0 to 2.9 percentage points for metrics 4b, 7 and 10. |
|
Promoting health and wellbeing services |
Improvement of 1.6 percentage points for metric 6. |
|
Having a flexible working policy |
Improvement of 1.5 percentage points for metric 6. |
|
Having a workplace passport |
Improvement of 1.5 percentage points for metric 6. |
|
Using the NHS civility and respect toolkit |
Improvement of 1.4 percentage points for metric 6. |
|
Producing internal communications on workplace adjustments |
Improvement of 3.0 percentage points for metric 7. |
|
Delivering disability training for all staff |
Improvement of 2.2 percentage points for metric 7. |
|
Raising visibility of senior disabled staff |
Improvement of 1.9 percentage points for metric 7, and 3.2 percentage points for metric 10. |
|
Developing other internal communication activities (eg staff emails, intranet pages, internal events, poster campaigns |
Improvement of 2.9 percentage points for metric 10. |
Additional information
Disability data by staff group
We have undertaken analysis of disability declaration rates by staff group. The categories used in 2022 are different from those used in 2023, so some groups have been merged.
Table 19: Disability declaration rate by staff group
|
2022 staff groups |
2023 staff groups |
April 2022 |
March 2023 |
August 2023 |
|
Corporate and admin |
5.7% |
6.6% |
7.2% | |
|
Estates |
3.9% |
4.4% |
4.6% | |
|
Medical staff |
2.3% |
2.7% |
2.9% | |
|
Qualified AHPs |
Qualified AHPs |
5.5% |
6.4% |
6.7% |
|
Qualified ambulance service staff |
6.1% |
6.7% | ||
|
Qualified healthcare scientists |
3.4% |
4.0% |
4.4% | |
|
Qualified nurses |
Health visitors |
4.4% |
5.3% |
6.2% |
|
Midwives |
5.2% |
5.6% | ||
|
Nurse associates |
5.8% |
6.1% | ||
|
Registered nurses |
4.9% |
5.1% | ||
| Qualified scientific, therapeutic and technical staff |
5.6% |
6.4% |
6.9% | |
|
Support to AHP |
Support to AHP |
5.3% |
6.5% |
6.9% |
|
Support to ambulance staff |
6.5% |
7.1% | ||
|
Support to healthcare scientists |
5.5% |
6.4% |
6.9% | |
|
Support to nurses |
Support to nurses |
4.3% |
4.8% |
5.1% |
|
Trainee nurse associates |
6.0% |
6.6% | ||
|
Support to STT staff |
8.1% |
9.6% |
10.0% | |
|
Total |
4.6% |
5.3% |
5.7% | |
Appendix 1 – Data methodology and notes
In 2023, trusts were required to:
- verify, complete and submit data by 31 May 2023
- publish a board ratified Workforce Disability Equality Standard (WDES) 2023/24 annual report, containing the trust’s metrics data, evidence of engagement with disabled staff and an action plan. The report should be available on the trust’s external website by 31 October 2023.
For a detailed description of the metrics, and other associated information, please refer to the relevant guidance published on our website.
For WDES metrics 2 (recruitment) and 3 (capability), statistical significance is assessed using the ‘four-fifths’ rule. If the relative likelihood of an outcome for one subgroup compared to another is less than 0.80 or higher than 1.25, then the process would be identified as having an adverse impact: relative likelihoods between 0.8 and 1.25 suggest there is no significant difference between the subgroups. A lack of statistical significance should not be interpreted as meaning that disabled individuals or disabled staff do not experience inequalities in these areas.
Comparisons to other NHS organisations for these metrics are available on the Model health system.
Additional notes
- Data collected from trusts is either as a snapshot as at 31 March 2023 (metrics 1 and 10), the year running to 31 March 2023 (metrics 2 and 9b) or the average (mean) of the 2 years to 31 March 2023 (metric 3).
- Submission of data for metric 3 data (capability) was only voluntary in 2019, and therefore this data is not considered representative of all trusts.
- Up until 2021, both the WDES (for metric 1) and the WRES (for indicator 1) allowed trusts to choose whether or not to include bank staff in their workforce figures. In 2023, the WRES team introduced a separate data collection, analysis and report of bank staff, so trusts were asked not to include this group in their WDES returns to ensure consistency of data.
- The numbers quoted in this report may have been rounded, and as such some difference calculations may appear incorrect.
Publication reference: PRN01174