
Introduction
1. Improving productivity is a key priority for the NHS, as part of the focus on delivering value-based healthcare. This is made clear in The 10 Year Health Plan, which states improving productivity as the central goal for the reforms set out. This means getting more out of what taxpayers put in – ensuring every pound makes the maximum contribution to better outcomes, lower inequality and economic growth. The Spending Review 2025 sets the NHS a target of delivering a 2% year-on-year productivity, so that, at a minimum, it returns to pre-pandemic levels of productivity by the end of the parliament.
2. Productivity is commonly measured by comparing outputs relative to inputs and is well-established in the wider economy. In healthcare, it can be summarised as the amount of activity the NHS delivers (appointments, scans, etc.) for the resources used in delivering that activity (on staff, consumables, buildings, etc).. Broadly speaking, increasing the volume of outputs by more than the volume of inputs leads to productivity growth, or maintaining output but with fewer inputs. It is important to measure these improvements, as it describes how public resources are utilised and may demonstrate the extent to which public services are delivering value-for-money.
3. This is then a focus of productivity based on inputs and outputs, which is common in other industries. Productivity could also be measured considering the outcomes those outputs are delivering, which in healthcare might mean understanding how far activity is improving the health status of patients. It could also adjust for how the activity is being delivered, for example if within a certain time frame. Some studies might also want to reflect on how ill health is being prevented looking at productivity from a much wider lens of how health provision is keeping people as healthy as possible, with less need for acute hospital care. These are all valid ways to consider what value is being derived on the resources available but will have different limitations in terms of the data and methodologies available. Any implied productivity estimate should be viewed in context of what it is intending to measure and, where possible, considered alongside other relevant measures.
4. It is clearly important that NHS organisations exhaust all opportunities available to tackle unnecessary waste and deliver as much activity as possible with the resources available. This is not about making staff work harder, for longer hours or giving them fewer resources to do their job. Short-term productivity growth might be measured by these means, but real benefits are sustained through long-term productivity growth over the next Parliament and beyond. For example, improving the effectiveness of information and communication technology (ICT) systems can reduce how much time clinicians need to spend on administration and increase the time they can spend treating patients.
5. Reliable measures of productivity can support organisations to track improvements and provide a potential benchmark, alongside others, to compare against similar providers. It can offer insight across both finance and operational performance, presenting something different to looking at an NHS trust’s financial balance or waiting times in isolation. It might also be argued the activity and resources of an NHS trust is more within their control, even after recognising systemic or structural factors. In the context of an ageing and growing population with increasing demands, estimating productivity growth doesn’t suppose that spending more money (even in real terms) is problematic, but that it is important to understand what is delivered for the resources spent. Importantly, productivity estimates can be more helpful in comparing the performance of each NHS trust against themselves, by estimating growth between two periods.
6. The Office for National Statistics (ONS) publishes an annual public service productivity estimate covering all service areas in the UK, including healthcare. This is viewed as the most comprehensive measure of NHS productivity, based on the activity included and the adjustments made for potential quality improvements. This measure captures public health services beyond those delivered by NHS trusts. The Centre for Health Economics (CHE) at the University of York publishes another well-established productivity measure focused on the NHS. The latest productivity estimates by the ONS and CHE were published in March and May 2025 respectively and these estimate productivity in healthcare for 2022/23, so broadly speaking both come with a two-year lag. These estimates are at a whole-NHS level, so cannot be broken down by NHS trust.
7. A monthly estimate of NHS productivity is produced by NHS England. This is management information that estimates the change in inputs and outputs for individual NHS trusts, as well as the productivity growth this implies. This NHS measure is based on development with the ONS and CHE, and they will continue to be engaged to ensure consistency with the annual national statistic. The experimental nature of this measure means it should be used with a full understanding of the current limitations, which are described in this document. Confidence in the estimate is expected to improve over time, as the understanding of what is being measured improves and attention is placed on the quality of the underlying data reported by NHS trusts.
8. This document describes the methodology used in 2025/26 to estimate productivity for all NHS trusts delivering patient care services. A full list of the organisations within scope is set out in Annex 2. The methodology includes approaches taken to estimate activity growth in acute, ambulance, community and mental health services, which is based on information collected from established data sources. Estimates for some NHS trusts include activity data collected across multiple services, which is described in more detail in the “integrated NHS trusts” section. Significant changes to the methodology are not expected to be made within the financial year and any changes will be reflected in updated versions of this document.
Summary of methodology
9. The methodology for estimating productivity growth is based on established approaches used in healthcare, as well as in other sectors. Broadly speaking, it compares growth in activity and the resources spent in delivering them for a specific NHS trust between two periods.
10. The methodology can be summarised as follows:
- Measuring outputs (weighted activity growth):
- Collecting raw activity counts reported by NHS trusts in established datasets
- Weighting this activity based on average unit costs, with some adjustments
- Measuring inputs (real terms resource growth):
- Collecting spending reported by NHS trusts in provider finance returns
- Adjusting these resources for inflation and to ensure the link to production
- Measuring productivity growth:
- Comparing activity growth with cost growth between two periods
11. Estimates are made for each NHS trust based on this methodology, covering acute, ambulance, community and mental health providers. Growth is compared between two periods on a year-to-date (YTD) basis within financial years. For example, if an NHS trust is estimated as having increased its activity by 10.0% from one year to the next and the resources used have increased by 5.0%, this would mean productivity has grown by 4.8% based on the calculation in Chart 1.
Chart 1 – Example productivity growth calculation

12. This can be interpreted as the NHS trust being 4.8% more productive, which might mean ~5% more care being delivered with the same resources compared to the previous year. If this same productivity growth was sustained for five consecutive years, it could potentially be treating ~25% more patients for the same resources compared to the original year. Changes in productivity growth are then impacted by changes in both outputs and inputs, which can make it more variable from year-to-year than other performance measures.
Measuring outputs
Activity delivered
13. Productivity estimates should capture units of output of meaningful value to patients, which requires a different approach to what may be taken in other public services. Patients will recognise the value of a package of care, for example a completed pathway from GP consultation, referral, outpatient first attendance, hospital procedure and outpatient follow-up. It is difficult though to measure this comprehensively across all NHS activity, so it is typical to focus on sub-units of NHS activity, which are still of meaningful value to patients. This means, for example, measuring an outpatient consultation or hospital procedure as a standalone output. This enables a useful measure of productivity to be captured, as well as attributing activity to different providers.
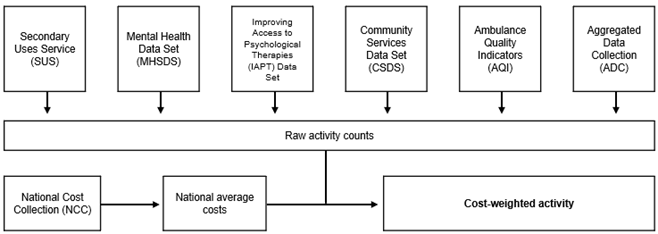
14. NHS trusts regularly report activity through several national data collections. This monthly data is used as the basis for measuring outputs in the NHS productivity estimate, as set out in Chart 2.
15. NHS-funded activity delivered by NHS trusts is included in the calculation, meaning changes in activity not funded by the NHS or else delivered by non-NHS organisations does not impact on estimates. The only exceptions are care contacts in community services, which may be funded by local authorities and are expected to be included in activity counts (and cost weights). Ongoing development work will continue to explore expanding the scope of NHS-funded activity, depending on the reliability of available data.
16. NHS activity delivered as part of subcontracting arrangements are expected to be reported by the contracting organisation. For example, where an NHS trust subcontracts activity to a non-NHS organisation the activity is assumed to be reported as delivered by the NHS trust. There is expected to be more variation in the subcontracting of mental health services, for example as part of NHS-led provider collaboratives. Ongoing development work will continue to review this issue.
Chart 2 – Data used for activity growth calculation
17. Many planned services, such as elective procedures, typically take place only on weekdays. However, most of NHS trust costs will not vary in the same way from month to month, or year to year. For example, a typical February has 20 of these days, while a typical March may have 22. This means an NHS trust could deliver 10% more planned activity in March compared to February, even though most resources such as salaries remain the same. Without adjusting for this, it could appear as if the NHS trust were 10% more productive, if comparing those across those months.
18. Therefore, the methodology removes this effect by adjusting for working days (WD). A similar adjustment is made for pure calendar days (CD) in unplanned services that typically take place seven days a week. These effects could be large even from one year the next, as Easter (and its associated bank holidays) can fall either side of the start of the financial year. The method taken for each category of activity is described in the tables below.
19. The specific datasets used to estimate activity across four broad types of services are as follows, including details on where more information can be found on how data is collected:
- Secondary Uses Service (SUS) through Standard Extract Mart (SEM) for acute and community services – Secondary Uses Service (SUS) – NHS England Digital
- Secondary Uses Service plus (SUS+) in the National Commissioning Data Repository (NCDR) for acute and community services – Secondary Uses Service (SUS) SUS+ replacement – NHS England Digital
- Specialist advice activity data in System Elective Recovery Outpatient Collection (S-EROC) for advice and guidance (A&G) – Statistics » Specialist advice activity data
- Mental Health Services Data Set (MHSDS) for mental health, learning disabilities and autism (MHLDA) services – Mental Health Services Data Set (MHSDS) – NHS England Digital
- Improving Access to Psychological Therapies (IAPT) Data Set for NHS Talking Therapies services – Improving Access to Psychological Therapies (IAPT) Data Set – NHS England Digital
- Community Services Data Set (CSDS) for community services – Community Services Data Set (CSDS) – NHS England Digital
- Ambulance Quality Indicators (AQIs) for ambulance services – Statistics » Ambulance Quality Indicators
- Integrated Urgent Care Aggregated Data Collection (IUC ADC) for 111 services – Statistics » Integrated Urgent Care
20. Tables 1 to 4 shows the categories for the raw activity count, the data source for these and detail on granularity used.
Table 1: Scope of activity included in output calculation (acute services)
| Category | Unit (WD/CD) | Source | Granularity |
|---|---|---|---|
| Ordinary electives and day case (specific acute) | Episodes (WD) | SUS / SUS+ | 5-character Healthcare Resource Group (HRG) |
| Regular elective admissions (specific acute) | Episodes (WD) | SUS / SUS+ | 5-character HRG |
| Non-elective (specific acute) | Episodes (CD) | SUS / SUS+ | 5-character HRG |
| A&E (types 1 to 4) | Attendances (CD) | SUS / SUS+ | 5-character HRG |
| Outpatient Excludes TFC 360 (Genitourinary Medicine Service), 812 (Diagnostic Imaging Service) and ambulatory care for outpatient first attendances | Attendances (WD) | SUS / SUS+ | Treatment Function Code (TFC), split by:Face-to-face (F2F) and non-F2FFirst and follow upConsultant-led (CL) and non-CLAcute-specific and community-like |
| Outpatient Excludes TFC 360 (Genitourinary Medicine Service) and 812 (Diagnostic Imaging Service) | Procedures (WD) | SUS | By HRG, for procedures not generating a non-outpatient attendance (WF) HRG |
| Maternity TFC 501 (Obstetrics Service) TFC 560 (Midwifery Service) TFC 424 (Well Baby Service) | Episodes (WD for electives, CD for non-electives) | SUS | HRG |
| Adult Critical Care | Bed days (CD) | SUS | Number of organs supported |
| Diagnostic and imaging Magnetic Resonance Imaging (MRI) Computed Tomography (CT) Non Obstetric Ultrasound (NOUS) | Episodes (WD) | DM01 | |
| Advice and Guidance (A&G) | Diverted pathways (WD) | S-EROC | Type of Specialist Advice – pre-referral Specialist Advice (e.g. A&G) |
Table 2: Scope of activity included in output calculation (ambulance services)
| Category | Unit | Source | Granularity |
|---|---|---|---|
| 999 Conveyance to Emergency Department (ED) Conveyance to non-ED No face-to-face response (hear and treat) Face-to-face incidents with no conveyance (see and treat) | Incidents (CD) | AQI | – |
| 111 complete sessions | Calls (CD) | IUC ADC | – |
Table 3: Scope of activity included in output calculation (community health services)
| Category | Method | Source | Granularity |
|---|---|---|---|
| Non-bedded | Care contacts (CD) | CSDS | Service type |
| Outpatient | Attendances (CD) | SUS+ | Treatment Function Code (TFC), split by face-to-face (F2F) and non-F2F, split by first and follow up, split by consultant-led (CL) and non-CL |
| Ordinary electives and day case | Episodes (CD) | SUS+ | 5-character HRG |
| Non-elective | Episodes (CD) | SUS+ | 5-character HRG |
| Urgent Treatment Centres (UTC) / Minor Injury Units (MIU) | Episodes (CD) | SUS+ | 5-character HRG |
Table 4: Scope of activity included in output calculation (MHLDA services)
| Category | Method | Source | Granularity |
|---|---|---|---|
| NHS Talking Therapies | Care contacts (WD) | IAPT | Appointment type, as captured in National Cost Collection (NCC). Some types are subdivided into high/low intensity. |
| Mental health community | Care contacts (WD) | MHSDS | Team type |
| Secure inpatient services | Bed days (CD) | MHSDS | Patient classification (bed type) |
| Non-secure inpatient services | Ward stays and additional bed days (CD) | MHSDS | Patient classification (bed type). Ward stays constructed for productivity calculation based on trim point of the 75th percentile length of stay for each bed type. Bed days beyond trim point receive discounted bed day activity unit (see below). Zero-day length of stay receives community activity unit. |
| Unknown inpatient services | Ward stays and additional bed days (CD) | MHSDS | This unknown activity is treated as non-secure inpatient services, so is treated on same basis as above. |
Data quality
21. Calculating outputs relies on the activity data reported by NHS trusts, which means the estimates on productivity are impacted by data quality. Activity data is also used for various purposes and is not collected with the specific intention of estimating productivity. Responsibility for the accuracy of data reported lies with the NHS trusts providing the data. Productivity estimates are in development and not yet fully developed, potentially with a wider degree of uncertainty. It is expected that data quality issues impacting on estimates will improve over time.
22. These issues are more noticeable at an individual NHS trust level, as it can be impacted by specific local factors or how activity is being reported by each organisation. This includes known issues relating to the implementation of new patient record or information systems, as well as more noticeable issues in community and mental health service data. NHS trusts will continue to be engaged on improving activity reporting used in calculating productivity, while future development work will explore how to manage specific issues. All estimates published should be treated with caution and with recognition of the potential limitations on data quality.
23. Some steps are taken in the calculation to address potential data quality issues, to minimise the effect of missing or invalid data. These are mostly focused on clear and obvious errors or gaps, which can be adjusted based on established statistical methods to support estimation.
24. These steps include:
- Replacing null figures in acute activity data for NHS trusts usually reporting each month. Estimation methods are based on averages in previous months, allowing for extrapolation and interpolation.
- Removing acute activity data appearing to be duplicate entries and reducing the risk of double counting across different areas. This is because activity data is aggregated and involves compress records with shared attributes.
25. It should be noted that NHS trusts can restate much of their activity data for some services in previously reported months, which can occur regularly within a financial year (and less commonly for previous financial years). It is not possible for NHS trusts to restate community service activity reported in CSDS or for NHS Talking Therapies data in IAPT. This means NHS trusts may change what they report as being delivered in a particular month as the year progresses and in-year productivity estimates can include restated activity data, as data for the financial year is refreshed in each month’s calculation. The estimate for one month on a year-to-date (YTD) basis may then be restated in future, reflecting changes in the underlying activity data.
26. Productivity growth estimates will be published first as “Provisional”, then as “Provisional Revised” in the following month and estimates for that month will not be restated in-year until the end of that financial year as “Final Revised”. For this reason, in-year productivity estimates should be viewed as provisional until the final restated values are published. A reporting timetable is set out later in this document with the full planned publication schedule (see Timetable in Reporting section). Restated activity can also be applied in future years, although this is expected to be much smaller and may be reflected in the baseline period.
27. There is a known issue in the reporting of non-elective activity relating to same day emergency care (SDEC), which is the provision of emergency care to patients on the day they present at a hospital who would otherwise be admitted. The reporting of SDEC activity has migrated in recent years from various data sources (including as Admitted Patient Care) to the Emergency Care Data Set (ECDS), and most NHS trusts are currently expecting to be submitting SDEC activity in version 4 of ECDS.
28. NHS trusts have been required to record SDEC activity to the ECDS and, as of April 2025, there were 95 sites reporting SDEC activity for 2024/25 in ECDS and, of those, 34 sites reported 2023/24 data. There is then expected to be distortions in comparing activity from one period to the another, where the reporting of data has moved from one dataset to another.
29. To account for this issue, non-elective activity is measured differently in the NHS productivity growth estimate to other acute services. This counts activity based on the following distinct pathways for patients:
- Non-elective activity ending with an A&E, Urgent Treatment Centre (UTC) or Minor Injury Unit (MIU) attendance
- Non-elective pathways with admittance for one or more nights of bed-based care
- Non-elective pathways ending with SDEC-type attendance
30. The first two pathways are broken down and costed using the HRG information available, which means the approach is broadly the same as other acute services described in the cost weighting section below. For the pathways ending with SDEC-type attendance, these are weighted using a single unit cost per pathway. Using this approach limits the ability to value this activity on the same basis as other acute services, however it provides a more consistent and reliable approach to managing the SDEC classification changes. Ongoing development work will continue to review this issue and aim to minimise any further impact.
31. To support the publication of this estimate, there will be a productivity data notification process allowing NHS trusts to highlight known issues with data being used to estimate productivity growth (see Productivity data notification process in Reporting section). Through this, NHS trusts can submit a notification on activity data for review. Issues raised will be investigated nationally and, where accepted, these will be documented alongside published estimates. In exceptional circumstances, underlying data may be amended for the purposes of estimating productivity growth.
Cost weighting
32. Activity data collected needs to be aggregated to estimate growth between two time periods. If raw activity counts are simply combined, this would imply different activity delivers the same value. For example, it would presume that increasing one unit of a complex surgery has the same value as one unit of a routine outpatient appointment.
33. Productivity estimates used in the private sector will generally use prices to weight output because this will reflect the value of those goods or services, based on what consumers are willing to pay for them. It is common for public sector productivity estimates to use cost weights when measuring output, including the methodology used by the ONS annual national statistic. This means assigning relative weights for different activities to ensure output growth accounts for differences in the relative values of different NHS activities.
34. It is worth noting that adjustments are made to reflect costs as a proxy of value. For example, a day case procedure for a specific 5-character HRG receives the same cost weight as an overnight elective stay for the same HRG. This reflects the fact that both activities are delivering the same output to patients (see Equalisation section below).
35. The NHS productivity growth estimate is intended to measure activity levels, which are not adjusted for how those services are delivered or the quality-of-life gain for an individual patient. For example, a hip or knee replacement (with the same complexity and for the same patient comorbidities) is treated the same regardless of the improvement in quality of life it gives to the patient. Similarly, ambulance incidents are counted without reflecting how quickly they were responded to. It may require additional resources to deliver these outcomes, and they are likely valued by patients, as well as the health system overall. However, data limitations make it difficult to capture this fully within the current measure at a trust level.
36. The ONS annual measure makes some quality adjustments in this way, at an aggregate level. Historically, the average effect of these adjustments has been to increase overall NHS productivity growth by around 0.4% points per year up to the start of the Covid pandemic. Although, in the latest estimate (2021/22 to 2022/23) the quality adjustment reduces headline productivity growth by 0.2% points. Ongoing development work will explore this further, but quality adjustments are not included in the methodology for the NHS measure for 2025/26.
37. NHS cost data are used in the productivity methodology, so that raw activity counts are multiplied by the national average cost for that activity and resulting in a cost weighted activity value. These national average costs are based on the data submitted to the NCC by all NHS trusts.
38. For most activity, there is a direct mapping between the activity data reported and the costs in the NCC. Acute activity is reported by NHS trusts based on finished consultant episodes (FCEs), which relates to time spent in the continuous care of one consultant. These episodes can be finished due to discharge, death or transfer to another consultant. Activity in this productivity estimate is counted and weighted based on acute episodes, which is consistent with the approach used by the ONS in national statistics. Patients may have multiple episodes during one hospital spell, for example if they are under the care of different consultants during one spell. Recent reporting indicates that activity by episode may be growing differently to spells. Ongoing development work will continue to review the weighting of acute.
39. National average costs are used to weight activity, rather than the specific weights that might be calculated for each individual NHS trusts. This is because the intention is to capture the value of what each NHS trust produces, so that the value of a complex surgery, for example, is the same regardless of where it is provided. These cost weights will closely align with most nationally published prices (where available), as the same costs are the basis for those prices, but in most cases, they will not be the same value. As highlighted, non-elective pathways ending with SDEC-type attendance are weighted using a single unit cost per pathway to manage classification issues with SDEC activity.
40. A bespoke approach is used to cost weight inpatient mental health services, which is where patients are admitted into hospitals due to severe mental health problems. This is because length of stay in these services is often more variable and the measure intends to avoid over-valuing longer lengths of stay. For non-secure beds (and unknown inpatient beds), activity is valued per ward stay up to a normal spell length and each bed day beyond this trim point is then discounted, so that excess bed days are valued at half the average cost. Trim points are set for each ward type based on the national upper quartile length of stay. This approach aims to more accurately value shorter length of stays, capturing the benefits of discharging patients as soon as is clinically reasonable. For secure beds, activity is counted and weighted based on bed days to recognise the diverse needs and situations of this population, in which some services are expected to provide long term care lasting months or years.
41. The cost weighting of activity relies on accurate coding in the relevant data sets. Where activity is not coded, and a specific cost weight is unable to be applied then a higher-level average cost will be used. For example, any community health services data reported in CSDS without a service type code is weighted using national average costs for all services.
42. The latest published costing data is for 2023/24, and this version is used in weighting activity across all services. Costing data for 2024/25 has recently been published and this will be reviewed and tested before being used in the calculation. This methodology document will be updated for any changes in costing data used to weight activity and cost weights will be published alongside this estimate.
43. Table 5 gives a simplified example to explain how cost weighting works with two departments delivering different services. Activity is valued at the same costs in each year and growth is higher in Department 1. However, activity in Department 2 has a higher value, so cost-weighted growth is 8%. In the NHS productivity growth measure, unit costs are based on national averages and applied to each organisation’s case-mix.
Table 5: Example of cost weighted activity calculation
| Row | Category | 2024/25 | 2025/26 | Growth |
|---|---|---|---|---|
| A | Activity delivered by Department 1 | 10 | 12 | 20% |
| B | Unit costs in Department 1 (based on cost data) | £100 | £100 | – |
| C | Activity delivered by Department 2 | 20 | 21 | 5% |
| D | Unit costs in Department 2 (based on cost data) | £200 | £200 | – |
| E = A * B | Cost-weighted activity in Department 1 | £1,000 | £1,200 | 20% |
| F = C * D | Cost-weighted activity in Department 2 | £4,000 | £4,200 | 5% |
| G = E + F | Total (cost-weighted activity) | £5,000 | £5,400 | 8% |
Equalisation
44. Cost data serve as a proxy for value, however weighting activity in this way can result in nullifying a key element of productivity improvement. This would be where an NHS trust replaces higher cost services for a lower cost alternative, while delivering the same outcome.
45. For example, a hospital might move the treatment of non-complex knee replacements from an elective overnight to a day surgery. Both achieve the same outcome for a patient, so should have the same value and attract the same cost weight. Elective overnight surgery would be expected to have a higher unit cost compared to a day case, based on cost data submitted by NHS trusts. If cost weights are not equalised, this would mean switching a patient from overnight to day case would receive a lower weight in the output calculation and could then underestimate the productivity growth this delivers. It will show cost-weighted activity reducing, and might even suggest productivity is falling, depending on the difference in costs.
45. Methods are used to account for this, by equalising unit costs for equivalent treatments across different modes of provision, to reflect where they typically deliver the same outcome for patients. These equalised weights are based on combining costs and activity data across different service categories within each HRG. This approach generates a new unit cost, which is the weighted average of the previously separate elements, reflecting both higher and lower cost modes of care.
47. Table 6 gives a simplified example to explain how cost weight equalisation works with two services delivering the same outcome. Activity in Service 1 (the cheaper service) increases by the same number as reducing in Service 2 (the more expensive service). Across both services activity remains the same and, as indicated, outcomes are also constant. Cost weighting in the usual way suggests activity fell by 13% (in G), however equalising the cost weights (in H) instead estimates activity growth at 0% (in K). This reflects from an activity perspective that nothing is expected to have changed, which combined with lower costs should result in improved productivity. Without equalising the cost weights, output would fall and the improvements from moving to lower cost modes of provision would fail to be captured in the productivity measure.
Table 6: Example of cost weighted activity calculation, with equalisation
| Row | Category | 2024/25 | 2025/26 | Growth |
|---|---|---|---|---|
| A | Activity delivered in Service 1 | 15 | 18 | 20% |
| B | Unit costs in Department 1 (based on cost data) | £100 | £100 | – |
| C | Activity delivered by Service 2 | 15 | 12 | – 20% |
| D | Unit costs in Department 2 (based on cost data) | £500 | £500 | – |
| E = A * B | Cost-weighted activity in Service 1 | £1,500 | £1,800 | 20% |
| F = C * D | Cost-weighted activity in Service 2 | £7,500 | £6,000 | – 20% |
| G = E + F | Total (cost-weighted activity) | £9,000 | £7,800 | – 13% |
| H | Equalised cost weights (across both services) | £300 | £300 | – |
| I = A * H | Cost-weighted activity in Service 1 – equalised | £4,500 | £5,400 | 20% |
| J = C * H | Cost-weighted activity in Service 2 – equalised | £4,500 | £3,600 | – 20% |
| K = I + J | Total (cost-weighted activity) – equalised | £9,000 | £9,000 | 0% |
48. This method of equalising unit costs is applied in the following areas:
- Elective day cases and ordinary electives, and outpatient procedures for a given HRG (this is for a list of 143 HRGs where the national tariff is the same)
- Elective day cases, regular day or night admission (RDNA) and ordinary electives
- Non-elective long and short stay spells, for a given HRG
- A&E attendances by department (e.g. type 1, 2, 3 or 4), for a given A&E HRG
- Outpatient attendances in all delivery types and CL and non-CL for a given TFC. First and follow up activity are valued separately.
- Advice and guidance (A&G) diverted pathways are valued at the average cost of a first outpatient attendance
- Zero-day length of stay mental health inpatients valued as the same as mental health community contact
- Ambulance 999 services, across conveyances, see and treat and hear and treat
49. Unit costs are standardised to eliminate illogical relativities. For example, if within a HRG root (4-character HRG) a more complex 5-character HRG has a lower average cost than a less complex 5-character HRG, the two 5-character HRGs are combined into one cost weight. This is more prevalent in HRGs with low numbers where the distribution of submitted costs at HRG level overlap.
Measuring inputs
Resources spent
50. Productivity is the ratio of the units of output delivered relative to the units of input. These units would ideally be the number of different types of staff, number of diagnostic imaging machines, beds or clinical goods. These are though very difficult to capture. As a result, this methodology takes spending of all inputs as a proxy for their number. As unit costs typically rise over time due to inflation and national wages increase, these resources are deflated to ensure they remain an appropriate proxy for the physical inputs used in the NHS.
51. NHS trusts report monthly spending through Provider Financial Returns (PFRs), and this is the basis for measuring inputs in the productivity estimate. Monthly spending reporting follows NHS accounting standards, and this indicates resources associated with delivering the activity estimated. The main scope of these resources is spending reported in NHS trust operating expenses, which covers most day-to-day spending.
52. Operating expenditure reported by NHS trusts includes the central employer pension contributions, which are paid on behalf of employers to the NHS Pension Scheme (NHSPS). This spending is added nominally to NHS trusts accounts at Month 12 and these resources are relevant to measuring employer on-costs for staff, even if paid on their behalf by another organisation. Changes in resources spent from year-to-year will relate to factors relevant to productivity, such as change in staff numbers and skill mix.
53. NHS trust operating expenses won’t fully capture the resources spent in delivering services and may also include spending on delivering services not in scope of the productivity estimate. This is because spending is captured for accounting purposes for the whole organisation and is not necessarily aligned to the activity used to measure NHS productivity. There is additional granularity in PFRs that can be used in some cases, but this still doesn’t capture monthly spending at a HRG level, for example. Annual costing data used to weight activity data is collected at this granular level and this quantum is mapped backed by NHS trusts to audited financial accounts.
54. The methodology for estimating input growth includes adjustments to ensure appropriate resources are counted, as relating to the relevant scope of activity. These adjustments apply across all NHS trusts in the methodology and are based on a review of the spending reported in the PFR. Chart 3 summarises the adjustments made.
55. When applying adjustments, a key principle is that input resources should be included where it is reasonable to expect these are being spent by the NHS trust to deliver the activity in scope for the relevant period. This makes clear the link between inputs and outputs, so a change in the former should bring about change in the latter.
56. Most resources captured directly relate to activity delivered – for example, pay spending on doctors and nurses delivering patient care. Resources can though be indirect and are supporting the delivery of services in a more diffused way, such as back office or other corporate functions. The methodology intends to include as much of the reported spending as possible while reducing material distortions caused by changes, where this is not a true reflection of productivity. Data used to adjust resources also needs to be reliable and consistently reported monthly, which for the most part should be from the PFRs.
Chart 3 – Data used for cost growth calculation
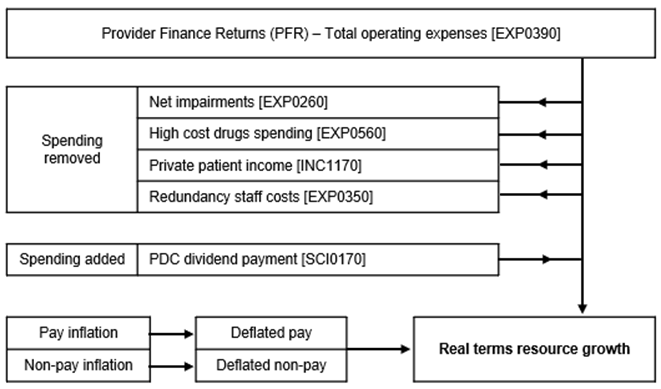
57. The methodology removes net impairments, which is an accounting adjustment reflecting the reduced value of assets. These resources do not relate to service delivery that are excluded from national costing and changes from year-to-year can be significant at an NHS trust level. These resources are therefore removed to prevent a material distortion that is not relevant to measuring productivity.
58. A significant challenge in estimating NHS productivity, mostly within acute services, is the treatment of high cost drugs spending. High cost drugs (and devices) are excluded from national costing and payments, as these are instead funded to NHS trusts directly through commissioners (usually on a pass-through basis). This is because their use is concentrated in a relatively small number of centres, rather than evenly across all NHS trusts carrying out activity in the relevant HRGs. It is therefore not possible to capture the value of these medicines in the activity estimate, as the resources have been excluded.
59. PFRs include data on high costs drugs (not devices), which does enable most of the spending to be captured. However, there are known issues in the monthly spending data being reported, of which the most prominent is the implementation of electronic patient record (EPR) systems. Ideally, high cost drugs would be captured as activity and a method has been tested using spending data to proxy for activity. This however appears volatile monthly and can significantly distort estimates at an NHS trust level, mostly due to the EPR issues identified. Therefore, the approach taken is to remove high cost drugs spending (based on reported spending data) from the estimates of resources. While this doesn’t fully resolve the issue relating to distortion, it is expected to reduce the impact across the wider cost data (rather than activity data). Ongoing development work will continue to review this issue.
60. Resources associated with delivering services for private patients are removed, which relates to services not captured in NHS activity data. This can create a distortion, if there is a significant change from year-to-year in how many private patients are seen by an NHS trust. These resources cannot be removed directly, as they are not separately reported and income data is used instead as a proxy. This may not fully reflect margins obtained in private patient services although this is less impacted when considering resources from one period to the next. Any distortion caused by making this adjustment is expected to be smaller than by not making the adjustment.
61. Finally, the resources spent on redundancy staff costs are removed as these can also create a distortion from one year to the next.
62. Spending on public dividend capital (PDC) dividend payments is added to the input calculation, relating to requirements in line with the costs of capital. This spending is not reported as operating expenditure, rather cash flows from financing activities. Changes in these resources are broadly stable and including them intends to reflect that interim support will be used to support service delivery. These resources are therefore added and not expecting to create a material distortion, which in any case may be relevant to measuring productivity. Ongoing development will continue to review the adjustments in calculating inputs.
Data quality
63. Finance data reported monthly is unaudited, which means it is not validated by an independent external auditor. It should be treated with caution on that basis. Once submitted, data in the PFR cannot be restated. No additional steps are taken to proactively address potential data quality issues for the purposes of the productivity estimates, although issues may be raised locally as part of the reporting process.
64. To support the publication of this estimate, there will be a productivity data notification process allowing NHS trusts to highlight known issues with data being used to estimate productivity growth (see Productivity data notification process in Reporting section). Through this, NHS trusts can submit a notification on spending data for review. Issues raised will be investigated nationally and, where accepted, these will be documented alongside published estimates. In exceptional circumstances, underlying data may be amended for the purposes of estimating productivity growth.
Deflating resources
65. Estimated resources are adjusted to enable appropriate comparisons between two periods, which is based on a judgement on what this productivity estimate is intended to measure. It is usual to adjust spending by some measure of inflation, which relates to the change in the price of goods and services that impacts on purchasing power. If inflation
66. For example, the market price of a good might increase by 10% due to wider economic factors, which means the spending on that good increases by 10%. This increase would not be due to any factors in the purchaser’s control, such as how they negotiate those prices, and would then show as resource growth to reduce their productivity. Deflating resources means removing the 10% growth, so this productivity estimate is focused on what is intended to be measured.
67. This NHS productivity growth estimate deflates total pay costs by a measure of pay inflation, including substantive, agency and bank pay. Pay inflation is caused by headline pay awards made each year by the Government, which increases the contractual requirement on employers. Separate pay awards are made to different staff groups – for medical staff, this includes consultants, resident doctors, specialty doctors and associate specialists. Pay awards are also made to non-medical staff employed on Agenda for Change terms and conditions.
68. Inflation is estimated based on the average pay award uplifts in each of these staff groups. Where the pay award is uniform, there would be a single uplift across all spine points. However, if there are different uplifts in different spine points, or the uplift is a single amount for all staff, a national weighted average is calculated for the inflation estimate. Uplifts used in this NHS productivity estimate align with assumptions used in the NHS financial framework, for example allocations and the NHS Payment System.
69. Some pay awards can also include back pay for previous financial years that are paid to staff in the current financial year. In recent years, NHS trusts have been funded for this through direct payments by NHS England. This spending is also deflated based on a national estimate of the average uplift to the relevant pay for that staff group, which will align with national assumptions in the NHS financial framework.
70. There may also be one-off pay inflation that needs to be deflated in addition to pay awards. This includes increases in employer pay costs, such as an increase in the employer national insurance or employer pension contribution rates. National average estimates are used to deflate for these costs, which align with national assumptions in the NHS financial framework.
71. Non-pay inflation is generally driven by price changes, including those common in delivering health services. High cost drug spending is excluded from the resource growth calculation and the remaining drug spending is deflated by GDP deflator, which is a proxy for economic-wide inflation used by the Government for public spending. GDP deflator forecasts for the current year are published by HM Treasury regularly and the latest published version are used in the calculation.
72. Most non-pay spending is then deflated by either the Consumer Price Index (CPI) or the Retail Price Index (RPI), based on a judgement on which is most appropriate for different accounting lines. Other measures considered in this measure are producer price inflation (PPI), services producer price inflation (SPPI) and construction output price inflation (COPI).
Integrated NHS trusts
73. Some NHS trusts deliver services across acute and non-acute settings, as well as some delivering both community and mental health services. For these NHS trusts, activity data is collected from different data sets and used to estimate output growth for the NHS trust. These outputs are cost-weighted using NCC data, however growth is calculated separately and aggregated for an NHS trust-level estimate. In doing so, different calculation methods are used for respective activity, and this should be considered when interpreting estimates.
Reporting
Data issue notification
74. Some data used in the calculation may include errors NHS trusts are unable to restate in future months. As highlighted, NHS trusts will be able to raise issues with the underlying data used to estimate productivity growth and to also identify where the methodology used is unable to account for specific circumstances. Issues can be raised through a notification form created for this purpose. These issues will be reviewed centrally and discussed with the relevant regional team, as well with the NHS trust directly. It is important for the credibility of productivity growth estimates to understand known errors in the data used and limitations in the methodology, while ensuring the focus is on improving reporting directly.
75. Where an issue is clearly identified, a note on this may be published alongside this productivity estimate and users will be guided on how they should interpret the estimate appropriately. This could also result in the estimate for a specific NHS trust being excluded from the aggregation used to estimate productivity growth across all NHS trusts or a specific type of NHS trust. In limited circumstances, productivity estimates may be amended. This would only be for the purposes of assessing productivity and would not change reporting to national datasets.
76. Issues raised should be specifically focused on the three groups of data used for estimating productivity, namely monthly activity data (as described in the Activity delivered section), annual costing data (as described in the Cost weighting section) and monthly spending data (as described in the Resources spent section). Similarly, issues raised on the methodology should focus on specific circumstances to the NHS trust impacting on the productivity estimate. This full methodology document should be reviewed before any new issues are raised.
77. Data issues that may be considered as part of this process include:
- Clear and obvious errors in how specific data has been reported. For example, this might include where two figures have been reported in the wrong place and would be resolved by switching them around, if the NHS trust were able to restate the data.
- Local circumstances significantly outside the assumptions set out in this methodology. For example, this might include where an adjustment is not made in the estimates of resource use and local data can demonstrate the NHS trust varying widely from the average position.
- Errors expecting to have a material impact on the productivity growth estimate. As a minimum, this is broadly measured to one decimal place and any impacts smaller than 0.5% are not generally seen as being material. These may though still be reviewed on basis of potential wider impacts.
- Data reported in either the current year (2025/26) or the previous year (2024/25). These are the two main periods where data is being used to estimate productivity growth in this estimate, so any errors in data before these years should not be notified.
- Errors in which the correct data is simple to resolve due to the availability of reliable data to show the error and what a corrected figure would be, or at least where there is good information on a reliable estimate.
78. Data quality is expected to improve as productivity estimates are published and through further engagement with NHS trusts on the data being reported.
Quality assurance
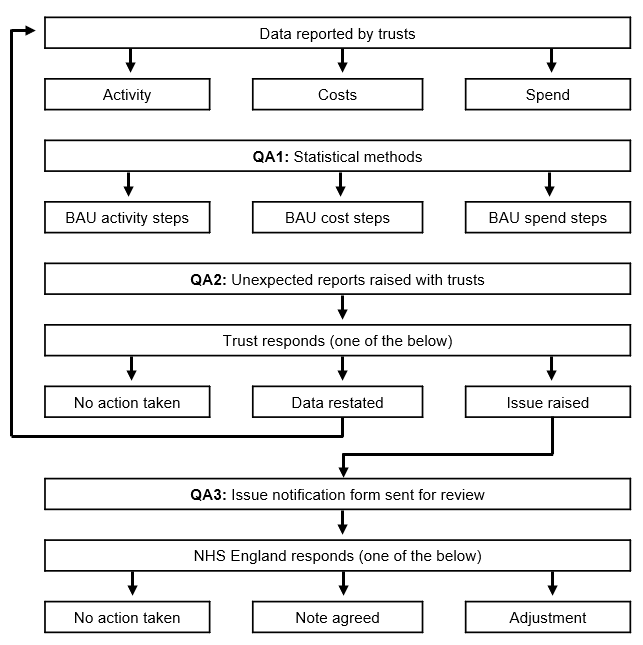
79. The data issue notification sits within an overall process for assuring productivity estimates. This is summarised in Chart 4 below and set out in more details in the following paragraphs.
80. The first step should take place before NHS trusts report to national datasets. As noted, the primary responsibility for data quality sits with the reporting NHS trusts and steps should already be in place to assure the quality of what is being reported.
81. Reported data can be assessed nationally and statistical methods may be applied (QA1), depending on the dataset. As set out in this document, some acute and community activity data is adjusted to replace null figures and to remove data appearing to be duplicate. Other dataset may also apply steps before this data is used for the productivity calculation.
82. Data used to estimate productivity is analysed on a summary basis to identify any atypical reporting. This generally looks at the data from two dimensions:
- Are there significant outliers within a particular sample of data? For example, in a specific month, data reported by a specific NHS trust that significantly deviates from the sample average.
- Are there significant changes for an NHS trust from one period to the next? For example, data reported by a specific NHS trust in one month that significantly vary to the data reported by that same NHS trust in the previous month, which is not expected.
83. Based on the above, data used for the productivity estimates may be highlighted as a potential error. These potential errors will be raised with NHS trusts on a regular basis, so they are aware (QA2). Based on this, trusts may choose to respond in one of three ways:
- No action taken – NHS trust may confirm it is not an error and reflects real changes in services or in their organisations.
- Data restated – NHS trust may identify an error and correct for this by restating their data in future months
- Issue raised – NHS trust may identify an issue that cannot be restated and raise it through the notification form
84. NHS England will review the issues raised and may look to engage with the NHS trust directly to discuss. Based on this review, NHS England may choose to respond in one of three ways:
- No action taken – NHS England may confirm it is not an issue requiring any further action nationally
- Note agreed – NHS England may agree to include a contextual note alongside future published estimates to guide the user on how the estimate should be interpreted
- Adjustment – NHS England may agree to adjust the productivity estimate upon reviewing the issue and based on any additional data or information provided by the NHS trust
85. This process is aimed to take place as quickly as possible, so that issues can be addressed promptly. Where an issue is under review, a note may be provided alongside the published estimates to highlight this and that future estimates may restate these figures.
Chart 4 – Data used for cost growth calculation
Headline estimate
86. Productivity growth is estimated based on the calculation in chart 5 below. Estimates are on a monthly year-to-date (YTD) basis, up to the final estimate for the financial year at M12 YTD. Productivity growth is based on comparing two time periods on the same basis, for example M3 YTD for 2025/26 estimates productivity-based activity and resource growth for April to June 2025 compared to April to June 2024.
Chart 5 – Productivity growth calculation

87. Estimates published each month may include restated data for previous months, where estimates have already been published. For this reason, monthly estimates are provisional and the final estimate for each month will not be stated until the end of the financial year.
88. Adjustments are made to account for any mergers between the two comparison periods. These will usually mean aggregate activity and resource data reported by separate entities in the previous period and comparing to combined data in the most recent period.
89. NHS trust level estimates of input and output growth are published as part of the productivity estimate. These individual estimates can be aggregated to give an estimate across all NHS trusts, or else a group of NHS trusts including acute, ambulance, community and mental health provider types. An estimate of productivity in an NHS system might also aggregate NHS trusts mapped to that system for financial planning purposes; however, this won’t fully reflect commissioning flow across different systems.
90. An estimate of productivity growth across all NHS trusts may remove estimates that are more than one standard deviation from the unweighted mean. Any adjustments for the purpose of aggregating NHS trust estimates will clearly set out any adjustments for outliers.
Timetable
91. The NHS productivity growth estimate is published from 12 February 2026, starting with Month 7 YTD. This productivity estimate includes measures of output growth, input growth and headline productivity growth for all NHS trusts. Estimates are published monthly, and an internal cut-off date is set two weeks prior from which no additional data will be used. Estimates are on a year-to-date (YTD) basis and growth is compared to the same period from the previous year.
92. Estimates are published first as “Provisional”, then as “Provisional Revised” in the following month and estimates for that month will not be updated again in-year until the end of that financial year as “Final Revised”. For this reason, in-year productivity estimates should be viewed as provisional until the final restated values are published. A full schedule of publication dates for each month of 2025/26 is set out in table 7 below.
Table 7: Publishing timetable, 2025/26
| Estimate | Period | Provisional | Provisional revised | Final revised |
|---|---|---|---|---|
| M6 YTD | April 2025 to September 2025 | – | 12 February 2026 | 13 August 2026 |
| M7 YTD | April 2025 to October 2025 | 12 February 2026 | 12 March 2026 | 13 August 2026 |
| M8 YTD | April 2025 to November 2025 | 12 March 2026 | 16 April 2026 | 13 August 2026 |
| M9 YTD | April 2025 to December 2025 | 16 April 2026 | 14 May 2026 | 13 August 2026 |
| M10 YTD | April 2025 to January 2026 | 14 May 2026 | 11 June 2026 | 13 August 2026 |
| M11 YTD | April 2025 to February 2026 | 11 June 2026 | 9 July 2026 | 13 August 2026 |
| M12 YTD | April 2025 to March 2026 | 9 July 2026 | 13 August 2026 | 13 August 2026 |
Annex 1: Abbreviations
Below is a summary of abbreviations used in the methodology document.
| A&E | Accident and Emergency |
| APC | Admitted Patient Care |
| A&G | Advice and Guidance |
| ADS | Ambulance Data Set |
| AQI | Ambulance Quality Indicators |
| CD | Calendar Day |
| CHE | Centre for Health Economics |
| CSDS | Community Services Data Set |
| CT | Computed Tomography |
| CL | Consultant-Led |
| CPI | Consumer Price Index |
| E&T | Education and Training |
| EPR | Electronic Patient Record |
| FCE | Finished Consultant Episodes |
| ED | Emergency Department |
| F2F | Face-to-Face |
| GAAP | Generally Accepted Accounting Principles |
| GDP | Gross Domestic Product |
| HRG | Healthcare Resource Group |
| IAPT | Improving Access to Psychological Therapies |
| IAS | International Accounting Standard |
| ICT | Information and Communication Technology |
| IFRS | International Financial Reporting Standard |
| IUC ADC | Integrated Urgent Care Aggregated Data Collection |
| MRI | Magnetic Resonance Imaging |
| MHSDS | Mental Health Services Data Set |
| MHLDA | Mental Health, Learning Disabilities and Autism |
| MIU | Minor Injury Unit |
| NCDR | National Commissioning Data Repository |
| NCC | National Cost Collection |
| NHSPS | NHS Pension Scheme |
| NOUS | Non Obstetric Ultrasound |
| ONS | Office for National Statistics |
| PFI | Private Finance Initiative |
| PFR | Provider Financial Returns |
| PDC | Public Dividend Capital |
| R&D | Research and Development |
| RDNA | Regular Day or Night Admission |
| RPI | Retail Price Index |
| SDEC | Same Day Emergency Care |
| SUS | Secondary Uses Service |
| SUS+ | Secondary Uses Service plus |
| SEM | Standard Extract Mart |
| S-EROC | System Elective Recovery Outpatient Collection |
| TFC | Treatment Function Code |
| UTC | Urgent Treatment Centre |
| WD | Working Day |
| WF | Non-Outpatient Attendance |
| YTD | Year-To-Date |
Annex 2: NHS trusts in 2025/26
The following organisations are included in the NHS productivity growth estimate, which are providers delivering patient care services.
- Airedale NHS Foundation Trust
- Alder Hey Children’s NHS Foundation Trust
- Ashford and St Peter’s Hospitals NHS Foundation Trust
- Avon and Wiltshire Mental Health Partnership NHS Trust
- Barking, Havering and Redbridge University Hospitals NHS Trust
- Barnet, Enfield and Haringey Mental Health NHS Trust
- Barnsley Hospital NHS Foundation Trust
- Barts Health NHS Trust
- Bedfordshire Hospitals NHS Foundation Trust
- Berkshire Healthcare NHS Foundation Trust
- Birmingham and Solihull Mental Health NHS Foundation Trust
- Birmingham Community Healthcare NHS Foundation Trust
- Birmingham Women’s and Children’s NHS Foundation Trust
- Black Country Healthcare NHS Foundation Trust
- Blackpool Teaching Hospitals NHS Foundation Trust
- Bolton NHS Foundation Trust
- Bradford District Care NHS Foundation Trust
- Bradford Teaching Hospitals NHS Foundation Trust
- Bridgewater Community Healthcare NHS Foundation Trust
- Buckinghamshire Healthcare NHS Trust
- Calderdale and Huddersfield NHS Foundation Trust
- Cambridge University Hospitals NHS Foundation Trust
- Cambridgeshire and Peterborough NHS Foundation Trust
- Cambridgeshire Community Services NHS Trust
- Camden and Islington NHS Foundation Trust
- Central and North West London NHS Foundation Trust
- Central London Community Healthcare NHS Trust
- Chelsea and Westminster Hospital NHS Foundation Trust
- Cheshire and Wirral Partnership NHS Foundation Trust
- Chesterfield Royal Hospital NHS Foundation Trust
- Cornwall Partnership NHS Foundation Trust
- Countess of Chester Hospital NHS Foundation Trust
- County Durham and Darlington NHS Foundation Trust
- Coventry and Warwickshire Partnership NHS Trust
- Croydon Health Services NHS Trust
- Cumbria, Northumberland, Tyne and Wear NHS Foundation Trust
- Dartford and Gravesham NHS Trust
- Derbyshire Community Health Services NHS Foundation Trust
- Derbyshire Healthcare NHS Foundation Trust
- Devon Partnership NHS Trust
- Doncaster and Bassetlaw Teaching Hospitals NHS Foundation Trust
- Dorset County Hospital NHS Foundation Trust
- Dorset Healthcare University NHS Foundation Trust
- Dudley Integrated Health and Care NHS Trust
- East And North Hertfordshire NHS Trust
- East Cheshire NHS Trust
- East Kent Hospitals University NHS Foundation Trust
- East Lancashire Hospitals NHS Trust
- East London NHS Foundation Trust
- East Midlands Ambulance Service NHS Trust
- East of England Ambulance Service NHS Trust
- East Suffolk and North Essex NHS Foundation Trust
- East Sussex Healthcare NHS Trust
- Epsom and St Helier University Hospitals NHS Trust
- Essex Partnership University NHS Foundation Trust
- Frimley Health NHS Foundation Trust
- Gateshead Health NHS Foundation Trust
- George Eliot Hospital NHS Trust
- Gloucestershire Health and Care NHS Foundation Trust
- Gloucestershire Hospitals NHS Foundation Trust
- Great Ormond Street Hospital for Children NHS Foundation Trust
- Great Western Hospitals NHS Foundation Trust
- Greater Manchester Mental Health NHS Foundation Trust
- Guy’s and St Thomas’ NHS Foundation Trust
- Hampshire Hospitals NHS Foundation Trust
- Harrogate and District NHS Foundation Trust
- Herefordshire and Worcestershire Health and Care NHS Trust
- Hertfordshire Community NHS Trust
- Hertfordshire Partnership University NHS Foundation Trust
- Homerton Healthcare NHS Foundation Trust
- Hull University Teaching Hospitals NHS Trust
- Humber Teaching NHS Foundation Trust
- Imperial College Healthcare NHS Trust
- Isle of Wight NHS Trust
- James Paget University Hospitals NHS Foundation Trust
- Kent and Medway NHS and Social Care Partnership Trust
- Kent Community Health NHS Foundation Trust
- Kettering General Hospital NHS Foundation Trust
- King’s College Hospital NHS Foundation Trust
- Kingston and Richmond NHS Foundation Trust
- Lancashire and South Cumbria NHS Foundation Trust
- Lancashire Teaching Hospitals NHS Foundation Trust
- Leeds and York Partnership NHS Foundation Trust
- Leeds Community Healthcare NHS Trust
- Leicestershire Partnership NHS Trust
- Lewisham and Greenwich NHS Trust
- Lincolnshire Community Health Services NHS Trust
- Lincolnshire Partnership NHS Foundation Trust
- Liverpool Heart and Chest Hospital NHS Foundation Trust
- Liverpool University Hospitals NHS Foundation Trust
- Liverpool Women’s NHS Foundation Trust
- London Ambulance Service NHS Trust
- London North West University Healthcare NHS Trust
- Maidstone and Tunbridge Wells NHS Trust
- Manchester University NHS Foundation Trust
- Medway NHS Foundation Trust
- Mersey and West Lancashire Teaching Hospitals NHS Trust
- Mersey Care NHS Foundation Trust
- Mid and South Essex NHS Foundation Trust
- Mid Cheshire Hospitals NHS Foundation Trust
- Mid Yorkshire Teaching NHS Trust
- Midlands Partnership NHS Foundation Trust
- Milton Keynes University Hospital NHS Foundation Trust
- Moorfields Eye Hospital NHS Foundation Trust
- Norfolk and Norwich University Hospitals NHS Foundation Trust
- Norfolk and Suffolk NHS Foundation Trust
- Norfolk Community Health and Care NHS Trust
- North Bristol NHS Trust
- North Cumbria Integrated Care NHS Foundation Trust
- North East Ambulance Service NHS Foundation Trust
- North East London NHS Foundation Trust
- North Staffordshire Combined Healthcare NHS Trust
- North Tees and Hartlepool NHS Foundation Trust
- North West Ambulance Service NHS Trust
- North West Anglia NHS Foundation Trust
- Northampton General Hospital NHS Trust
- Northamptonshire Healthcare NHS Foundation Trust
- Northern Care Alliance NHS Foundation Trust
- Northern Lincolnshire and Goole NHS Foundation Trust
- Northumbria Healthcare NHS Foundation Trust
- Nottingham University Hospitals NHS Trust
- Nottinghamshire Healthcare NHS Foundation Trust
- Oxford Health NHS Foundation Trust
- Oxford University Hospitals NHS Foundation Trust
- Oxleas NHS Foundation Trust
- Pennine Care NHS Foundation Trust
- Portsmouth Hospitals University NHS Trust
- Queen Elizabeth Hospital King’s Lynn NHS Foundation Trust
- Queen Victoria Hospital NHS Foundation Trust
- Rotherham Doncaster and South Humber NHS Foundation Trust
- Royal Berkshire NHS Foundation Trust
- Royal Cornwall Hospitals NHS Trust
- Royal Devon University Healthcare NHS Foundation Trust
- Royal Free London NHS Foundation Trust
- Royal National Orthopaedic Hospital NHS Trust
- Royal Papworth Hospital NHS Foundation Trust
- Royal Surrey NHS Foundation Trust
- Royal United Hospitals Bath NHS Foundation Trust
- Salisbury NHS Foundation Trust
- Sandwell And West Birmingham Hospitals NHS Trust
- Sheffield Children’s NHS Foundation Trust
- Sheffield Health and Social Care NHS Foundation Trust
- Sheffield Teaching Hospitals NHS Foundation Trust
- Sherwood Forest Hospitals NHS Foundation Trust
- Shropshire Community Health NHS Trust
- Somerset NHS Foundation Trust
- South Central Ambulance Service NHS Foundation Trust
- South East Coast Ambulance Service NHS Foundation Trust
- South London and Maudsley NHS Foundation Trust
- South Tees Hospitals NHS Foundation Trust
- South Tyneside and Sunderland NHS Foundation Trust
- South Warwickshire University NHS Foundation Trust
- South West London and St George’s Mental Health NHS Trust
- South West Yorkshire Partnership NHS Foundation Trust
- South Western Ambulance Service NHS Foundation Trust
- Southern Health NHS Foundation Trust
- St George’s University Hospitals NHS Foundation Trust
- Stockport NHS Foundation Trust
- Surrey and Borders Partnership NHS Foundation Trust
- Surrey and Sussex Healthcare NHS Trust
- Sussex Community NHS Foundation Trust
- Sussex Partnership NHS Foundation Trust
- Tameside and Glossop Integrated Care NHS Foundation Trust
- Tavistock and Portman NHS Foundation Trust
- Tees, Esk and Wear Valleys NHS Foundation Trust
- The Christie NHS Foundation Trust
- The Clatterbridge Cancer Centre NHS Foundation Trust
- The Dudley Group NHS Foundation Trust
- The Hillingdon Hospitals NHS Foundation Trust
- The Leeds Teaching Hospitals NHS Trust
- The Newcastle Upon Tyne Hospitals NHS Foundation Trust
- The Princess Alexandra Hospital NHS Trust
- The Robert Jones and Agnes Hunt Orthopaedic Hospital NHS Foundation Trust
- The Rotherham NHS Foundation Trust
- The Royal Marsden NHS Foundation Trust
- The Royal Orthopaedic Hospital NHS Foundation Trust
- The Royal Wolverhampton NHS Trust
- The Shrewsbury and Telford Hospital NHS Trust
- The Walton Centre NHS Foundation Trust
- Torbay and South Devon NHS Foundation Trust
- United Lincolnshire Teaching Hospitals NHS Trust
- University College London Hospitals NHS Foundation Trust
- University Hospital Southampton NHS Foundation Trust
- University Hospitals Birmingham NHS Foundation Trust
- University Hospitals Bristol and Weston NHS Foundation Trust
- University Hospitals Coventry and Warwickshire NHS Trust
- University Hospitals Dorset NHS Foundation Trust
- University Hospitals of Derby and Burton NHS Foundation Trust
- University Hospitals of Leicester NHS Trust
- University Hospitals of Morecambe Bay NHS Foundation Trust
- University Hospitals of North Midlands NHS Trust
- University Hospitals Plymouth NHS Trust
- University Hospitals Sussex NHS Foundation Trust
- Walsall Healthcare NHS Trust
- Warrington and Halton Teaching Hospitals NHS Foundation Trust
- West Hertfordshire Teaching Hospitals NHS Trust
- West London NHS Trust
- West Midlands Ambulance Service University NHS Foundation Trust
- West Suffolk NHS Foundation Trust
- Whittington Health NHS Trust
- Wirral Community Health and Care NHS Foundation Trust
- Wirral University Teaching Hospital NHS Foundation Trust
- Worcestershire Acute Hospitals NHS Trust
- Wrightington, Wigan and Leigh NHS Foundation Trust
- Wye Valley NHS Trust
- York and Scarborough Teaching Hospitals NHS Foundation Trust
- Yorkshire Ambulance Service NHS Trust
Document version control
| Version | Date issued | Changes made |
|---|---|---|
| 1.0 | February 2026 | N/A |
Publication reference: PRN02369