
1. Introduction
The Advisory Committee for Resource Allocation (ACRA) is an independent, expert, technical committee that makes recommendations to NHS England on the target formula for NHS allocations and to the Department of Health on the target formula for public health allocations. Its membership includes academics, GPs, NHS managers and public health experts.
This document sets out ACRA’s recommended methodology for estimating relative need for specialised services. The methodology applies to physical health services (similar work is in progress for mental health services) and is broadly similar to that used for the allocation of funds for non-specialised secondary care (“general and acute”) services. Like the non-specialised secondary care methodology, it is designed for use in informing targeting of funding for commissioners according to need.
ACRA recommendations are based on research and its decisions are informed by a set of published criteria (see Annex A). ACRA engaged with stakeholders in developing this methodology and its responses to the feedback received are available.
2. What is the methodology for?
The allocation of funding to local commissioners of services (currently, integrated care boards or ICBs) is one of NHS England’s legal responsibilities. NHS England’s duty to reduce inequalities in health outcomes and to promote equal opportunity of access for equal need (Section 13G Health and Social Care Act 2012) has long underpinned its approach to setting these allocations.
The formulae used to calculate the target allocations, or ‘fair shares’, of each area take into account a variety of factors such as demography, morbidity, deprivation, and the unavoidable cost of providing services in different areas.
Following the 2019/20 allocations round, ACRA was commissioned to consider the needs-based allocation methodology for specialised services. This will support the transition to population-based commissioning of specialised services and the integration of specialised and non-specialised service commissioning.
3. The context for implementation
This work to strengthen and to implement a needs-based allocation methodology for specialised services has been given additional purpose by the programme to integrate commissioning of services for integrated care system (ICS) populations by delegating specialised services commissioning to ICBs.
Constructing needs-based allocations for specialised services at an ICS level will enable commissioners to consider the health needs of their populations in the round, including opportunities to optimise allocation of clinical resource along patients’ pathways, considering the best balance between preventative, curative and rehabilitative services.
Commissioning of many specialised services is being delegated by NHS England to ICBs from April 2024. The methodology presented here estimates the needs-based fair shares of resources required for all prescribed specialised services that are ultimately to be delegated for commissioning by ICBs. This includes high-cost drugs and devices (HCDD), despite the fact that some of these services (including HCDD) are not expected to be delegated in the short term.
Unlike non-specialised services, NHS England will retain accountability for specialised services, even after delegation, and this is the principal reason why services are modelled separately from non-specialised services.
When setting actual allocations, NHS England will take account of other factors, in particular the:
- total amount to be allocated (the quantum)
- the amount most recently allocated for the population in question (the baseline)
- the speed at which the allocation can safely move from the baseline towards the modelled distribution of resources (convergence policy), giving local health systems time to adapt
ACRA is not responsible for these aspects of allocation setting. Convergence policy also determines what account should be taken of the overall (specialised and non-specialised) baseline allocation of resources relative to the combined fair-shares allocation.
4. Our approach to needs-based allocation
The formulae for target allocations estimate the relative need for healthcare services and the relative unavoidable costs of meeting that need between ICSs.
As the need for different types of health services varies across the country in different ways, there are separate formulae for ICBs’ core responsibilities, for specialised services (which are currently commissioned directly by NHS England) and for primary medical care. For each of these, relative need is calculated for each GP practice, which is then aggregated to the ICS level. The methodology does not seek to calculate an absolute level of need for each area, but to assess relative need (and relative unavoidable costs).
The relative need for each GP practice is estimated on the basis of:
- the diagnostic history, and age, sex, and ethnicity, of each member of the population in so far as these are indicative of future healthcare utilisation (all else being equal, areas with older populations typically have a higher need per head largely due to the greater prevalence of health conditions)
- additional need due to factors pertaining to the area in which people live, including deprivation (all else being equal, areas with more deprived populations have a higher need per head)
- an adjustment to allow for estimated unmet need not captured in the utilisation model, and for funding the reduction of health inequalities. See section 4.8, Unmet need and health inequalities adjustment: avoidable mortality, of the Technical guide to allocation formulae and convergence for 2023/24 to 2024/25 revenue allocations.
These are all factors describing relative need and properly taken into account when determining a fair allocation of funding.
Adjustments are also made for unavoidable cost differences between locations, in particular the Market Forces Factor. See section 5.2 of the Technical guide to allocation formulae and convergence for 2023/24 to 2024/25 revenue allocations.
Each allocation formula is based on statistical modelling that examines the association between the utilisation of health services on the one hand and the characteristics of individual patients and the areas where they live on the other. These models are used to decide which of these need-determining factors to include in the formulae to predict future need per head and what weight to place on each of the factors.
The model also includes ‘supply variables’. These are factors that influence utilisation of resources but that do not reflect need. These factors might include proximity and ease of access to hospital services if some services are more readily available to providers’ local populations. Also, some providers may be more costly or charge more in providing the same services. Including these supply factors improves accuracy in estimating the relative importance of the need variables.
The supply variables themselves are not used in the estimation of relative need. Technically, this is achieved by setting each of these variables at the national average for every individual, a process known as ‘sterilisation’. This means for example that, in the calculation of relative need, areas are not penalised in the formula if they under-utilise specialised services due to the fact that referral pathways to specialised centres are not well established.
The need variables are used to estimate what a fair share of funding for each individual would have been in the target year. These are aggregated to create estimates for each GP practice and then combined to create ICS-level estimates of relative need. These are presented as a relative need index. The need-weights are estimated for each age-sex cohort in each GP practice so they can be applied to practice-level population projections for future years. These are then used to create target needs-based ICS allocations for each year for which the allocation is being set.
5. The specialised services needs-based allocations methodology
5.1 The foundation: the general and acute model
The established general and acute model was used as the starting point for the development of the specialised services model. This general and acute model was updated and refreshed for the 2022/23 allocations round. See the Report on changes to the allocations model for general and acute services for 2022/23 allocations.
ACRA advised that the methodology employed in the general and acute model should also be used in the specialised model unless there is good reason to diverge. This section therefore includes relevant information about the general and acute model as context to the discussion of the specialised model.
Since the 2014/15 allocations round, ACRA has recommended that relative need per head for general and acute services is estimated using a person-based approach, first developed by the Nuffield Trust. See Bardsley M and Dixon J (2011) Person-based Resource Allocation: New approaches to estimating commissioning budgets for GP practices. Research summary. Nuffield Trust. The person-based approach uses pseudonymised data at the individual level to provide accurate estimates of need, including for small and atypical populations.
NHS England has periodically refreshed and developed the Nuffield research, most recently for the 2022/23 allocation round.
A large range of candidate variables are tested for association with subsequent utilisation of healthcare services. The variables that have been found to have a plausible, statistically significant association are those that have been taken forward for the specialised model and are described in section 5.4 below. The exception is that in the general and acute model the supply variables do not include provider-specific variables; the rationale for including these variables in the specialised model is discussed below.
5.2 The prior indicative specialised services model
Target allocations for specialised services were developed for the first time for clinical commissioning group (CCG) populations for the 2016/17 allocations round, and the same model was used to inform 2019/20 allocations. These target allocations for specialised services were indicative only and were not used to distribute specialised service resource, although they did support a better understanding of total expenditure for a CCG’s population.
Using the same approach as the 2016/17 general and acute formula, this specialised services model used the SUS+ dataset (the Secondary Uses Service dataset that contains patient-level data for hospital activity). However, SUS+ has poor coverage of some specialised services, and it was not possible to model all specialised services. The dataset coverage allowed the formula to be used for 46% of specialised services funding. The other 54% of specialised services, where coverage in the dataset was poor, were distributed in the indicative allocation in line with the historical pattern of spending as the best estimate of need for these services. The scope of the formula component changed from 46% to 49% for the indicative specialised model prepared ahead of 2019/20 allocations.
During this period, with resource mapped on a provider (rather than population) basis, and contracted at regional level, opportunities for better patient care and increased efficiency may have been missed in services where early intervention and more joined up pathways of care would improve services at a reduced cost. A needs-based target allocation on a population basis highlights where existing service utilisation is higher or lower than modelled need, suggesting scope for optimisation, as well as to bring about fairer distribution of resources.
5.3 The development of the new specialised services model
ACRA agreed early in the process of developing the specialised services model that, where possible and where it made sense to do so, the specifications of the general and acute and of the specialised services models should be aligned; the models are very similar, and the majority of the datasets and variables are the same.
An important difference is that the new specialised services model uses an alternative dataset to represent the utilisation of services (the dependent variable). The general and acute model (like the previous version of the specialised model) uses cost-weighted activity to represent utilisation, with cost-weights given by published tariffs and other sources for services reported in SUS+.
As far fewer specialised services are covered by cost-reflective prices, this approach greatly restricted the number of services that could be covered. The new specialised model instead represents utilisation of in-scope specialised services by unweighted commissioner expenditure: using the unweighted patient-level charges sent by providers to commissioners in the patient-level contract monitoring (PLCM) datasets. This has significantly improved the proportion of specialised services that are covered by the model.
One drawback of using the PLCM datasets rather than cost-weighted activity is that the price of a service varies from provider to provider, even after adjusting for unavoidable cost differences using the market forces factor (MFF). The introduction of provider-specific supply variables allows the effects of variance due to differences in provider prices to be removed from the modelling. In estimating relative need, the impact of these supply variables is neutralised by setting them at average values for all individuals, effectively estimating the relative utilisation of specialised resources of different individuals as if all individuals were served by the same typical provider of specialised services, at average prices.
In general, there is thought to be no link between differences in provider prices for specialised services and population need, so that it is appropriate to set such differences aside (in the way described) when estimating relative need. Rather, decisions will have been made over time as to the level of investment in individual services (e.g., number of medical staff and the creation of multi-disciplinary teams staffed with specialist nurses and psychologists etc.) which will contribute to different cost bases for the same service-need in different providers. To an extent, these are reflected in local prices and may determine quality of service but are appropriately set aside in estimating relative need. Variation in local prices may also reflect geographical variation in provider efficiency or in negotiating power between providers and commissioners, and thus do not reflect unavoidable cost difference; such variation is correctly set aside so as not to influence estimates of relative need.
There is a risk that some need variation that is not captured elsewhere may have been captured in the provider-specific variables. To the extent that specialised providers serve specific regions where the populations have particular characteristics, the provider variables may pick up these characteristics if they aren’t properly reflected elsewhere. The concern only arises if the diagnostic information about the patients needing specialised services does not sufficiently distinguish them from other patients; otherwise, their additional costs and additional need would be fully represented through the diagnosis variables. In the forward work programme, we intend to explore use of finer diagnostic groupings, particularly for long term conditions, which could mitigate any problem.
There are other drawbacks to the use of the PLCM datasets: there is likely to be considerable variation in the practice of counting and coding activity and recording it in the PLCM datasets (although this is also an issue with SUS+). Some activity that is paid for in a block will not make it into the PLCM at all – or may be recorded at zero cost.
However, so long as a good proportion of service usage for each service line is covered (see next section), the estimation of the needs-drivers should be sound. Note that the PLCM is being used to create the set of patient-level specialised resource costs; the modelling then assesses what it is in the personal history of all those patients who have incurred those costs that is suggestive of future recourse to specialised services, drawing on the joined pseudonymised full inpatient medical history of just those patients. Absence of other patients whose costs are not known to the model will not vitiate the modelling so long as the patients caught by the PLCM are an unbiassed sample of all patients.
Biases relating to different coding and counting practices in different providers should be captured by the provider-specific variables, which are modelled but not used in estimating relative need.
5.4 Data to be modelled
5.4.1 The dependent variable
As described above, the previous specialised services model used data from the SUS+ dataset, which was insufficiently comprehensive and only around half of specialised services spend could be modelled. For this model, the PLCM datasets have been used to create the dependent variable for the model. Initially the model was estimated to predict specialised services expenditure on each person during 2018/19. The modelling of need was repeated using the equivalent 2019/20 dependent variable. The model was found to be stable across the two years, as described in section 5.6.6. However, as the COVID-19 pandemic began during the 2019/20 financial year, the dependent variable was calculated for the 12 months from March 2019 to February 2020 to avoid any impact of the pandemic on the modelling.
Three patient-level datasets are collected by specialised commissioning for the purposes of monitoring contracts:
- the Patient Level Contract Monitoring (PLCM) dataset, which covers all NHS funded acute clinical care
- the Drugs Patient Level Contract Monitoring (DrPLCM)
- the Devices PLCM (DePLCM)
Taken together, these datasets should cover all the specialised services funded by NHS England.
Not using the financial year has created some challenges in terms of creating the dependent variable and comparing it to actual levels of spend. The Aggregate Contact Monitoring (ACM) dataset that is used to test the coverage of the patient level (PLCM) data in the model is only published on a financial year basis and we are therefore not comparing spend over the exact same time period. Also, specialised services lines do change, and these changes coincide with the start of the financial year; as the dependent variable is calculated for 12 months that cut across two financial years, there are some small elements of spend for service lines in March 2019 that are not included in the 2019/20 ACM.
The 2019/20 patient level spend from the PLCM was (nonetheless) compared to the outturn spend for 2019/20 from the ACM dataset to assess the extent of coverage in the PLCM. Each services line was tested against the threshold used for inclusion in the model – that 40% of the value in the ACM is covered by the patient level data in PLCM. The service lines that fit the criteria for inclusion in the model account for 88% of specialised services spend (excluding highly specialised services and specialised mental health services).
Services for which the 40% threshold was not achieved are dealt with in two different ways. For the smaller services (PET-CT specialised cancer diagnostics, £138 million in 2019/20; extracorporeal photopheresis cancer services, £9m; various rehabilitation and disability services (communication aids, environmental controls, prosthetics), £113 million; neuropsychiatry, £7 million; hyperbaric oxygen therapy, £7 million; molecular diagnostics, £14 million; cleft lip and palate services, £30 million; foetal medicine, £14 million; paediatric and perinatal post mortem services, £3 million; infectious diseases, £182 million), the ICS variation in need for these services collectively is unlikely to diverge materially from that for modelled specialised services. Therefore, target funding for these services can be distributed using the needs-based model.
There are two areas of significant spend that are notable exceptions – HIV and neonatal critical care (NCC). Data for HIV are anonymised and therefore cannot be joined to the person-level dataset for modelling. The cohort nature of the model, taking a registered population at the start of April 2019 to whom to attribute specialised services utilisation, means that NCC expenditure is not captured for children born during the year. These children in any case have no existence in the base years used for predicting relative need.
The modelling of allocations for these services, discussed in section 5.7 below, is combined with the weighted population for the main model to create an inclusive target allocation. To aid transparency, however, the needs indices presented below in section 5.6 are exclusive of these two services.
Specialised services have a higher average cost and wider variation in costs than general and acute services, therefore outliers for specialised services have been considered separately to those for the general and acute model. Analysis showed that alternative treatments of outliers in the specialised services model had little impact on goodness of fit in the model. Further analysis of outliers in the PLCM in 2019/20 has shown that the outliers are consistent across years. Following this analysis and clinical feedback, outlying costs have not been removed or capped in the specialised services model.
The scope of specialised services can change over time with the introduction of new services. Generally, on introduction, these services will not materially affect the appropriate allocation to ICBs, given the small scale of new innovations relative to the overall budget, that common factors (age-related morbidity adjusted for deprivation) that drives the need for most specialised services, and the limited pace of convergence in allocations towards target allocations. However, over time, innovations cumulate. This together will demographic change necessitates periodic remodelling of need.
5.4.2 Explanatory variables
An extensive set of explanatory variables was gathered for testing in the model. The starting point for this list were the variables tested in previous iterations of the general and acute model. The need and supply variables tested in the model are summarised below. A full list is in Annex B. The final list of variables included in the 2019/20 recommended model is shown in Annex C.
Table 1: Need variables
| Explanatory variable | Description | Rationale |
|---|---|---|
| Morbidity flags, co-morbidity flags, number of diagnoses | Historical diagnosis data, including up to a dozen diagnoses, collated for all inpatient episodes and spells in 2017/18 and 2018/19 from the SUS+ dataset for the April 2019 cohort of GP registered patients. These diagnoses data are used to create morbidity flags, indicating a past diagnosis of a condition in one of the World Health Organisation defined sub-chapters of the International Classification of Diseases (ICD). | Historical diagnoses are likely to be associated with enduring morbidity, that is in turn predictive of future need for healthcare. Diagnoses will vary in their predictive power, so are modelled individually. The use of two years of historical diagnosis data is consistent with both the Nuffield PBRA 2011 model and the 2016/17 update. This reflects the diminishing explanatory power of historical data on future hospital costs with time. Additional co-morbidity flags are also included that take account of how having many different diagnoses can increase or decrease relative need compared to the sum of need from having each diagnosis alone. These are based on the higher-level ICD chapters. |
| Morbidity counts | A morbidity count variable constructed to indicate where an individual has had a particular diagnosis recorded three of more times during 2017/18 and 2018/19. | This is based on the hypothesis that having a diagnosis recorded more frequently indicates a higher level of need. The count of diagnoses recording is capped at ‘three or more’ to avoid including supply effects in the model. |
| Age, sex and area of residence | Age, sex and area of residence taken from the GP registrations data Master Patient Index (MPI) in April 2019. For area, we use ONS lower layer super output areas (LSOAs: there are 32,844 LSOAs in England, with populations averaging around 1,500). | Age-sex cohorts may have different propensity to need healthcare resource independently of the set of diagnoses that have been collected for those individuals. Area of residence is used to attribute to individuals those characteristics, listed below, that are unavailable at an individual level (notably deprivation). |
| Ethnicity | Each individual’s ethnic group, assigned using a range of patient-level health datasets. This assignment identifies the ethnic group for 61% of individuals. For the remaining population, an area-based proportion is used (an attributed area-based variable from the Census). Ethnicity is included by ethnic group (16 groups). | Ethnicity may drive need either due to differences in biology or culture that drive variation in health need, or to variation in access to upstream services. (‘Upstream services’ address need earlier in the progression of a disease or healthcare condition, when intervention may pre-empt the need for specialised services.) It can also sometimes be associated with failure to present need – see discussion in section 5.6.2 below. |
| Privately funded care flag | A flag created for anyone with any privately funded care episodes recorded in SUS+ in 2017/18 or 2018/19. | Use of privately funded care is predictive of future such use, which in general will reduce likely recourse to NHS funded services. |
| New registrations | A flag for whether someone was newly registered with their current GP, based on the previous 12 months. Based on registration in 2018/19. | Modelling has consistently found that being newly registered with a GP is associated with higher cost. |
| Household composition | Linking the MPI to the anonymised Unique Property Reference Number (UPRN) allows identification of all individuals resident in a property and derivation of a household type variable that indicates the composition of the household as: eight-plus residents; multi-generation family; multiple adults; one adult dependent child; single person; etc. | Household status may prove predictive of need for specialised services. |
| The following need variables are only available for small geographical areas (LSOAs) rather than for individuals, so individuals are attributed the value for the LSOA in which they reside. | ||
| Variables from the ONS Census of Population | A range of variables relating to population characteristics from the 2011 census: proportion of single pensioner households, proportion aged 16-74 who have never worked, proportion who are single, proportion divorced, proportion renting, proportion reporting ‘not good health.’ | Any of these may prove predictive of vulnerability to conditions requiring specialised resource. |
| Index of Multiple deprivation | The underlying indicators from the Index of Multiple Deprivation. Updated for IMD2019, using underlying indicators rather than composite scores. | Deprivation may be predictive of healthcare need in addition to the effect captured through the association of deprivation with morbidity – which is flagged at an individual level. |
| Population variance | The variance between registered and resident populations for each LSOA. | To allow modelled need to be driven by the actual resident population irrespective of how many individuals are registered or of any list inflation. |
| Variables from the Department of Work and Pensions | Eligibility for Disability Living Allowance (DLA) or Personal Independence Payment (PIP). | Disability may be predictive of healthcare need over and above its association with morbidity. |
| Quality outcomes framework data | QOF indicators including kidney disease total exceptions, epilepsy prevalence, mental health prevalence. | May pick up morbidity that has not been diagnosed in the secondary care data used to provide individual-level morbidity. |
| GP survey | A range of indicators from the GP survey (including average number of medical conditions for those with at least one, listed in Annex B). | To capture the burden of need prevalent at different practices. |
5.4.3 Supply variables
As explained above, the utilisation of healthcare may also be affected by the relative availability of healthcare services. The following variables were tested in the modelling to adjust for this, known as supply variables. Supply variables included in the models are not included in the formula to calculate relative need; instead, their value for each area is set to the national average (sterilised).
Table 2: Supply variables
| Explanatory variable | Description | Rationale |
|---|---|---|
| Travel duration to hospital sites | Gravity-weighted* travel duration from an LSOA to all hospital sites. We have tried various specifications of the distance variable, to take account of the distance to relevant specialist hospitals, including in the sub-models. We have also explored whether distance might particularly be a problem for the elderly or the deprived. | Access to care may be deterred by travel distance, either because patients are unable or unwilling to travel, or due to attenuation of referral networks (primary and secondary care doctors are more likely to refer to tertiary centres with whom they have established connections). |
| Hospital supply variables | A range of gravity-weighted* variables for each LSOA, including median waiting times, diagnostics, and numbers of beds/operating theatres. | Supply constraints may lead to prioritisation of local patients in accessing each of these types of services; if so, estimation of need must make allowance for the fact that local patients will use disproportionately more services. |
| Provider-specific variables | The share of the patients at a GP practice that have received specialised care at each provider during 2017/18 and 2018/19. | As highlighted above, the dependent variable for the specialised services model includes the actual cost to commissioners of activity. These provider-specific variables in the specialised model account for provider variation in the pricing, efficiency, or quality of services, and for provider-specific access issues. |
| GP workforce survey | A range of variables relating to GP workforce. | Constrained supply of GP services may suppress or delay referral for specialised need, and this should be taken into account when estimated underlying need. |
| Quality outcomes framework scores and exception rates | Weighted scores and exception rates from the quality outcomes framework (QOF). | Quality of primary care may determine likelihood of referral for specialised services. |
| CCG quality of care | Age/sex standardised avoidable admissions defined as per NHS Oversight Framework indicator 106a. The residuals of a regression of this indicator at LSOA against the Index of Multiple Deprivation was taken as an inverse indicator of quality of CCG-commissioned care, as it should be sensitive both to access and to quality of primary and secondary care. | Poor quality of CCG care might be expected either to increase the recourse to specialised care (as exacerbations are not avoided), or to depress it (as severe conditions are left untreated with appropriate specialised care). |
| CCG-specific variables | A flag for each individual indicating which CCG is responsible for commissioning their healthcare – based on the GP practice at which they are registered. | CCGs may vary in the scope and quality of primary and secondary care services, which may affect demand for specialised services; they may also vary in negotiating power which may affect expenditure. |
*‘Gravity weighting’ involves giving weight according to the inverse of the square of the distance: in the same way that gravity is inversely proportional to the square of the distance between two bodies, so the likely impact of proximity to a healthcare facility on utilisation diminishes with the square of the distance.
Due to the high number of attributed need variables, rationalisation of the variables tested in the model was undertaken by splitting the variables into thematic groups and using principal component analysis (PCA) to identify the most important variables. This was done in advance of the econometric modelling.
To conduct the PCA, the attributed variables were split into thematic groups. For each thematic group all possible components were created. The components were retained which, on their own, captured at least 5% of the variance each or cumulatively captured at least 90% of the variance, whichever condition is met first. In other words, adding components until either reaching 90% or until the next component will account for less than 5%.
From these principal components, variables from the original group were then selected based on their loading in the components. If the original group contained more than ten variables, the three most important variables from the first principal component were selected, two variables from the second principal component and one variable from each subsequent component. For thematic groups with ten or fewer variables, the two most important variables were selected from the first principal component and one variable from each subsequent component. If any variable from the subsequent principal component had already been selected, then the next most important variable was considered.
Before performing the PCA on each of the groups of variables, the Kaiser-Meyer-Olkin measure of sampling adequacy was calculated, which characterises the appropriateness of the group to be data reduced through PCA. For any groups that fail to meet this criterion PCA is not undertaken, and all variables of that group are included in the final model.
Ten groups of variables were created:
- QOF prevalence
- QOF scores
- QOF exception rates
- GP immunisation rates
- hospital supply variables
- barriers (subset of IMD variables)
- education (subset of IMD and census variables)
- health (subset of IMD and census variables)
- income (subset of IMD and census variables)
- living environment (subset of IMD variables)
Of the 10 groups, only Living Environment could not be reduced through PCA. The full set of variables used in the modelling following this PCA process are listed in Annex B.
It is worth noting that the model implicitly disentangles age from the morbidity with which it is associated, and most of the work is indeed likely to be done by morbidity – but the result is to allocate more funding to older and to more deprived populations, on account of their greater morbidity.
More generally, the model will use the detailed diagnostic histories of individuals to forecast need in different ways for different conditions:
- for persistent conditions, including genetic conditions, where these are captured in the dataset, the model will forecast resource use directly for those patients who are currently receiving services
- for acute conditions for which treatment is curative, the model will predict resource use on the basis of personal attributes including age and other morbidities that it discovers to be predictive of such need
- some funding will be attributed even to young and healthy individuals given the small risk each person runs of needing specialised resources in a year or two.
5.5 Model specification
5.5.1 Age functional form
In the previous model iteration, age was introduced as a series of 18 variables each representing an age group in 5-year intervals up to 85 plus. Such age variables were interacted with sex for sex-specific age costs. During the model development an alternative method of accounting for age and sex was tested through using linear or cubic splines with a number of different knots (5 to 18 knots).
The use of splines allows the impact of age on predicted costs to vary within age groups. Rather than fitting a single coefficient for each age group, the splines allow the coefficients to vary within the age group.
The use of splines improved the performance of the model. The optimal number of knots proved to be 17 or 18. To allow for more flexibility in the older groups, the decision was to implement linear splines with 18 knots.
5.5.2 Number of diagnostic positions
In the updated dataset the number of secondary diagnostic positions that can be recorded has increased to 23 (compared to 13 diagnostic positions in the dataset for the 2016/17-allocations model update). The optimal number of positions used to create the morbidity binary flags was therefore examined. Changes in model fit were minimal after the use of 13 secondary positions, although 23 diagnostic positions performed best.
Significant variation in the depth of coding between providers was observed which could introduce bias into the model as patients attending providers with greater depth of coding could have more morbidities and co-morbidities identified. About 95% of individuals had 14 diagnoses or less recorded per provider. Consideration of the 95th percentile of diagnoses recording suggested that the vast majority of providers coded to around 10 to 12 positions with all providers having a maximum number of diagnoses of at least 12.
Other tests included looking at the same individual being treated at different providers and the way that other model variables change as the number of secondary diagnoses included in the model change.
Considering depth of coding, goodness of fit statistics and provider coding distributions and the diagnostics testing, 12 secondary diagnostic positions were chosen as this struck the best balance between making the best use of the data that is available without introducing bias into the model due to differences in depth of coding between providers.
5.5.3 Model variable selection
Consistent with previous person-based resource allocation modelling approaches, three random samples were used to estimate and validate the models:
- Sample S1 – the individual level estimation sample. This was a 15% randomly selected sample of 8,965,463 individuals from 7,051 GP practices.
- Sample S2 – the individual level validation sample. This was a 15% randomly selected sample of 8,957,806 individuals from 7,051 GP practices. Samples S1 and S2 were mutually exclusive, so no individual was in both samples S1 and S2.
- Sample 3 – GP practice level validation sample (containing all registered patients from a sample of GP practices). This was all those registered with a randomly selected sample of 15% of GP practices with 1,000 or more patients. This sample had 8,603,866 individuals from 998 GP practices.
Given the large number of candidate variables in the model and the associated risk of overfitting the model, a variable selection process was conducted to obtain a list of attributed variables that are associated with costs of specialised services. A stepwise approach as described below is used to select variables for the final model. Variable selection is undertaken on the estimation sample, S1. The final coefficients for the selected variables are then calculated using the whole dataset.
Stepwise T-statistic selection method:
a) The first step selects the relevant co-morbidity flags and morbidity intensity counts. A baseline model containing age splines, sex, their interaction, morbidity flags and co-morbidity flags is created. Co-morbidities and morbidity intensity with t-statistic >3.27 are retained as highly significant and relevant. All other co-morbidity and morbidity intensity variables are dropped.
b) In the second step, a ‘full model’ containing all of the candidate variables is estimated using S1.
c) All attributed variables with t-statistic <0.2 are then removed from the model.
d) After step c, we re-run the model but without variables omitted in stage c. We then remove all attributed variables with t-statistics lower than 0.4.
e) We repeat the process described in step d, increasing the t-statistic by 0.2 for each iteration, until we have removed all attributed variables with a t-statistic of under 2.58.
In line with ACRA’s previous recommendations, some collections of variables are considered together as a group. If any are significant, the whole group is retained in the model. For the specialised services model this is true for age, sex, ethnicity, household type, historical diagnoses, provider-specific variables, and CCG-specific variables.
5.6 Final recommended model for specialised physical health services excluding HIV and neonatal critical care
5.6.1 Model fit
Statistical modelling was used to select the best-fit drivers of relative costs from the set of explanatory variables at the person level and the relative weights for each driver, as well as to exclude groups of variables that included no statistically significant impact. The quantified relationships found were taken to be predictors of relative future, cost-weighted need for healthcare services, subject to supply variables being set to the national average values (sterilised).
The goodness of fit for the 2019/20 model is shown in table 3.
Table 3: Goodness of fit for T-statistic-selected model – 2019/20 model
| S1 | |
| R2 | 0.0555 |
| Adj R2 | 0.0554 |
| MAE | 276.69 |
| S2 | |
| R2 | 0.0584 |
| Adj R2 | 0.0583 |
| MAE | 276.58 |
| S3 | |
| R2 | 0.5211 |
| MAE | 24.12 |
| Proportion not within 10% | 0.32 |
| Mean absolute percentage change in practice shares between observed and predicted costs | 16.84 |
| Proportion of practice share substantially effected | 0.79 |
The final model explains 52% of the variation in specialised services costs at the GP practice level. This compares to 89% of the variation in cost-weighted general and acute activity that is explained by the model for those services. It is to be expected that the model for specialised services explains less variation than the general and acute model. There is a much smaller proportion of the patient cohort with costs for specialised services, and – to the extent that this incidence is unpredictable – there is therefore greater scope for random variation in the incidence of specialised conditions at a practice level. ACRA judges this level of explanatory power adequate for the purpose of estimating relative need at higher levels of aggregation (and specifically at the level of ICBs).
The variables tested for use in estimating relative need (and the supply variables used to set aside supply effects) were summarised and explained in section 5.4.2 above, and are listed in Annex B. The result of the variable selection process was to reduce the model to that set out in Annex C.
It turns out that utilisation of specialised services is largely driven by individuals’ morbidity, represented in the model by their diagnostic history. The impact of deprivation on need is therefore captured only indirectly – via the association between deprivation and morbidity. Age also is largely captured via its impact on morbidity (i.e., the increased richness of diagnostic history of older people due to the greater likelihood of their having had a hospital attendance in the last two years, and the greater likelihood of comorbidities) which is directly associated with greater use of specialised services. Very few attributed need variables are significant in the model.
Residence in a care home is associated with reduced recourse to specialised services (perhaps due to frailty). The Pakistani, Bangladeshi, African, Caribbean, and Other Black ethnicity flags are associated with additional need for specialised services. These household type and ethnicity drivers persist in their significance across the two years for which the model was estimated.
Among the supply variables, neither the measure of CCG quality of care nor the measures of travel time proved significant. However, effects of these factors may have been captured in the individual CCG-specific and provider-specific variables.
The full set of coefficients for the specialised services model is in Annex C.
5.6.2 Calculation of need indices for aggregate physical health model
Once the variables and their weight in driving need have been determined by the model, weighted populations are produced for each GP practice, which can then be summed to ICSs to reflect relative need for healthcare in each area. This is done by first calculating average cost weights for each age-sex cohort in each GP practice. These cost weights are then applied to current GP populations to calculate the weighted population for each GP practice. Using age-sex cohorts (rather than individuals) as the bearer of the population weights enables resource-need to be projected forward for a practice with sensitivity to demographic change using ONS population projections.
At this stage the supply variables have been set to national averages, so that they do not affect the estimation of relative need As mentioned, this is so that estimates of need are not influenced by variation in the extent to which patients have access to services (captured in both the CCG- and provider-specific variables), or by variation in the efficiency with which services are provided (captured by the provider-specific variables).
In addition, ACRA is recommending that where ethnic groups had negative coefficients in the model (indicating lower use of health services) these should be set to zero (i.e., matching the White-British group), as negative coefficients are likely to reflect unpresented need rather than lower levels of need for these groups.
The GP practice-level weighted populations are summed to ICSs and reflect relative need for healthcare in each area.
Weighted populations are used to calculate a need index for each ICS by dividing the weighted population by the total registered population. A value above 1 indicates higher than average need and a value below one indicates lower than average need.
5.6.3 Impact of age relative to other factors upon ICS need indices
The impact of age upon the need indices for the specialised model (excluding HIV and NCC) is shown in Table 4 and in Figure 1. Table 4 gives, for each ICS in 2018/19 and for 2019/20 the estimated relative need per head of population for each area in the first two columns, whilst the third and fourth columns show relative need for age and sex standardised populations, what their relative need estimate would have been if they had the age-sex profile of England. The purpose of these columns is to display the impact on estimated need of all the other factors driving need apart from the age and sex profile (and its associated morbidity profile). Both year-model outputs are shown to display the relative stability of need-estimates (discussed further below); only the 2019/20 model outputs are used for target allocations.
The fifth column – showing the difference between the two – displays the impact of age and sex on estimated need. This is shown for 2019/20.
The top row, for East London, for example, shows that other factors – including relative morbidity and deprivation – indicate a heavy burden of need, 12.9% above the norm in the age-sex-standardised column in 2019/20. But this is more than offset by the fact that the population in this ICS is relatively young, so that overall modelled need for specialised services, at 0.89, is 11% below the national average. Estimated need for specialised services other than HIV and NCC in this ICS is reduced by 21% due its younger than average population. As will be seen in section 5.7, estimates of need for HIV and NCC, which cannot be age standardised, tend to be higher in younger populations.
Table 4: Specialised physical health services needs indices per person, unadjusted and age-sex standardised, by ICS, 2018/19 and 2019/20 models
London: Modelled relative need for specialised physical health services excluding HIV, NIC, MFF by ICS 2018/19, 2019/20.
| ICS | ICS code | 2018/19 relative need, unadj. | 2019/20 relative need, unadj. | 2018/19 age/sex standardised relative need | 2019/20 age/sex standardised relative need | 2019/20 age/sex impact on relative need |
|---|---|---|---|---|---|---|
| North East London | QMF | 0.890 | 0.887 | 1.127 | 1.129 | -21% |
| North Central London | QML | 0.917 | 0.893 | 1.102 | 1.075 | -17% |
| North West London | QRV | 0.881 | 0.868 | 1.044 | 1.023 | -17% |
| South East London | QKK | 0.899 | 0.902 | 1.059 | 1.060 | -15% |
| South West London | QWE | 0.877 | 0.876 | 1.003 | 0.986 | -11% |
South West: Modelled relative need for specialised physical health services excluding HIV, NIC, MFF by ICS 2018/19, 2019/20.
| ICS | ICS code | 2018/19 relative need, unadj. | 2019/20 relative need, unadj. | 2018/19 age/sex standardised relative need | 2019/20 age/sex standardised relative need | 2019/20 age/sex impact on relative need |
|---|---|---|---|---|---|---|
| Bath and North East Somerset, Swindon and Wiltshire | QOX | 1.003 | 1.000 | 0.943 | 0.935 | 7% |
| Bristol, North Somerset and South Gloucestershire | QUY | 0.989 | 0.973 | 1.019 | 1.009 | -4% |
| Cornwall and The Isles of Scilly | QT6 | 1.291 | 1.293 | 1.118 | 1.111 | 16% |
| Devon | QJK | 1.134 | 1.127 | 1.004 | 0.999 | 13% |
| Dorset | QVV | 1.125 | 1.101 | 0.984 | 0.963 | 14% |
| Gloucestershire | QR1 | 0.987 | 0.996 | 0.904 | 0.909 | 10% |
| Somerset | QSL | 1.125 | 1.139 | 0.982 | 0.987 | 15% |
South East: Modelled relative need for specialised physical health services excluding HIV, NIC, MFF by ICS 2018/19, 2019/20.
| ICS | ICS code | 2018/19 relative need, unadj. | 2019/20 relative need, unadj. | 2018/19 age/sex standardised relative need | 2019/20 age/sex standardised relative need | 2019/20 age/sex impact on relative need |
|---|---|---|---|---|---|---|
| Buckinghamshire, Oxfordshire and Berkshire West | QU9 | 0.889 | 0.897 | 0.893 | 0.904 | -3% |
| Frimley | QNQ | 0.879 | 0.909 | 0.905 | 0.935 | -3% |
| Hampshire and Isle Of Wight | QRL | 0.990 | 1.002 | 0.944 | 0.946 | 6% |
| Kent and Medway | QK5 | 0.990 | 0.987 | 0.944 | 0.939 | 5% |
| Surrey Heartlands | QXU | 0.960 | 0.960 | 0.929 | 0.928 | 3% |
| Sussex | QNX | 1.005 | 1.003 | 0.937 | 0.924 | 9% |
Midlands: Modelled relative need for specialised physical health services excluding HIV, NIC, MFF by ICS 2018/19, 2019/20.
| ICS | ICS code | 2018/19 relative need, unadj. | 2019/20 relative need, unadj. | 2018/19 age/sex standardised relative need | 2019/20 age/sex standardised relative need | 2019/20 age/sex impact on relative need |
|---|---|---|---|---|---|---|
| Birmingham and Solihull | QHL | 0.940 | 0.930 | 0.994 | 1.012 | -8% |
| Coventry and Warwickshire | QWU | 0.965 | 0.953 | 0.967 | 0.967 | -1% |
| Herefordshire and Worcestershire | QGH | 1.039 | 1.062 | 0.925 | 0.939 | 13% |
| Derby and Derbyshire | QJ2 | 1.050 | 1.067 | 0.989 | 0.991 | 8% |
| Leicester, Leicestershire and Rutland | QK1 | 0.915 | 0.921 | 0.918 | 0.914 | 1% |
| Lincolnshire | QUM | 1.040 | 1.044 | 0.915 | 0.912 | 14% |
| Northamptonshire | QPM | 0.973 | 0.971 | 0.968 | 0.984 | 1% |
| Nottingham and Nottinghamshire | QT1 | 1.025 | 1.026 | 1.044 | 1.039 | 0% |
| Shropshire, Telford and Wrekin | QOC | 1.094 | 1.091 | 0.986 | 0.975 | 12% |
| Staffordshire and Stoke-on-Trent | QNC | 1.072 | 1.058 | 0.999 | 1.004 | 7% |
| Black Country | QUA | 0.989 | 1.011 | 1.018 | 1.014 | 0% |
East of England: Modelled relative need for specialised physical health services excluding HIV, NIC, MFF by ICS 2018/19, 2019/20.
| ICS | ICS code | 2018/19 relative need, unadj. | 2019/20 relative need, unadj. | 2018/19 age/sex standardised relative need | 2019/20 age/sex standardised relative need | 2019/20 age/sex impact on relative need |
|---|---|---|---|---|---|---|
| Bedfordshire, Luton and Milton Keynes | QHG | 0.962 | 0.985 | 1.003 | 1.026 | -4% |
| Cambridgeshire and Peterborough | QUE | 0.899 | 0.899 | 0.924 | 0.924 | -3% |
| Hertfordshire and West Essex | QM7 | 0.971 | 0.973 | 0.971 | 0.970 | 0% |
| Mid and South Essex | QHR | 1.022 | 1.018 | 0.979 | 0.976 | 4% |
| Norfolk and Waveney | QMM | 1.115 | 1.122 | 0.981 | 0.982 | 14% |
| Suffolk and North East Essex | QJG | 1.086 | 1.080 | 0.982 | 0.979 | 11% |
| Cheshire and Merseyside | QWG | 1.091 | 1.093 | 1.043 | 1.048 | 4% |
North West: Modelled relative need for specialised physical health services excluding HIV, NIC, MFF by ICS 2018/19, 2019/20.
| ICS | ICS code | 2018/19 relative need, unadj. | 2019/20 relative need, unadj. | 2018/19 age/sex standardised relative need | 2019/20 age/sex standardised relative need | 2019/20 age/sex impact on relative need |
|---|---|---|---|---|---|---|
| Greater Manchester | QOP | 1.025 | 1.022 | 1.069 | 1.077 | -5% |
| Lancashire and South Cumbria | QE3 | 1.160 | 1.178 | 1.089 | 1.105 | 7% |
| North East and North Cumbria | QHM | 1.074 | 1.079 | 1.011 | 1.015 | 6% |
| Humber and North Yorkshire | Q50 | 1.038 | 1.025 | 0.957 | 0.972 | 11% |
| South Yorkshire | QF7 | 1.054 | 1.042 | 1.034 | 1.029 | 1% |
| West Yorkshire | QWO | 0.962 | 0.954 | 0.982 | 0.970 | -2% |
Figure 1: Specialised relative need is largely age-driven – specialised services need per person, unadjusted and age-sex standardised, by ICS, 2019/20
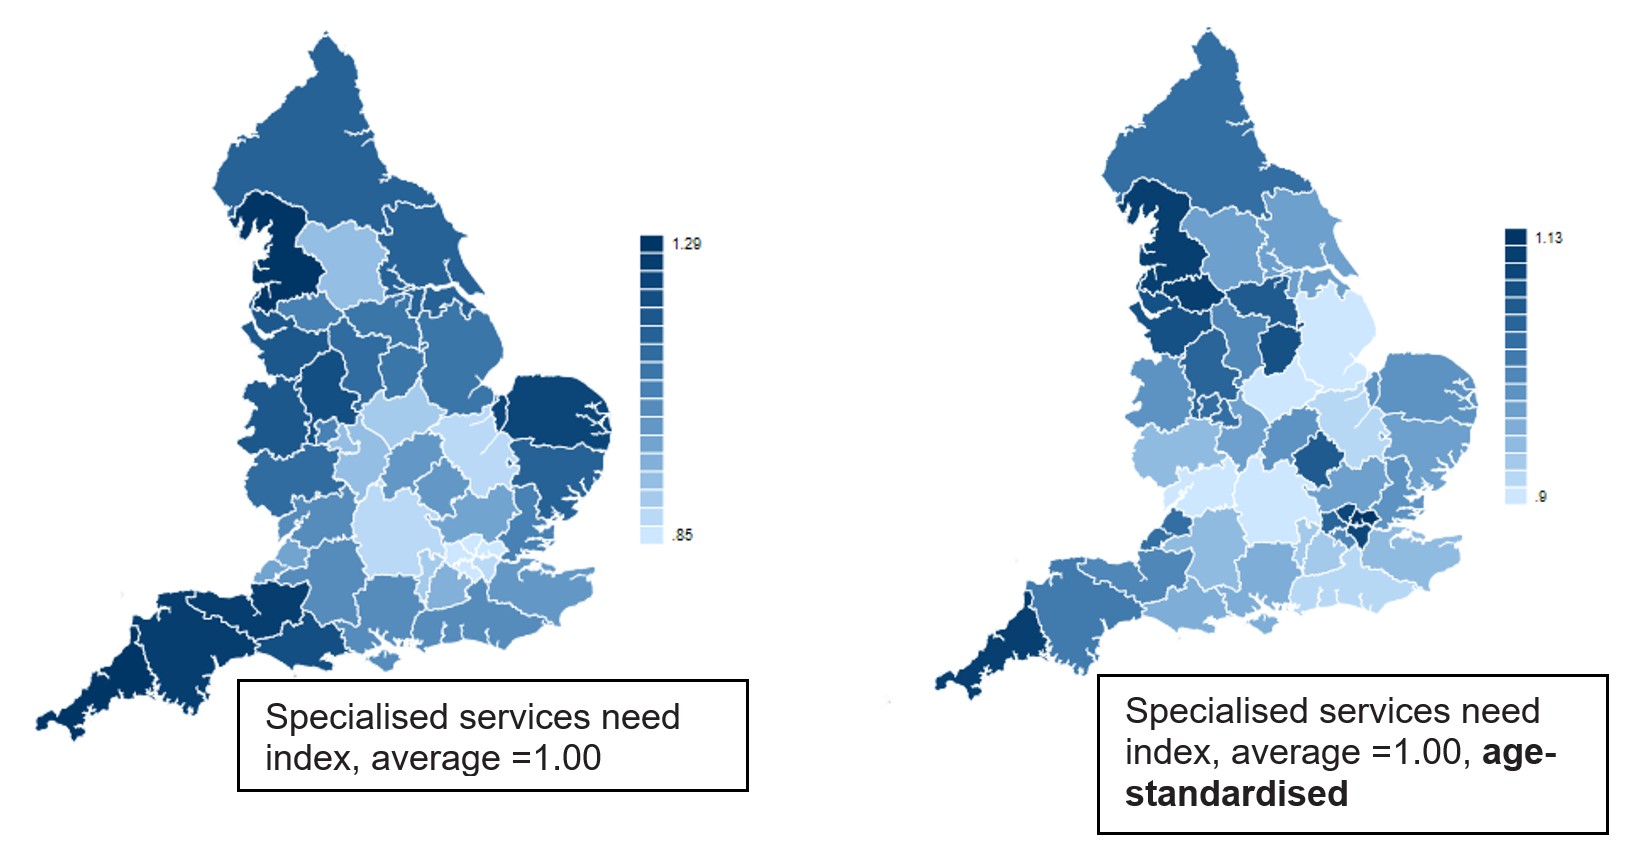
Description of Figure 1: A pair of maps of England, each showing relative intensity of need for specialised services per head across ICSs; the left hand map is unadjusted, the right hand map is age-sex standardised, portraying the distribution of need per head as it would be if the age-sex profile in each ICS were the same as for England as a whole. The maps in Figure 1 show the same information as that contained in table 4.
Urban areas tend to have lower unadjusted need per head due to their younger population profile, and higher standardised need per head due to higher levels of deprivation. The range of need is narrower on the right hand age-standardised map, as can be seen from the fact the scale runs from 0.9 in Buckinghamshire, Oxfordshire and Berkshire West to 1.13 in North East London, whereas the unadjusted need index runs from 0.85 in North West London to 1.29 in Cornwall and the Isles of Scilly.
Overall, the impact of age and sex on estimated need outweighs the impact of other factors. In 2019/20, the average absolute difference from mean age-sex-standardised need is 4.7%, while the average impact of age and sex is 7.4%.
5.6.4 Impact by age and deprivation and ethnicity
The need indices for age and IMD quintiles are shown in Table 5 below. These quintiles are derived by assigning each GP practice to an age and deprivation quintile based on the characteristics of their registered population. In this way it is possible to examine how needs indices vary by age and deprivation for different models.
As with the model for general and acute services, so also for the model of specialised service need, there is a pattern of higher need for areas with older more deprived populations and a lower level of need in areas with younger less deprived populations.
There is, however, somewhat less variation across the age and deprivation matrix for specialised services than is seen for general and acute services: the need indices for areas with young and less deprived populations for specialised services (towards the top-left of the tables) are less than one (meaning that there is less than average need per head of population) but higher than for general and acute services; and areas with older more deprived populations (bottom-right of tables) have needs indices that are above one (greater than average) but lower than for general and acute services.
Table 5: Comparison of 2022/23 need indices for specialised services and general and acute models by age/deprivation quintile (excluding HIV and NCC)
General and acute services
|
Age quintile (A1 = youngest quintile, A5 = oldest quintile) |
A1 |
A2 |
A3 |
A4 |
A5 |
Total |
|
Deprivation quintile (D1 = least deprived, D5 = most deprived) | ||||||
|
D1 |
0.61 |
0.80 |
0.91 |
1.00 |
1.11 |
0.97 |
|
D2 |
0.63 |
0.87 |
0.98 |
1.07 |
1.17 |
1.01 |
|
D3 |
0.68 |
0.92 |
1.03 |
1.13 |
1.23 |
0.99 |
|
D4 |
0.76 |
0.97 |
1.10 |
1.18 |
1.27 |
0.99 |
|
D5 |
0.86 |
1.07 |
1.17 |
1.25 |
1.43 |
1.05 |
|
Total |
0.75 |
0.94 |
1.03 |
1.09 |
1.17 | |
Specialised services
|
Age quintile (A1 = youngest quintile, A5 = oldest quintile) |
A1 |
A2 |
A3 |
A4 |
A5 |
Total |
|
Deprivation quintile (D1 = least deprived, D5 = most deprived) | ||||||
|
D1 |
0.69 |
0.90 |
0.98 |
1.01 |
1.07 |
0.99 |
|
D2 |
0.71 |
0.95 |
1.00 |
1.04 |
1.10 |
1.00 |
|
D3 |
0.79 |
0.99 |
1.00 |
1.05 |
1.12 |
0.99 |
|
D4 |
0.91 |
1.02 |
1.02 |
1.07 |
1.15 |
1.01 |
|
D5 |
0.93 |
1.01 |
1.07 |
1.12 |
1.21 |
1.01 |
|
Total |
0.86 |
0.98 |
1.01 |
1.04 |
1.10 |
|
The age gradient for specialised services is exaggerated by the omission, for the reasons given above, of HIV and NCC services from the model.
The correlation of specialised services need with deprivation is also apparent in the following chart (figure 2).
Figure 2: Age-standardised need associated with deprivation and ethnic diversity – specialised services need per person, age-sex standardised, against IMD, with ethnic diversity highlighted, by GP practice, 2019/20
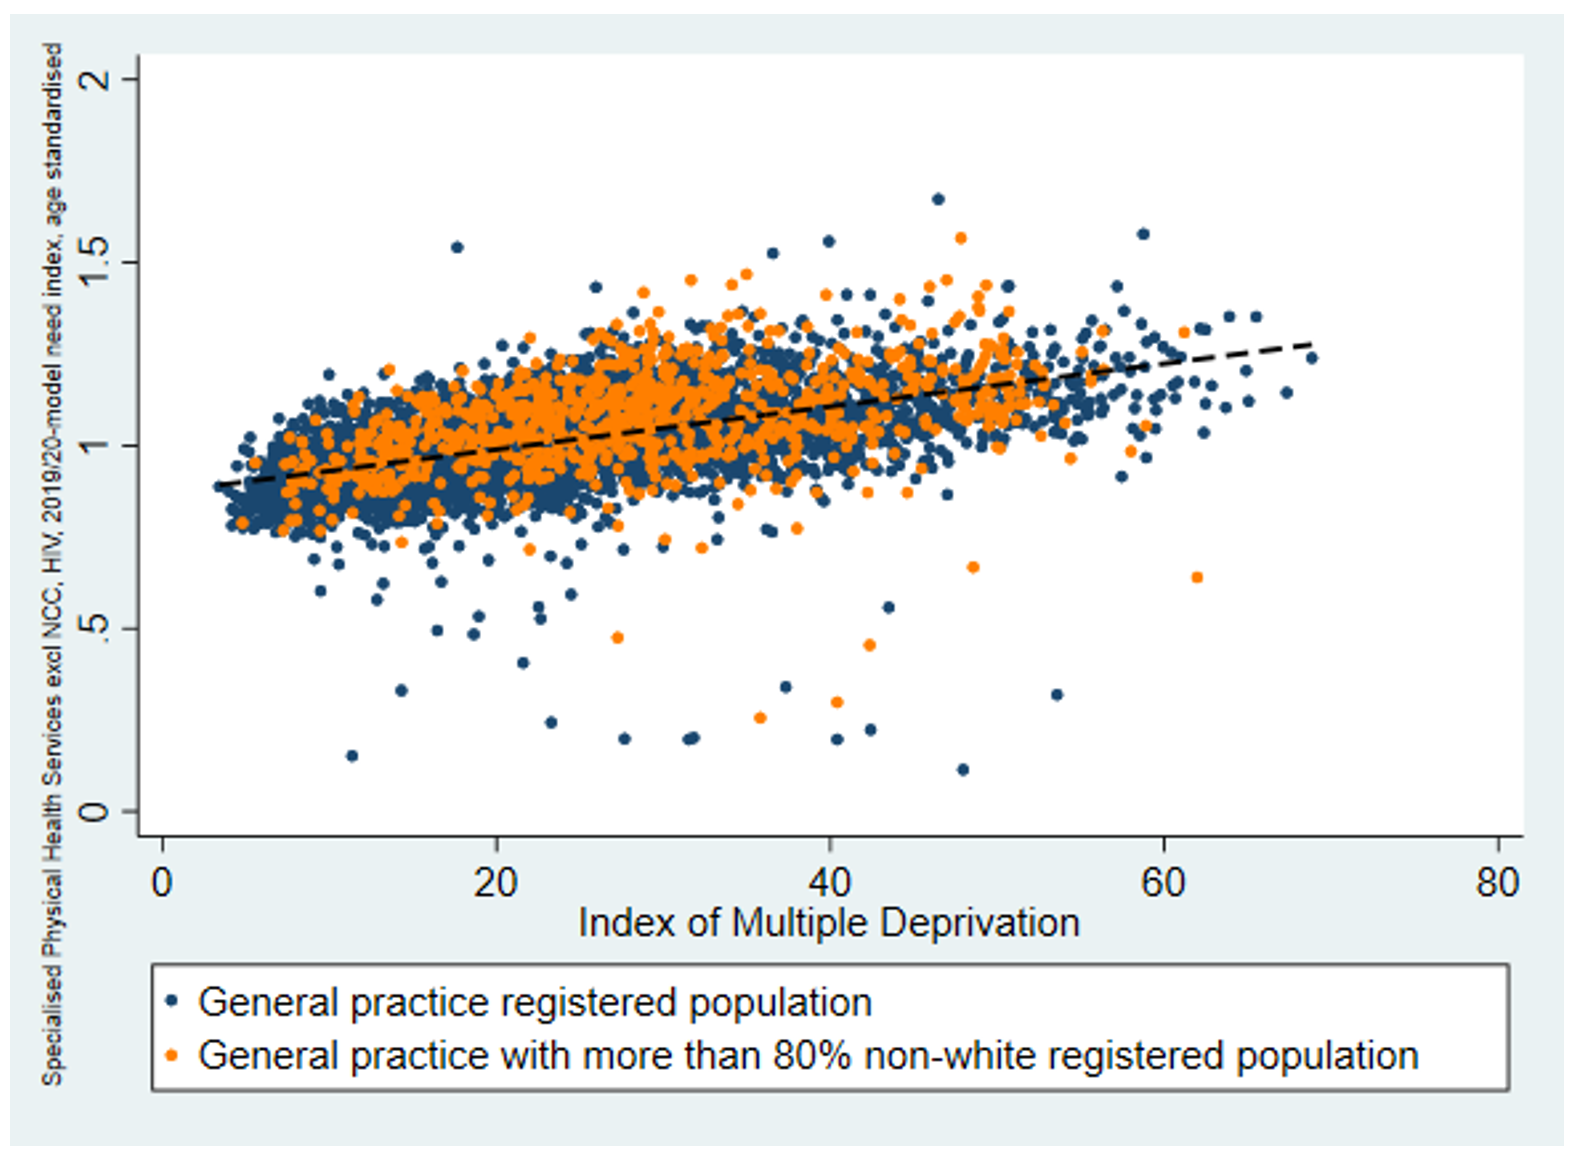
The graph excludes five outlier practices with need indices in excess of 2.
Description of Figure 2: The figure shows a scatterplot with a dot representing each GP practice, ordered by increasing deprivation from left to right on the x-axis and increasing age-sex-standardised need (using the aggregate 2019/20 model excluding NCC and HIV) from bottom to top on the y-axis. The dots are concentrated around a best fit line that slopes gently upwards from lower need and deprivation in the bottom left to higher need and deprivation on the top right. About a fifth (21.5%) of the variation in age-sex-standardised need is shown to be associated with deprivation. (The graph excludes five outlier practices with need indices in excess of 2. The full data gives a best fit line as follows: 𝑦=0.8721+0.0059 𝑥 where y is the physical health age standardised need index and x is the index of multiple deprivation. Both constant and slope are statistically significant.) Some of the remaining variation is associated with ethnicity: GP practices with more than 80% non-white registered population are highlighted; the highlighted practices tend to be above the best fit line, indicating that, other things equal, need tends to be higher amongst more diverse populations.
The importance of ethnicity in predicting need is evident from the trend and magnitude for the ethnic category variables in the model, with mixed ethnic groups showing negative (though not always significant) coefficients, and the non-mixed, non-white ethnic groups generally showing positive significant costs. The exception to this trend is the Chinese group which shows a significant negative cost relative to the white British ethnic group, which is the control group. (As mentioned in section 5.6.2, such negative-coefficient ethnic variables are set to match the White-British group, as ACRA deems negative coefficients as likely to reflect unpresented need rather than lower levels of need for these groups. Broadly, were the negative-coefficient ethnic variables interpreted as representing reduced need, the impact would be to reduce needs weighting for specialised services for the London ICSs relative to less diverse parts of the country by between one and two percentage points.)
Figure 3 shows the broad correlation that exists between the needs indices respectively for general and acute services and for specialised services according the 2019/20 models.
Figure 3: Correlation between general and acute and specialised need – specialised services need per person, age-sex standardised, against general and acute need, with ethnic diversity highlighted, by GP practice, 2019/20
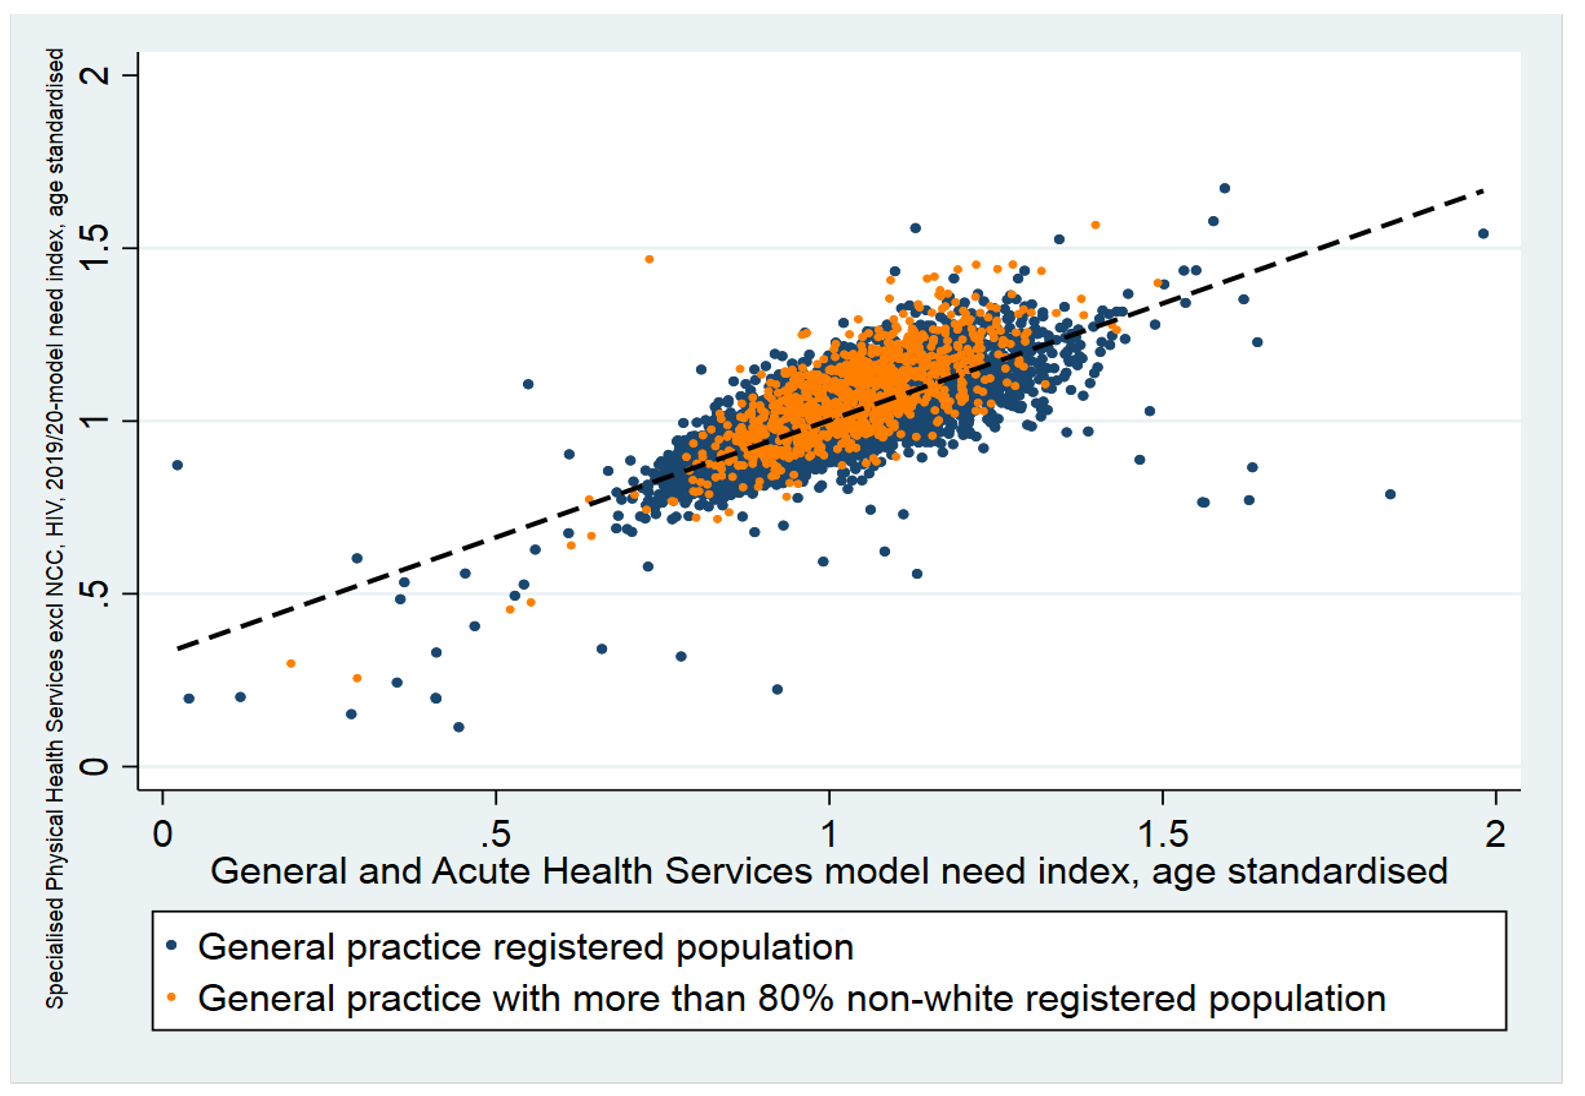
Description of Figure 3: The figure shows a scatterplot with a dot representing each GP practice, ordered by increasing age-sex-standardised need for general and acute (that is, non-specialised services) from left to right and increasing age-sex-standardised specialised need (excluding HIV and NCC) from bottom to top. The dots are concentrated around a best fit line that slopes gently upwards from lower need in the bottom left to higher need on the top right, indicating that factors that drive need for one set of services also tend to drive need for the other. (The graph excludes six outlier practices with specialised need indices in excess of 2. The full data gives a best fit line as follows: 𝑦=0.2651+0.7383𝑥. Both constant and slope are statistically significant.)
Just over a half of the variation in need (54%) for specialised services at GP practice level is correlated with variation in non-specialised.
5.6.5 Relative need for different services
To understand better the service-components of the need for specialised services that we are modelling, four indicative sub-models have been created. These models will not be used for allocating funds for these services to ICBs but may be of use to commissioners in benchmarking their expenditure on the different services, and in understanding their overall target allocation relative to baseline expenditure.
For these sub-models, the same overall approach is taken, but instead of modelling the factors that determine individuals’ utilisation of physical health services overall (with the exceptions noted), we seek to understand what drives utilisation respectively of:
- cancer services
- cardiac services
- renal services
- neurosurgery services
5.6.6 Model stability
The need indices for specialised services are derived from the model using needs-variables from the base years of 2017/18 and 2018/19 to predict utilisation of specialised services in the fiscal year 2019/20, as described above.
This delivers estimates of the relative need for specialised services of each age-sex cohort of each GP practice in the country. As mentioned, these are applied forward to the populations projected for each forward year in the allocation using population projections published by ONS. This assumes that a reasonable predictor of relative need in the forward year is the relative need of a given age-sex cohort in the same GP practice in the modelled year. This assumption can be tested by assessing model stability between years.
The stability of the model was tested through comparison of needs indices between the 2018/19 and the 2019/20 models. ACRA has reviewed the results of this comparison and found adequate stability of the specialised services model between 2018/19 and the 2019/20. Need indices were produced for the 2019/20 model run using the 2018/19 population to ensure that any differences in need indices observed are not due to changes in population. Figure 4 shows the results.
Figure 4: Stability of specialised need estimates at ICS level between 2018/19 and 2019/20 – specialised services need per person, by ICS, respectively for 2018/19 and for 2019/20, both for 2018/19 populations
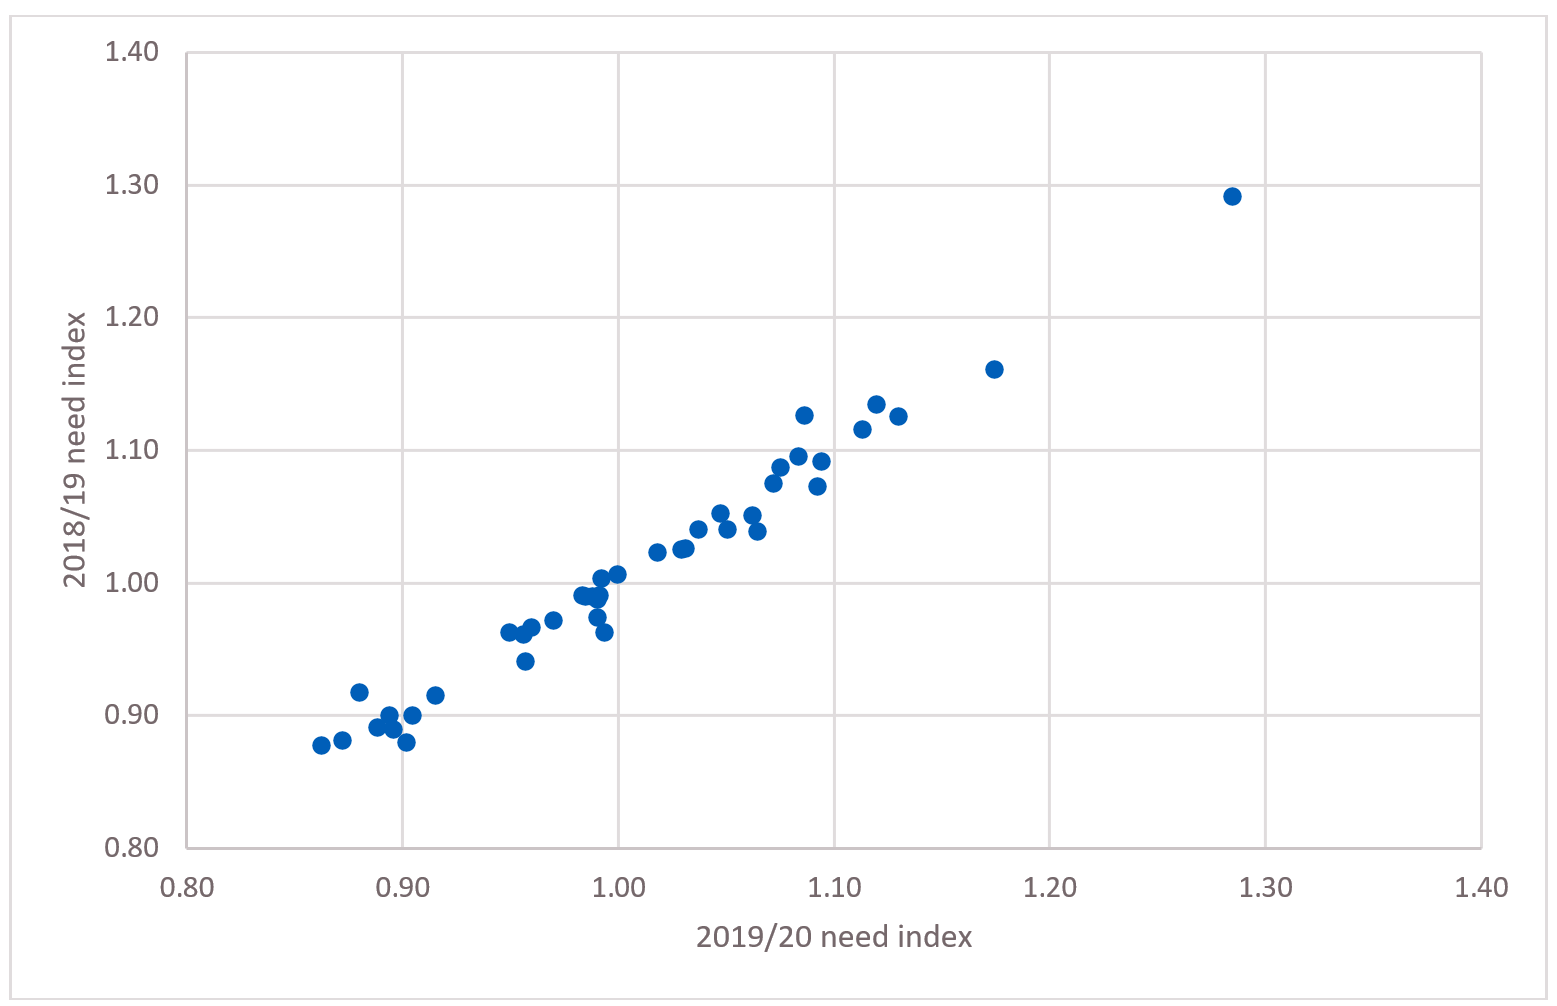
Description of Figure 4: The chart is a scatterplot plotting for each ICS its 2019/20 model need index for specialised services on the x-axis and its 2018/19 need index on the y-axis. The plotted points hug the 45-degree line and thus show that there is a great deal of stability between need indices from the 2018/19 and 2019/20 models; no ICS has a difference between the 2018/19 and 2019/20 need indices of more than 4%.
Although the net results of the model indices are relatively stable between the two years, the coefficients between the two models are quite different. This is not unexpected given that the variables that explain a large proportion of the variation in the dependent variable – the diagnostic dummies – are not entirely independent of the comorbidity variables and the morbidity count variables, both of which are subject to t-statistic-selection.
Differences in the comorbidity and morbidity variables that are included or excluded through the t-selection process will have an impact on the size and direction of the coefficients relating to the diagnostic dummies. There is also a different provider and CCG base incorporated into the constant, and this, along with other model differences may impact the constant as well as the size, direction and significance of other variables in the model. The value of the constant is different between the two years – being negative in 2018/19 and positive in 2019/20.
It is also unsurprising that the mix of diagnoses on people’s historical record that is predictive of specialised need varies from year to year without much impact on the aggregated needs indices: the diagnosis variables may collectively be measuring a susceptibility to conditions needing specialist care that is robust to changes in the mix of diagnoses that are found individually significant. In other words, although from year to year the precise mix and weighting of diagnoses varies, it will be the same age sex cohorts in each GP practice that are highlighted as likely to need more specialised resource in the target year.
There is a similar trend between the two models for the count of diagnoses variables: increasing number of diagnoses are associated with increasing sizes of coefficient, although the size of the coefficients is smaller in 2019/20 indicating that more predictive power is coming from the morbidity and comorbidity dummy variables than from the diagnostic counts. There is also a similar trend and magnitude for the ethnic category variables between the two models. The coefficients for the 2018/19 and 2019/20 models are shown in Annex C.
5.7 HIV and NCC model adjustments
5.7.1 HIV
HIV services could not be included in the aggregate physical health model because, for reasons of confidentiality, information about the personal diagnostic history could not be linked to information about utilisation of these services (even in pseudonymised form).
HIV services represent around 3% of specialised physical health services total spending (including drugs and devices but excluding highly specialised services), and the geographical distribution of need for this service is unlikely to match that of other specialised services. It is therefore necessary to construct a separate model of the likely pattern of need for HIV services and to use that to make an adjustment to the target allocation for physical health services in aggregate.
An alternative approach would have been to exclude HIV from the needs-based allocation, continuing to allocate these services on the basis of historical funding. However, the historical development of payment locally to provide for these services, as for other specialised services, has been subject to myriad influences that may have led to funding and access to services that does not equitably reflect the characteristics of local populations.
The dataset from Public Health England we have used to develop the HIV adjustment suggests that some 95% of the variation in spend on HIV by ICS population is explained simply by variation in the number of patients.
Our approach is to adjust the fair-shares allocation by taking the segment of spend on HIV and allocating it notionally to ICSs pro rata to the distribution of the patients registered for HIV services (85,143 in the model year), adjusting the allocation for MFF for the non-drug portion of spending.
In theory, a more complex model could be created, one that allows for age, sex, co-morbidities, cultural variation, ethnicity effects, etc. In practice, this is not possible given the interdiction on establishing person-level data linkage. What may be possible is to introduce adjustments for the proportions of new and of complex patients in each area. On current data, variation in commissioner cost per patient is not explained by the proportions of ‘new’ or ‘complex’ patients. Such a refinement may be considered again later with more years’ data, or with bottom-up costing estimation.
There is attraction in the simplicity of a notional allocation based entirely on a patient count. Variation in expenditure from HIV need estimated in this way is entirely attributable to variation in HIV spending per person with HIV. As this does not seem to be accounted for by variation in case-complexity, it is plausibly related either to variation in pathway design and efficiency, or to variation in the scope of services funded directly by NHS England (variation in the funding boundary with CCGs and Local Authorities). Neither should be taken into account in the needs-based target allocation. (As mentioned, the calculations do take account of variation in unavoidable costs due to location, the MFF.)
ACRA supports this simple approach to creating an HIV adjustment to the target needs indices for specialised physical health services.
The ICS need indices for HIV services are shown in table 7 at the end of section 5.7. Figure 5 illustrates the geographical pattern of need for HIV services.
Figure 5: The geographical pattern of need for HIV services – specialised HIV services need per person, by ICS, 2019/20
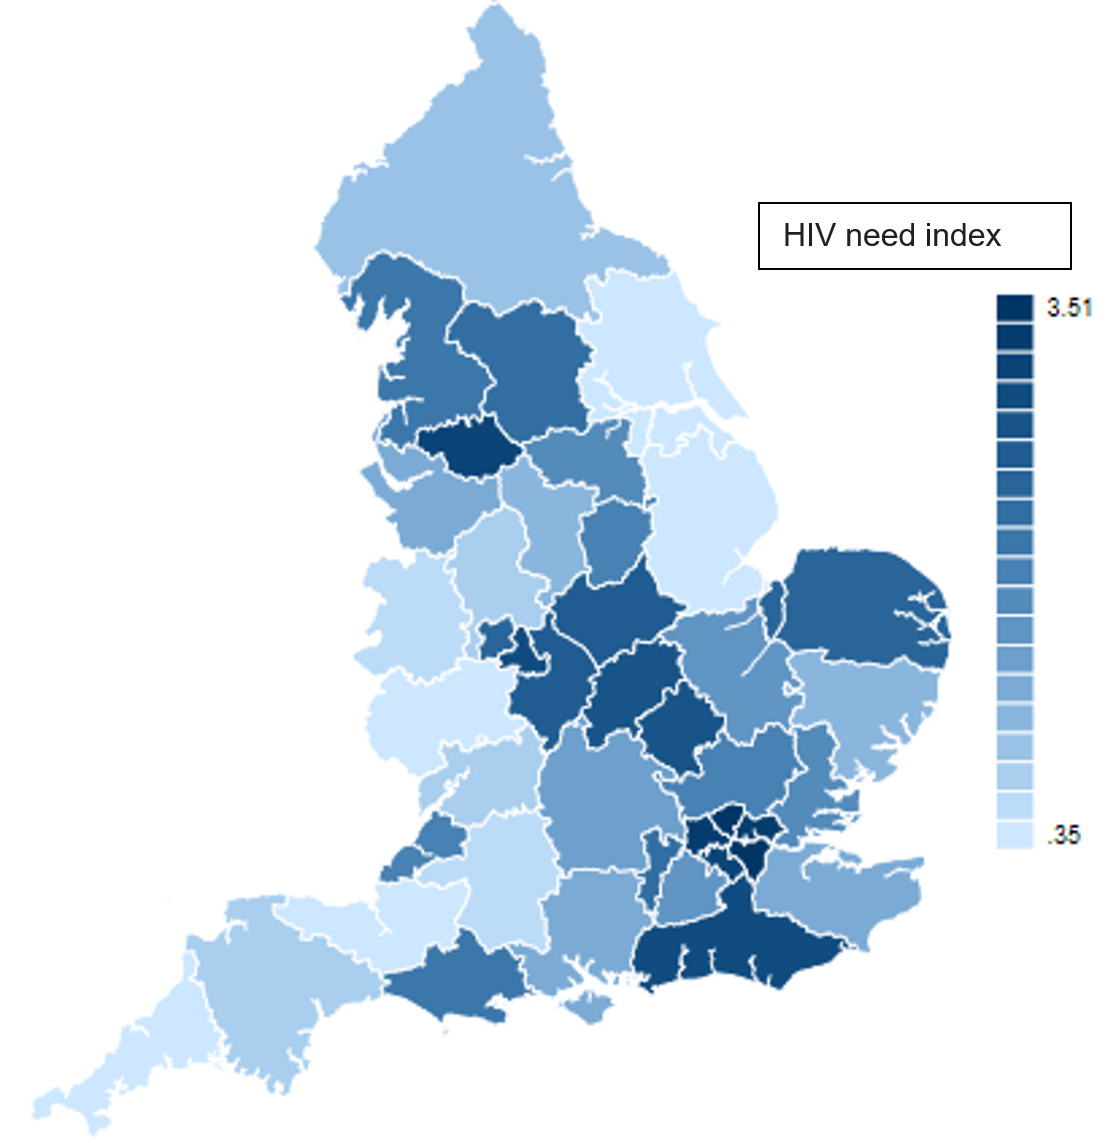
Description of Figure 5: A map of England showing relative intensity of need for specialised HIV services per head across ICSs. The map shows a deeper colour for areas according to their relative need for HIV services per head of population, which ranges dramatically from 0.35 in Herefordshire and Worcestershire to 3.51 in South East London. In general, the map shows higher need in London and to a lesser extent in surrounding areas and in other conurbations.
5.7.2 Neonatal critical care
Because NCC services are provided for persons who do not have a medical history and have not been born at the start of the target year, they could not be included in the main model of specialised services utilisation, which starts with a list of patients registered to GP practices at the start of the model’s target year, and links to each person’s medical history to assess need-drivers. So, an off-model adjustment is required.
NCC services represent around 5½% of specialised physical health services total spending (excluding highly specialised), and the geographical distribution of need for this service is unlikely to match that of other specialised services. It is therefore necessary to construct a separate model of the likely pattern of need for NCC services and to use that to make an adjustment to the target allocation for physical health services in aggregate.
An alternative approach would have been to exclude NCC from the needs-based allocation, continuing to allocate these services on the basis of historical funding. However, the historical development of payment locally to provide for these services, as for other specialised services, has been subject to myriad influences that may have led to funding and access to services that does not equitably reflect the characteristics of local populations.
To model NCC services use, we have developed an area-based model in order to give an idea of the likely geographical spread of service need. We have discussed the area-based approach, and alternative person-based approaches (linking babies to their mothers to provide person-level risk variables), with TAG (ACRA’s technical advisory group), and subsequently with ACRA, who have endorsed the approach here described.
For an area-level approach, it is necessary to determine a geographical level of analysis. And we also require a metric of resource use. These are discussed in turn:
a) Geography. Candidates for level of granularity included: lower layer super output areas (LSOA), middle layer super output areas (MSOA), each of which describes a geographical patch (of increasing size). There are 32,844 LSOAs in England, with populations averaging around 1,500 and ranging from one to three thousand, and 6,791 MSOAs, which are five times as populous. Modelling records at LSOA level is problematic due to small numbers: on average there are 17 babies born in an LSOA. The analysis was therefore conducted at MSOA.
b) NCC resource use and cost-weights. Given the availability of a set of activity categories that are designed to be homogeneous in resource use, the NCC Healthcare Resource Groups (HRGs), it was determined to model cost-weighted resource use rather than expenditure. (Many specialised services lack established HRGs, so the main physical health model uses expenditure; the general and acute model used for allocating non-specialised funding is estimated against cost-weighted activity.) A set of cost-weightings for NCC have been promulgated, and are shown in Table 6:
Table 6: Neonatal critical care cost-weights per cot day
| HRG | Description | Relative weight |
|---|---|---|
| XA01Z | Neonatal Critical Care, Intensive Care | 4.0 |
| XA02Z | Neonatal Critical Care, High Dependency | 2.0 |
| XA03Z | Neonatal Critical Care, Special Care, without External Carer | 1 |
| XA04Z | Neonatal Critical Care, Special Care, with External Carer | 0.8 |
| XA05Z | Neonatal Critical Care, Normal Care | 0.6 |
This can be applied to activity data from the critical care minimum data set (CCMDS) at cot-day level to derive a measure of resource use as cost-weighted activity at MSOA level.
The principal driver for determining need for NCC services is naturally the number of babies born in a period, which prospectively can be taken from ONS projections.
Following advice from TAG, modelling was conducted using cost weighted resource use per birth as the dependent variable.
We need also to take account of the risk factors that are known to be associated with recourse to critical care usage, rolling these (if stable) forward from model year to the target allocations year.
We have data on the number of live births at the geographic level of MSOAs for the years 2017/18, 2018/19 and 2019/20. Our sample has 6,749 MSOAs of which 25 share activity in more than one CCG. As we wished to use CCG-specific variables to control for supply effects, our unit cell level is the concatenation of a MSOA and CCG.
A range of drivers of NCC use were explored. These included factors characterising the births within an MSOA in the two years prior to a target year: the proportion of births within various low birthweight categories, and the proportion of births within various categories of gestation length. We also explored the predictive power of a relevant deprivation dimension, including the IMD sub-domain recording the proportion of children living in the geography who are subject to income deprivation (IDACI), and maternal age.
The proportion of low gestation length births in an area was the only driver found significant in the final model. This variable may itself be the conduit by which other factors that might contribute to recourse to critical care have impact, factors such as maternal age, poor maternal health and smoking during pregnancy, and more generally, deprivation.
CCG supply variables are included in the model and sterilized in derivation of need indices. As in the general and acute model, use of cost-weighted activity as the dependent variable obviates the requirement to include provider-specific supply variables.
Our covariates in the final model are therefore: the proportion of preterm births defined as the mean of the proportions of preterm births for the years 2018-2019 and 2017-2018, and CCG fixed effects.
For the pre-term variable, we found a number of MSOAs had implausibly high numbers of pre-term births recorded. We assume that this is poor data. We define an outlier MSOA as one where the average proportion of preterm births across the two years 2018/19 and 2017/18 is higher than the national mean value of the average proportion plus two standard deviations. Following this rule, we find 202 MSOAs that are classified as outliers. (Many of the outliers were concentrated in a specific ICS, perhaps indicating miscoding by a particular unit.) We substitute the mean MSOA proportion of preterm births for the outlier values, using the mean value of the average of the preterm proportions for the years 2018/19 and 2017/18.
Thus, the model predicts NCC service need in an area on the basis of the number of babies born in the target year modified to allow for the greater likelihood of critical care use in areas with a higher proportion of births of premature gestational length in the previous two years. The coefficient on this variable is 0.66 and is highly significant. However, it is variation in birth rates that is responsible for the majority of the variation in the NCC need index at ICS level.
Expenditure that is out of line with model predictions is plausibly related to variation in access thresholds for these services, or to variation in pathway design efficiency, or to variation in local prices that are charged for these services. None of these should be taken into account in the needs-based target allocation.
The ICS need indices for NCC services are shown in table 7 below. Figure 6 illustrates the geographical pattern of need for NCC services.
Figure 6: The geographical pattern of need for NCC services – specialised NCC services need per person, by ICS, 2019/20
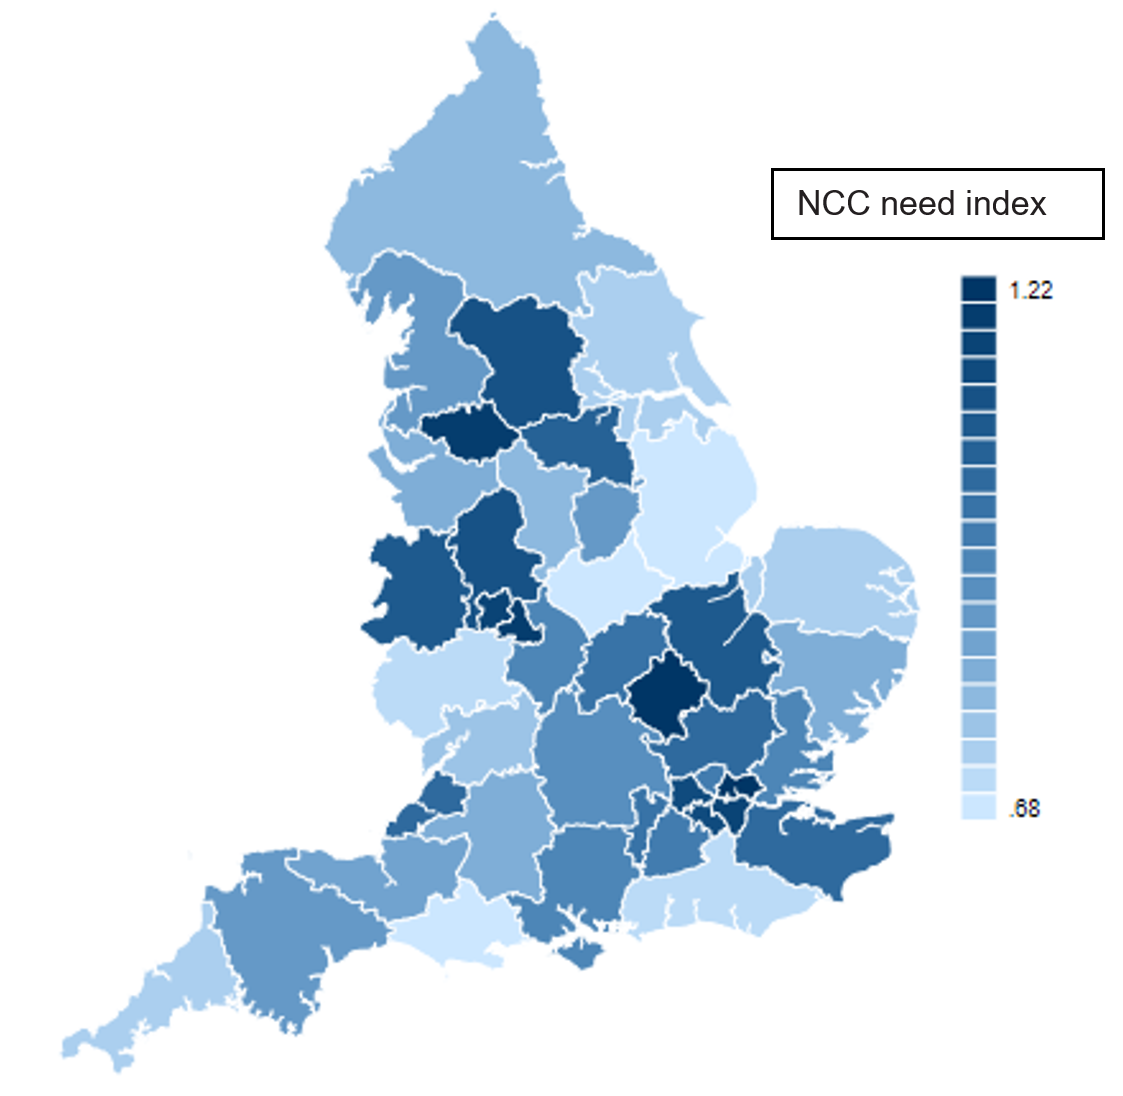
Description of Figure 6: A map of England showing relative intensity of need for specialised NCC services per head across ICSs. The map shows a deeper colour for areas according to their relative need for NCC services per head of population, which ranges from 0.68 in Dorset to 1.22 in Bedfordshire, Luton and Milton Keynes. In general, the map shows higher need in and around the major conurbations, principally reflecting their higher birth rates.
5.72 Modelled need indices for aggregate physical health services adjusted for HIV and NCC
Table 7 shows (in column a) the relative need indices by ICS for the specialised physical health model excluding HIV and NCC described in section 5.6, estimated on the 2019/20 target year, and projected forward for 2022/23 populations. Table 7 can be found in the separate workbook titled “Table 7, Annexes B, C to Prescribed specialised services needs-based allocations methodology” published alongside this document. Alongside are estimated need indices for HIV and for NCC services (columns b and c), for which 2019/20 populations were used (as more recent data is COVID-19-affected). Column d gives the aggregate index of need incorporating all these services. This is derived by weighting the three indices together according to their estimated expenditure weights in 2022/23 (5.5% NCC; 2.9% HIV).
Figure 7 illustrates the geographical pattern of the aggregate index of need for specialised physical health services (without MFF and health inequalities unmet need, HI-UN adjustments). This is a weighted average of the needs patterns displayed in the left-hand panel of Figure 1, relating to all services other than HIV and NCC, combined with that displayed in figures 5 and 6 relating to HIV and to NCC services respectively.
Figure 7: The geographical pattern of aggregate need for specialised physical health services – specialised physical health services need per person, before MFF and HI-UN adjustments, by ICS, 2019/20
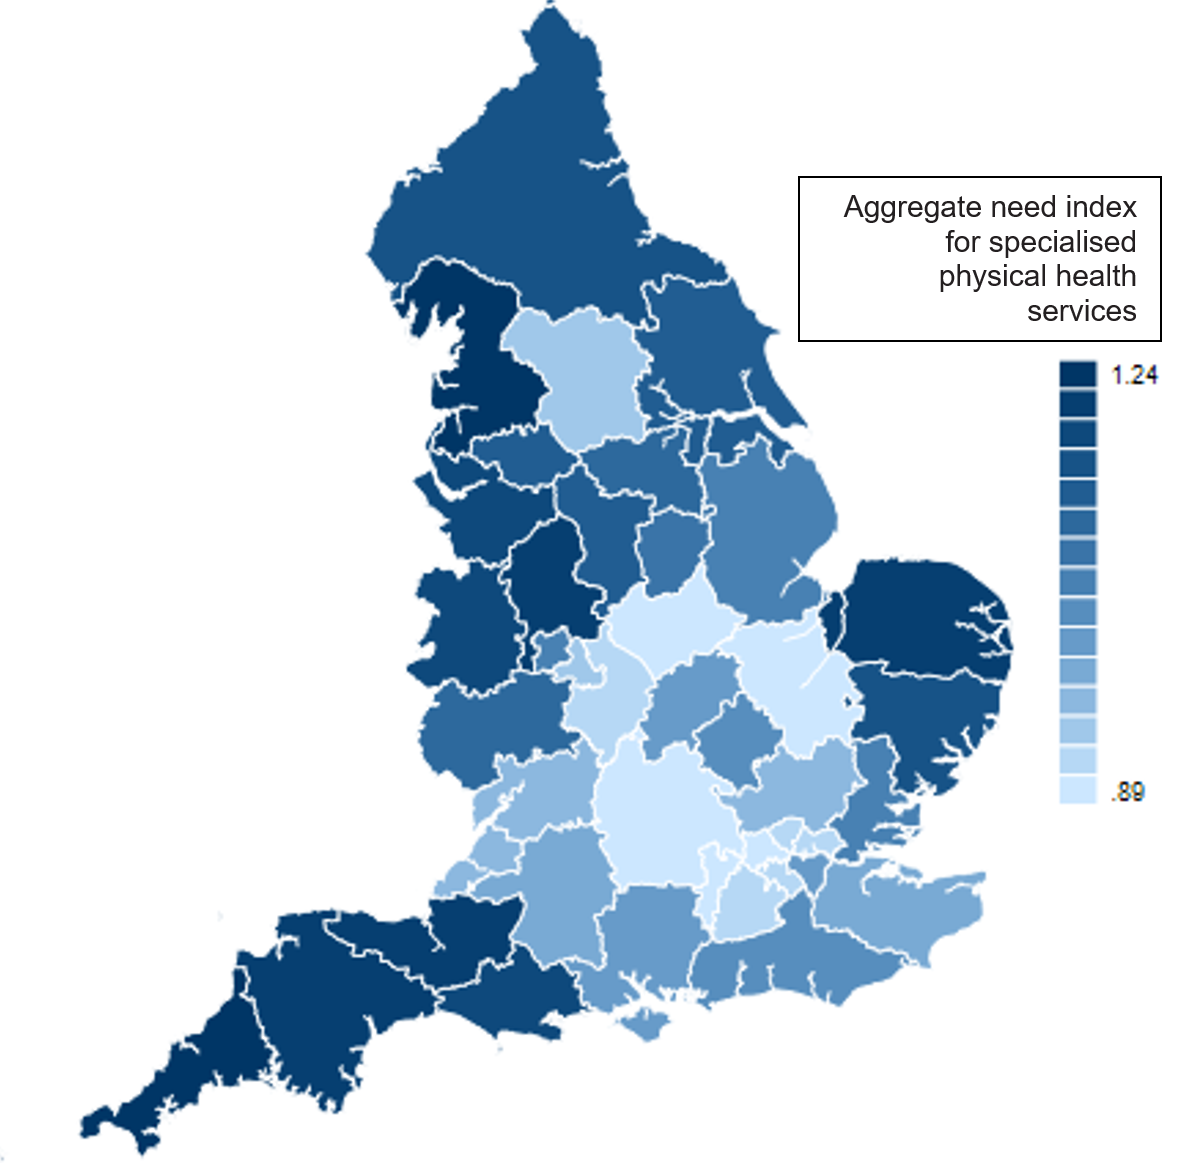
Description of Figure 7: A map of England showing relative intensity of need for specialised physical health services in aggregate per head across ICSs. The map shows a deeper colour for areas according to their relative need for specialised physical health services per head of population, which ranges from 0.89 in Buckinghamshire, Oxfordshire and Berkshire West to 1.24 in Cornwall and the Isles of Scilly. In general, the map shows higher need in peripheral regions, principally reflecting age and deprivation.
The needs indices for HIV and NCC respectively will be rolled forward to act as an adjustment to the aggregated model need for other services in each year for which a target allocation is required. Stability of the geographical distribution and the overall weight of NCC need and HIV need among specialised physical health services is a formal assumption according to ACRA’s usual practice; no forecast of relative need for these services relative to other specialised services is implied. However, the recent increase in investment in NCC services, which is expected to be sustained, is recognised in the relative share of NCC in 2022/23.
Column e in table 7 shows the specialised services MFF which is applied to the needs indices to recognise unavoidable costs. (The MFF is an estimate of unavoidable cost differences incurred in providing health services from different geographical locations that is used to adjust resource allocations so that patients are neither advantaged nor disadvantaged by the relative level of unavoidable costs in different parts of the country). The specialised services MFF is derived taking account of the share of services to a given population flowing from providers with different MFF adjustments. As patients are more likely to travel to receive specialised services, the specialised MFF is less differentiated than that for other services. (Note that the MFF is applied to weighted populations not need indices because the weighted populations have to be re-normalised at each stage; hence column f is not precisely equal to the product of columns d and e.) See section 5.2 of the Technical guide to allocation formulae and convergence for 2023/24 to 2024/25 revenue allocations.
Column g gives the health inequalities index, derived from relative avoidable mortality in each ICS. The weighting for the health inequalities index for specialised services is 5%. See section 4.8 of the Technical guide to allocation formulae and convergence for 2023/24 to 2024/25 revenue allocations.
Finally, column h shows the aggregated fully adjusted needs index for 2022/3 by ICS population for specialised services, having allowed both for unavoidable costs and the health inequalities adjustment. Please see Table 7 in the separate workbook titled “Table 7, Annexes B, C to Prescribed specialised services needs-based allocations methodology” published alongside this document.
Annex A: ACRA’s criteria for assessing formula
ACRA criteria for assessing formulae
| Criteria | Definition |
|---|---|
| Transparency and simplicity | The construction and application of the formula should aim for simplicity, be well documented and be open to scrutiny. |
| Comprehensibility | The formula and its derivation should be explainable to non-specialists in plain English and be capable of common sense justification, even if the detail is understood only by specialists. |
| Evidence base | The formulae are based on the best evidence available. |
| Technical robustness | The techniques used must be consistent with best practice methods for statistical and econometric modelling and be applied appropriately. |
| Objectivity | Formula should be based on plausible relationships and there should be tests of bias, robustness, statistical significance and explanatory power. |
| Flexibility | The recommendations can respond to changes of commissioning responsibilities (e.g. coverage of services) and size. |
| Parsimony | The formula should not include relationships of low materiality. All other things being equal fewer rather than more variables are preferred. |
| Plausibility | The measures & relationships in the formula should be plausible and have face validity. |
| Clarity of contribution of indicators | The contribution made by individual components in the formula should avoid ambiguity. Where multiple indicators are used the purpose, weighting and selection must be clear. |
| Reliability of data | The data are available and consistent for all local areas (units of allocation) where possible and not subject to local variations in reporting. |
| Freedom from perverse incentives | The methods and data sources used to calculate the formula should not create perverse incentives either for manipulating data or other negative behaviours. |
| Durability and stability | The relationships used to drive the formula should be durable and the data used to derive the formula should be stable. |
| Updateable | The scale of the work required to update the formula is manageable within the time constraints of the allocation cycle. |
Annex B: Variables tested in the model
The full set of variables used in the modelling, including those surviving the PCA process described in section 5.4.2, are listed below.
In addition to these variables, modelling also explored the possible significance of two types of supply variables:
- variables representing the quality of primary and secondary care services, in case these systematically influenced recourse to specialised services.
- variables representing the travel times to specialised services centres, in case access variability could be captured by such variables.
In neither case did significant results emerge in a systematic credible way, and the models’ ability to explain variation was not enhanced. It is possible however that these effects are captured by the CCG-specific and provider-specific supply variables in the preferred model.
Individual characteristics
| Age/sex splines | |
| Age <1 | Age 45-49 |
| Age 1-4 | Age 50-54 |
| Age 5-9 | Age 55-59 |
| Age 10-14 | Age 60-64 |
| Age 15-19 | Age 65-69 |
| Age 20-24 | Age 70-74 |
| Age 25-29 | Age 75-79 |
| Age 30-34 | Age 80-84 |
| Age 35-39 | Age 85+ |
| Age 40-44 | |
| Household type | |
| Care home | Single person |
| Multi-adult (reference group) | Two adult family |
| Multi-adult-child | Two adults diff gender |
| Multi-child | Two adults’ same gender |
| Other communal | Unknown |
| Single parent | |
| Age and household type interactions | |
| Ethnic group | |
| White British (reference group) | |
| White: Irish | Bangladeshi |
| White: Other White | Chinese |
| White and Black Caribbean | Other Asian |
| White and Black African | African |
| White and Asian | Caribbean |
| Other Mixed | Other Black |
| Indian | Any other ethnic group |
| Pakistani | |
| Newly registered with a GP practice | Private care in last two years |
Diagnoses – included as individual diagnostic flags and as morbidity count variables
| A00-A09 Intestinal infectious diseases | K65-K67 Diseases of peritoneum |
| A15-A19 Tuberculosis | K70-K77 Diseases of liver |
| A20-A49 Certain bacterial diseases | K80-K87 Disorders of gall bladder, biliary tract & pancreas |
| A50-A64 Infections with predominantly sexual mode of transmission | K90-K93 Other diseases of the digestive system |
| A65-A79 Other infectious and parasitic disorders | L00-L14 L55-L99 Other infections and disorders of the skin |
| A80-A89 Viral infections of the central nervous system | L20-L30 Dermatitis and eczema |
| A90-A99 Arthropod-borne viral fevers & viral haemorrhagic fevers | L40-L45 Papulosquamous disorders (including Psoriasis) |
| B00-B09 Viral infections characterized by skin & mucous mem. lesns. | L50-L54 Urticaria and erythems |
| B15-B19 Viral hepatitis | M00-M25 Arthropathies |
| B20-B24 Human immunodeficiency virus [HIV] disease | M30-M36 Systemic connective tissue disorders |
| B25-B34 Other viral diseases | M40-M54 Dorsopathies |
| B35-B49 Mycoses | M60-M79 Soft tissue disorders |
| B50-B64 Protozoal diseases | M80-M94 Osteopathies and chondroplasties |
| B65-B83 Helminthiases | M95-M99 Other disorders of the musculoskeletal system & conn. tiss. |
| B85-B99 Other infectious and parasitic diseases | N00-N08, N10-N16 Diseases of the kidney |
| C00-C14 Malignant neoplasm of liporal cavity and pharynx | N17-N19 Renal failure |
| C15-C26 Malignant neoplasm of digestive organs | N20-N23 Urolithiasis |
| C30-C39 Malignant neoplasms of respiratory & intrathoracic organs | N25-N29 Other disorders of kidney & ureter |
| C40-C41 Malignant neoplasm of bone and articular cartilage | N30-N39 Other diseases of the urinary system |
| C43-C44 Malignant neoplasms of skin | N40-N51 Diseases of male genital organs |
| C45-C49 Malignant neoplasms of mesothelial and soft tissue | N60-N64 Disorders of breast |
| C50 Malignant neoplasm of breast | N70-N77 Inflammatory diseases of female pelvic organs |
| C51-C58 Malignant neoplasms of female genital organs | N80-N98 Noninflammatory disorders of female genital tract |
| C60-C63 Malignant neoplasms of male genital organs | N99 Other disorders of the genitourinary system |
| C64-C68 Malignant neoplasms of urinary tract | O00-O08 Pregnancy with abortive outcome |
| C69-C72 Malignant neoplasms of eye, brain & other parts of CNS | O10-O75, O85-O92, O94-O99 Complications of labour and delivery |
| C73-C80, C97 Malignant neoplasm. of thyroid and oth. endo. Glands etc. | O80-O84 Delivery |
| C81-C96 Malignant neoplasms of lymphoid, haematopoietic & rel. tiss. | P00-P04 Complications of foetus/neonate affected by maternal |
| D00-D48 In situ & benign neoplasms and others of uncertainty | P05-P96 Other conditions originating in the perinatal period |
| D50-D64 Anaemias | Q00-Q89 Congenital malformations |
| D65-D89 Diseases of the blood and blood-forming organs | Q90-Q99 Chromosomal abnormalities |
| E00-E07 Disorders of thyroid gland | R00-R09 Symptoms & signs inv. the circulatory/respiratory system |
| E10-E14 Diabetes Mellitus | R10-R19 Symptoms & signs inv. the digestive system & abdomen |
| E15-E90 Endocrine nutritional and metabolic diseases | R20-R23 Symptoms & signs inv. the skin & subcutaneous tissue |
| F00-F03 Dementia | R25-R29 Symptoms & signs inv. the nervous & musculoskeletal sys. |
| F04-F09 Other organic including symptomatic mental disorders | R30-R39 Symptoms & signs involving the urinary system |
| F10-F19 Mental and behavioural disorders due to psychoactive subst. | R40-R46 Symptoms & signs inv. Cognition, perception etc. |
| F20-F29 Schizophrenia, schizotypal and delusional disorders | R47-R49 Symptoms & signs inv. speech & voice |
| F30-F39 Mood [affective] disorders | R50-R68 General symptoms & signs |
| F40-F69 Neurotic, behavioural & personality disorders | R69 Unknown & unspecified causes of morbidity |
| F70-F79 Mental retardation | R70-R89 Abnormal findings of bodily fluids or samples without diag. |
| F80-F99 Other mental and behavioural disorders | R90-R94 Abnormal findings on diagnostic imaging/function studies |
| G00-G09 Inflammatory diseases of the central nervous system | R95-R99 Ill-defined & unknown causes of mortality |
| G10-G14, G30-G32 Other degenerative diseases (incl. Alzheimer). | S00-S09 Injuries to the head |
| G20-G26 Extrapyramidal & movement disorders (incl. Parkinsonism). | S10-S19 Injuries to the neck |
| G35-G37 Demyelinating diseases (incl Multiple Sclerosis) of the CNS. | S20-S29 Injuries to the thorax |
| G40-G47 Epilepsy, migraine & other episodic disorders | S30-S39 Injuries to abdomen, lower back, lumbar spine & pelvis |
| G50-G73 G90-G99 Other diseases & disorders of the nervous syst. | S40-S49 Injuries to the shoulder & upper arm |
| G80-G83 Cerebral palsy & other paralytic syndromes | S50-S59 Injuries to the elbow & forearm |
| H00-H06, H15-H22, H30-H36, H43-H59 Other disorders of the eye etc. | S60-S69 Injuries to the wrist & hand |
| H10-H13 Disorders of conjunctiva (including conjunctivitis) | S70-S79 Injuries to the hip & thigh |
| H25-H28 Disorders of lens (including cataracts) | S80-S89 Injuries to the knee & lower leg |
| H40-H42 Glaucoma | S90-S99 Injuries to the ankle & foot |
| H60-H95 Diseases of the ear and mastoid process | T00-T07 Injuries involving multiple body regions |
| I00-I09 Rheumatic heart disease | T08-T14 Injuries to unspecified part of trunk limb or body |
| I10-I15 Hypertensive diseases | T15-T19 Effects of foreign body entering through natural orifice |
| I20-I25 Ischaemic heart diseases | T20-T32 Burns and corrosions |
| I26-I28 Pulmonary heart disease & diseases of pulmonary circulation | T33-T35 Frostbite |
| I30-I52 Other forms of heart disease | T36-T50 Poisonings by drugs medicaments & biological substances |
| I60-I69 Cerebrovascular diseases | T51-T65 Tox. effcts. of substances. chiefly non-medicinal as to source |
| I70-I79 Diseases of arteries, arterioles & capillaries | T66-T78 Other and unspecified effects of external causes |
| I80-I89 Diseases of veins & lymphatic system nec. | T79 Certain early complications of trauma |
| I95-I99 Other & unspecified disorders of the circulatory system | T80-T88 Complications of surgical & medical care nec. |
| J00-J06 Acute upper respiratory infections | T90-T98 Sequelae of injuries of poisoning & other consequences |
| J09-J18 Influenza & pneumonia | VVV |
| J20-J22 Other acute lower respiratory infections | WWW |
| J30-J39 Other diseases of upper respiratory tract | XXX |
| J40-J47 Chronic lower respiratory diseases | YYY |
| J60-J70 Lung diseases due to external agents | Z00-Z13 Examination and investigation |
| J80-J99 Other diseases of the respiratory system | Z20-Z29 Potential health hazards related to communicable diseases |
| K00-K14 Diseases of oral cavity, salivary glands & jaws | Z30-Z39 Health services in circumstances related to reproduction |
| K20-K31 Diseases of oesophagusstomach & duodenum | Z40-Z54 Persons encountering health services for specific care |
| K35-K38 Diseases of appendix | Z55-Z65 Potential health hazards reltd. to socioeconomic & psychosoc.l |
| K40-K46 Hernia | Z70-Z76 Persons encountering health services in other circs. |
| K50-K52 Noninfective enteritis & colitis | Z80-Z99 Persons with potential health hazards related to family |
| K55-K64 Other diseases of intestines | U Unclassified |
Number of diagnoses
| 2 diagnoses | 7 diagnoses |
| 3 diagnoses | 8 diagnoses |
| 4 diagnoses | 9 diagnoses |
| 5 diagnoses | 10 diagnoses |
| 6 diagnoses |
Co-morbidities
| Neoplasms x Certain infectious and parasitic diseases | Certain conditions originating in the perinatal period x Certain infectious and parasitic diseases |
| Diseases of the blood and blood-forming organs and certain disorders involving the immune mechanism x Certain infectious and parasitic diseases | Certain conditions originating in the perinatal period x Neoplasms |
| Diseases of the blood and blood-forming organs and certain disorders involving the immune mechanism x Neoplasms | Certain conditions originating in the perinatal period x Diseases of the blood and blood-forming organs and certain disorders involving the immune mechanism |
| Endocrine, nutritional and metabolic diseases x Certain infectious and parasitic diseases | Certain conditions originating in the perinatal period x Endocrine, nutritional and metabolic diseases |
| Endocrine, nutritional and metabolic diseases x Neoplasms | Certain conditions originating in the perinatal period x Mental and behavioural disorders |
| Endocrine, nutritional and metabolic diseases x Diseases of the blood and blood-forming organs and certain disorders involving the immune mechanism | Certain conditions originating in the perinatal period x Diseases of the nervous system |
| Mental and behavioural disorders x Certain infectious and parasitic diseases | Certain conditions originating in the perinatal period x Diseases of the eye and adnexa |
| Mental and behavioural disorders x Neoplasms | Certain conditions originating in the perinatal period x Diseases of the ear and mastoid process |
| Mental and behavioural disorders x Diseases of the blood and blood-forming organs and certain disorders involving the immune mechanism | Certain conditions originating in the perinatal period x Diseases of the circulatory system |
| Mental and behavioural disorders x Endocrine, nutritional and metabolic diseases | Certain conditions originating in the perinatal period x Diseases of the respiratory system |
| Diseases of the nervous system x Certain infectious and parasitic diseases | Certain conditions originating in the perinatal period x Diseases of the digestive system |
| Diseases of the nervous system x Neoplasms | Certain conditions originating in the perinatal period x Diseases of the skin and subcutaneous tissue |
| Diseases of the nervous system x Diseases of the blood and blood-forming organs and certain disorders involving the immune mechanism | Certain conditions originating in the perinatal period x Diseases of the musculoskeletal system and connective tissue |
| Diseases of the nervous system x Endocrine, nutritional and metabolic diseases | Certain conditions originating in the perinatal period x Diseases of the genitourinary system |
| Diseases of the nervous system x Mental and behavioural disorders | Certain conditions originating in the perinatal period x Pregnancy, childbirth and the puerperium |
| Diseases of the eye and adnexa x Certain infectious and parasitic diseases | Congenital malformations, deformations and chromosomal abnormalities x Certain infectious and parasitic diseases |
| Diseases of the eye and adnexa x Neoplasms | Congenital malformations, deformations and chromosomal abnormalities x Neoplasms |
| Diseases of the eye and adnexa x Diseases of the blood and blood-forming organs and certain disorders involving the immune mechanism | Congenital malformations, deformations and chromosomal abnormalities x Diseases of the blood and blood-forming organs and certain disorders involving the immune mechanism |
| Diseases of the eye and adnexa x Endocrine, nutritional and metabolic diseases | Congenital malformations, deformations and chromosomal abnormalities x Endocrine, nutritional and metabolic diseases |
| Diseases of the eye and adnexa x Mental and behavioural disorders | Congenital malformations, deformations and chromosomal abnormalities x Mental and behavioural disorders |
| Diseases of the eye and adnexa x Diseases of the nervous system | Congenital malformations, deformations and chromosomal abnormalities x Diseases of the nervous system |
| Diseases of the ear and mastoid process x Certain infectious and parasitic diseases | Congenital malformations, deformations and chromosomal abnormalities x Diseases of the eye and adnexa |
| Diseases of the ear and mastoid process x Neoplasms | Congenital malformations, deformations and chromosomal abnormalities x Diseases of the ear and mastoid process |
| Diseases of the ear and mastoid process x Diseases of the blood and blood-forming organs and certain disorders involving the immune mechanism | Congenital malformations, deformations and chromosomal abnormalities x Diseases of the circulatory system |
| Diseases of the ear and mastoid process x Endocrine, nutritional and metabolic diseases | Congenital malformations, deformations and chromosomal abnormalities x Diseases of the respiratory system |
| Diseases of the ear and mastoid process x Mental and behavioural disorders | Congenital malformations, deformations and chromosomal abnormalities x Diseases of the digestive system |
| Diseases of the ear and mastoid process x Diseases of the nervous system | Congenital malformations, deformations and chromosomal abnormalities x Diseases of the skin and subcutaneous tissue |
| Diseases of the ear and mastoid process x Diseases of the eye and adnexa | Congenital malformations, deformations and chromosomal abnormalities x Diseases of the musculoskeletal system and connective tissue |
| Diseases of the circulatory system x Certain infectious and parasitic diseases | Congenital malformations, deformations and chromosomal abnormalities x Diseases of the genitourinary system |
| Diseases of the circulatory system x Neoplasms | Congenital malformations, deformations and chromosomal abnormalities x Pregnancy, childbirth and the puerperium |
| Diseases of the circulatory system x Diseases of the blood and blood-forming organs and certain disorders involving the immune mechanism | Congenital malformations, deformations and chromosomal abnormalities x Certain conditions originating in the perinatal period |
| Diseases of the circulatory system x Endocrine, nutritional and metabolic diseases | Symptoms, signs and abnormal clinical and laboratory findings, not elsewhere classified x Certain infectious and parasitic diseases |
| Diseases of the circulatory system x Mental and behavioural disorders | Symptoms, signs and abnormal clinical and laboratory findings, not elsewhere classified x Neoplasms |
| Diseases of the circulatory system x Diseases of the nervous system | Symptoms, signs and abnormal clinical and laboratory findings, not elsewhere classified x Diseases of the blood and blood-forming organs and certain disorders involving the immune mechanism |
| Diseases of the circulatory system x Diseases of the eye and adnexa | Symptoms, signs and abnormal clinical and laboratory findings, not elsewhere classified x Endocrine, nutritional and metabolic diseases |
| Diseases of the circulatory system x Diseases of the ear and mastoid process | Symptoms, signs and abnormal clinical and laboratory findings, not elsewhere classified x Mental and behavioural disorders |
| Diseases of the respiratory system x Certain infectious and parasitic diseases | Symptoms, signs and abnormal clinical and laboratory findings, not elsewhere classified x Diseases of the nervous system |
| Diseases of the respiratory system x Neoplasms | Symptoms, signs and abnormal clinical and laboratory findings, not elsewhere classified x Diseases of the eye and adnexa |
| Diseases of the respiratory system x Diseases of the blood and blood-forming organs and certain disorders involving the immune mechanism | Symptoms, signs and abnormal clinical and laboratory findings, not elsewhere classified x Diseases of the ear and mastoid process |
| Diseases of the respiratory system x Endocrine, nutritional and metabolic diseases | Symptoms, signs and abnormal clinical and laboratory findings, not elsewhere classified x Diseases of the circulatory system |
| Diseases of the respiratory system x Mental and behavioural disorders | Symptoms, signs and abnormal clinical and laboratory findings, not elsewhere classified x Diseases of the respiratory system |
| Diseases of the respiratory system x Diseases of the nervous system | Symptoms, signs and abnormal clinical and laboratory findings, not elsewhere classified x Diseases of the digestive system |
| Diseases of the respiratory system x Diseases of the eye and adnexa | Symptoms, signs and abnormal clinical and laboratory findings, not elsewhere classified x Diseases of the skin and subcutaneous tissue |
| Diseases of the respiratory system x Diseases of the ear and mastoid process | Symptoms, signs and abnormal clinical and laboratory findings, not elsewhere classified x Diseases of the musculoskeletal system and connective tissue |
| Diseases of the respiratory system x Diseases of the circulatory system | Symptoms, signs and abnormal clinical and laboratory findings, not elsewhere classified x Diseases of the genitourinary system |
| Diseases of the digestive system x Certain infectious and parasitic diseases | Symptoms, signs and abnormal clinical and laboratory findings, not elsewhere classified x Pregnancy, childbirth and the puerperium |
| Diseases of the digestive system x Neoplasms | Symptoms, signs and abnormal clinical and laboratory findings, not elsewhere classified x Certain conditions originating in the perinatal period |
| Diseases of the digestive system x Diseases of the blood and blood-forming organs and certain disorders involving the immune mechanism | Symptoms, signs and abnormal clinical and laboratory findings, not elsewhere classified x Congenital malformations, deformations and chromosomal abnormalities |
| Diseases of the digestive system x Endocrine, nutritional and metabolic diseases | Injury, poisoning and certain other consequences of external causes x Certain infectious and parasitic diseases |
| Diseases of the digestive system x Mental and behavioural disorders | Injury, poisoning and certain other consequences of external causes x Neoplasms |
| Diseases of the digestive system x Diseases of the nervous system | Injury, poisoning and certain other consequences of external causes x Diseases of the blood and blood-forming organs and certain disorders involving the immune mechanism |
| Diseases of the digestive system x Diseases of the eye and adnexa | Injury, poisoning and certain other consequences of external causes x Endocrine, nutritional and metabolic diseases |
| Diseases of the digestive system x Diseases of the ear and mastoid process | Injury, poisoning and certain other consequences of external causes x Mental and behavioural disorders |
| Diseases of the digestive system x Diseases of the circulatory system | Injury, poisoning and certain other consequences of external causes x Diseases of the nervous system |
| Diseases of the digestive system x Diseases of the respiratory system | Injury, poisoning and certain other consequences of external causes x Diseases of the eye and adnexa |
| Diseases of the skin and subcutaneous tissue x Certain infectious and parasitic diseases | Injury, poisoning and certain other consequences of external causes x Diseases of the ear and mastoid process |
| Diseases of the skin and subcutaneous tissue x Neoplasms | Injury, poisoning and certain other consequences of external causes x Diseases of the circulatory system |
| Diseases of the skin and subcutaneous tissue x Diseases of the blood and blood-forming organs and certain disorders involving the immune mechanism | Injury, poisoning and certain other consequences of external causes x Diseases of the respiratory system |
| Diseases of the skin and subcutaneous tissue x Endocrine, nutritional and metabolic diseases | Injury, poisoning and certain other consequences of external causes x Diseases of the digestive system |
| Diseases of the skin and subcutaneous tissue x Mental and behavioural disorders | Injury, poisoning and certain other consequences of external causes x Diseases of the skin and subcutaneous tissue |
| Diseases of the skin and subcutaneous tissue x Diseases of the nervous system | Injury, poisoning and certain other consequences of external causes x Diseases of the musculoskeletal system and connective tissue |
| Diseases of the skin and subcutaneous tissue x Diseases of the eye and adnexa | Injury, poisoning and certain other consequences of external causes x Diseases of the genitourinary system |
| Diseases of the skin and subcutaneous tissue x Diseases of the ear and mastoid process | Injury, poisoning and certain other consequences of external causes x Pregnancy, childbirth and the puerperium |
| Diseases of the skin and subcutaneous tissue x Diseases of the circulatory system | Injury, poisoning and certain other consequences of external causes x Certain conditions originating in the perinatal period |
| Diseases of the skin and subcutaneous tissue x Diseases of the respiratory system | Injury, poisoning and certain other consequences of external causes x Congenital malformations, deformations and chromosomal abnormalities |
| Diseases of the skin and subcutaneous tissue x Diseases of the digestive system | Injury, poisoning and certain other consequences of external causes x Symptoms, signs and abnormal clinical and laboratory findings, not elsewhere classified |
| Diseases of the musculoskeletal system and connective tissue x Certain infectious and parasitic diseases | External causes of morbidity and mortality x Certain infectious and parasitic diseases |
| Diseases of the musculoskeletal system and connective tissue x Neoplasms | External causes of morbidity and mortality x Neoplasms |
| Diseases of the musculoskeletal system and connective tissue x Diseases of the blood and blood-forming organs and certain disorders involving the immune mechanism | External causes of morbidity and mortality x Diseases of the blood and blood-forming organs and certain disorders involving the immune mechanism |
| Diseases of the musculoskeletal system and connective tissue x Endocrine, nutritional and metabolic diseases | External causes of morbidity and mortality x Endocrine, nutritional and metabolic diseases |
| Diseases of the musculoskeletal system and connective tissue x Mental and behavioural disorders | External causes of morbidity and mortality x Mental and behavioural disorders |
| Diseases of the musculoskeletal system and connective tissue x Diseases of the nervous system | External causes of morbidity and mortality x Diseases of the nervous system |
| Diseases of the musculoskeletal system and connective tissue x Diseases of the eye and adnexa | External causes of morbidity and mortality x Diseases of the eye and adnexa |
| Diseases of the musculoskeletal system and connective tissue x Diseases of the ear and mastoid process | External causes of morbidity and mortality x Diseases of the ear and mastoid process |
| Diseases of the musculoskeletal system and connective tissue x Diseases of the circulatory system | External causes of morbidity and mortality x Diseases of the circulatory system |
| Diseases of the musculoskeletal system and connective tissue x Diseases of the respiratory system | External causes of morbidity and mortality x Diseases of the respiratory system |
| Diseases of the musculoskeletal system and connective tissue x Diseases of the digestive system | External causes of morbidity and mortality x Diseases of the digestive system |
| Diseases of the musculoskeletal system and connective tissue x Diseases of the skin and subcutaneous tissue | External causes of morbidity and mortality x Diseases of the skin and subcutaneous tissue |
| Diseases of the genitourinary system x Certain infectious and parasitic diseases | External causes of morbidity and mortality x Diseases of the musculoskeletal system and connective tissue |
| Diseases of the genitourinary system x Neoplasms | External causes of morbidity and mortality x Diseases of the genitourinary system |
| Diseases of the genitourinary system x Diseases of the blood and blood-forming organs and certain disorders involving the immune mechanism | External causes of morbidity and mortality x Pregnancy, childbirth and the puerperium |
| Diseases of the genitourinary system x Endocrine, nutritional and metabolic diseases | External causes of morbidity and mortality x Certain conditions originating in the perinatal period |
| Diseases of the genitourinary system x Mental and behavioural disorders | External causes of morbidity and mortality x Congenital malformations, deformations and chromosomal abnormalities |
| Diseases of the genitourinary system x Diseases of the nervous system | External causes of morbidity and mortality x Symptoms, signs and abnormal clinical and laboratory findings, not elsewhere classified |
| Diseases of the genitourinary system x Diseases of the eye and adnexa | External causes of morbidity and mortality x Injury, poisoning and certain other consequences of external causes |
| Diseases of the genitourinary system x Diseases of the ear and mastoid process | Factors influencing health status and contact with health services x Certain infectious and parasitic diseases |
| Diseases of the genitourinary system x Diseases of the circulatory system | Factors influencing health status and contact with health services x Neoplasms |
| Diseases of the genitourinary system x Diseases of the respiratory system | Factors influencing health status and contact with health services x Diseases of the blood and blood-forming organs and certain disorders involving the immune mechanism |
| Diseases of the genitourinary system x Diseases of the digestive system | Factors influencing health status and contact with health services x Endocrine, nutritional and metabolic diseases |
| Diseases of the genitourinary system x Diseases of the skin and subcutaneous tissue | Factors influencing health status and contact with health services x Mental and behavioural disorders |
| Diseases of the genitourinary system x Diseases of the musculoskeletal system and connective tissue | Factors influencing health status and contact with health services x Diseases of the nervous system |
| Pregnancy, childbirth and the puerperium x Certain infectious and parasitic diseases | Factors influencing health status and contact with health services x Diseases of the eye and adnexa |
| Pregnancy, childbirth and the puerperium x Neoplasms | Factors influencing health status and contact with health services x Diseases of the ear and mastoid process |
| Pregnancy, childbirth and the puerperium x Diseases of the blood and blood-forming organs and certain disorders involving the immune mechanism | Factors influencing health status and contact with health services x Diseases of the circulatory system |
| Pregnancy, childbirth and the puerperium x Endocrine, nutritional and metabolic diseases | Factors influencing health status and contact with health services x Diseases of the respiratory system |
| Pregnancy, childbirth and the puerperium x Mental and behavioural disorders | Factors influencing health status and contact with health services x Diseases of the digestive system |
| Pregnancy, childbirth and the puerperium x Diseases of the nervous system | Factors influencing health status and contact with health services x Diseases of the skin and subcutaneous tissue |
| Pregnancy, childbirth and the puerperium x Diseases of the eye and adnexa | Factors influencing health status and contact with health services x Diseases of the musculoskeletal system and connective tissue |
| Pregnancy, childbirth and the puerperium x Diseases of the ear and mastoid process | Factors influencing health status and contact with health services x Diseases of the genitourinary system |
| Pregnancy, childbirth and the puerperium x Diseases of the circulatory system | Factors influencing health status and contact with health services x Pregnancy, childbirth and the puerperium |
| Pregnancy, childbirth and the puerperium x Diseases of the respiratory system | Factors influencing health status and contact with health services x Certain conditions originating in the perinatal period |
| Pregnancy, childbirth and the puerperium x Diseases of the digestive system | Factors influencing health status and contact with health services x Congenital malformations, deformations and chromosomal abnormalities |
| Pregnancy, childbirth and the puerperium x Diseases of the skin and subcutaneous tissue | Factors influencing health status and contact with health services x Symptoms, signs and abnormal clinical and laboratory findings, not elsewhere classified |
| Pregnancy, childbirth and the puerperium x Diseases of the musculoskeletal system and connective tissue | Factors influencing health status and contact with health services x Injury, poisoning and certain other consequences of external causes |
| Pregnancy, childbirth and the puerperium x Diseases of the genitourinary system | Factors influencing health status and contact with health services x External causes of morbidity and mortality |
Attributed need variables
| Variables not included in PCA | |
| Log population variance | %Disability Live Allowance/Personal Independence Payment |
| % carer (GP survey) | |
| % permanently sick or disabled (GP survey) | Proportion Single (never married) (Census) |
| % Full-time education (GP survey) | Proportion Separated (but still legally married) (Census) |
| % fully retired from work (GP survey) | Proportion Divorced (Census) |
| % Long-term health condition (GP survey) | Proportion Widowed (Census) |
| Average number of conditions for those with at least one long term medical condition (GP survey) | Proportion of students in population (aged 16-74) (Census) |
| % Long-term physical or mental health conditions, disabilities or illnesses – (GP survey) | Crime Score (IMD) |
| When last general practice appointment was – % In the past 3 months (GP survey) | |
| Variables included and surviving PCA | |
| Quality outcomes framework prevalence measures | |
| QOF Hypertension Prevalence | QOF Osteoperosis Prevalence |
| QOF Coronary Heart Disease Prevalence | QOF Learning Disabilities Prevalence |
| QOF Stroke Prevalence | QOF Mental Health Prevalence |
| Barriers (IMD) | |
| Homelessness indicator (rate per 1000 households) | Road distance to a GP surgery (km) |
| Road distance to a post office indicator (km) | Road distance to a general store (km) |
| Road distance to a primary school (km) | Housing affordability indicator |
| Education | |
| Adult skills and English language proficiency indicators – combined (IMD) | Entry to higher education indicator (IMD) |
| Staying on in education post 16 indicator (IMD) | Proportion with no qualifications (Census) |
| Health | |
| Comparative illness and disability ratio indicator (IMD) | Proportion (un standardised) with LLTI (Census) |
| Potential years of life lost indicator (IMD) | Mood and anxiety disorders indicator (Census) |
| Income | |
| Income Score (IMD) | Proportion aged 16-74 in semi-routine occupation (Census) |
| Proportion aged 16+ in low grade work, long term unemployed or never worked (Census) | Proportion aged 16-74 in routine occupation (Census) |
| Living environment (IMD) | |
| Housing in poor condition indicator | Air quality indicator |
| Houses without central heating indicator | Road traffic accidents indicator |
| Immunisation | |
| % immunised DTaP/IPV/Hib by 12 months | % immunised for Pneumococcal disease by 12 months |
| % immunised DTaP/IPV/Hib by 24 months | % receiving MMR 2nd dose by fifth birthday |
| % immunised for Meningitis B by 12 months | |
Attributed supply variables
| Variables not included in PCA | |
| Gravity weighted travel duration to hospital | Proportion headcount GPs female (including retainers and registrars) |
| No FTE GPs per practice (excluding retainers and registrars) | Proportion of GPs aged 50 and over in practice (headcount, including retainers a |
| registrations per FTE (excluding retainers and registrars) | Proportion (headcount) GPs qualified in UK |
| Variables included and surviving PCA | |
| Quality outcomes framework scores | |
| QOF Atrial Fibrillation Weighted Achievement Score | QOF Chronic kidney disease Weighted Achievement Score |
| QOF Coronary Heart Disease Weighted Achievement Score | QOF Obesity Weighted Achievement Score |
| QOF Stroke Weighted Achievement Score | QOF Osteoporosis Weighted Achievement Score |
| Quality outcomes framework exception rates | |
| QOF Atrial Fibrillation Exception Rate | QOF Dementia Exception Rate |
| QOF Hypertension Exception Rate | QOF Rheumatoid arthritis Exception Rate |
| QOF Coronary Heart Disease Exception Rate | QOF Asthma Exception Rate |
| QOF Contraception Exception Rate | QOF Cancer Exception Rate |
| Hospital supply (gravity weighted) | |
| Plain Radiography | critical care beds (occupied) |
| General and Acute day beds | Median waiting times (weeks) for non-admitted patients |
| Total Operating theatres | |
CCG-specific variables
| NHS Airedale, Wharfedale and Craven CCG | NHS Merton CCG |
| NHS Ashford CCG | NHS Mid Essex CCG |
| NHS Barking and Dagenham CCG | NHS Milton Keynes CCG |
| NHS Barnet CCG | NHS Morecambe Bay CCG |
| NHS Barnsley CCG | NHS Nene CCG |
| NHS Basildon and Brentwood CCG | NHS Newark and Sherwood CCG |
| NHS Bassetlaw CCG | NHS Newcastle Gateshead CCG |
| NHS Bath and North East Somerset CCG | NHS Newham CCG |
| NHS Bedfordshire CCG | NHS North Cumbria CCG |
| NHS Berkshire West CCG | NHS North Durham CCG |
| NHS Bexley CCG | NHS North East Essex CCG |
| NHS Birmingham and Solihull CCG | NHS North East Hampshire and Farnham CCG |
| NHS Blackburn with Darwen CCG | NHS North East Lincolnshire CCG |
| NHS Blackpool CCG | NHS North Hampshire CCG |
| NHS Bolton CCG | NHS North Kirklees CCG |
| NHS Bradford City CCG | NHS North Lincolnshire CCG |
| NHS Bradford Districts CCG | NHS North Norfolk CCG |
| NHS Brent CCG | NHS North Staffordshire CCG |
| NHS Brighton and Hove CCG | NHS North Tyneside CCG |
| NHS Bristol, North Somerset and South Gloucestershire CCG | NHS North West Surrey CCG |
| NHS Bromley CCG | NHS Northern, Eastern and Western Devon CCG |
| NHS Buckinghamshire CCG | NHS Northumberland CCG |
| NHS Bury CCG | NHS Norwich CCG |
| NHS Calderdale CCG | NHS Nottingham City CCG |
| NHS Cambridgeshire and Peterborough CCG | NHS Nottingham North and East CCG |
| NHS Camden CCG | NHS Nottingham West CCG |
| NHS Cannock Chase CCG | NHS Oldham CCG |
| NHS Canterbury and Coastal CCG | NHS Oxfordshire CCG |
| NHS Castle Point and Rochford CCG | NHS Portsmouth CCG |
| NHS Central London (Westminster) CCG | NHS Redbridge CCG |
| NHS Chorley and South Ribble CCG | NHS Redditch and Bromsgrove CCG |
| NHS City and Hackney CCG | NHS Richmond CCG |
| NHS Coastal West Sussex CCG | NHS Rotherham CCG |
| NHS Corby CCG | NHS Rushcliffe CCG |
| NHS Coventry and Rugby CCG | NHS Salford CCG |
| NHS Crawley CCG | NHS Sandwell and West Birmingham CCG |
| NHS Croydon CCG | NHS Scarborough and Ryedale CCG |
| NHS Darlington CCG | NHS Sheffield CCG |
| NHS Dartford, Gravesham and Swanley CCG | NHS Shropshire CCG |
| NHS Doncaster CCG | NHS Somerset CCG |
| NHS Dorset CCG | NHS South Cheshire CCG |
| NHS Dudley CCG | NHS South Devon and Torbay CCG |
| NHS Durham Dales, Easington and Sedgefield CCG | NHS South East Staffordshire and Seisdon Peninsula CCG |
| NHS Ealing CCG | NHS South Eastern Hampshire CCG |
| NHS East and North Hertfordshire CCG | NHS South Kent Coast CCG |
| NHS East Berkshire CCG | NHS South Lincolnshire CCG |
| NHS East Lancashire CCG | NHS South Norfolk CCG |
| NHS East Leicestershire and Rutland CCG | NHS South Sefton CCG |
| NHS East Riding of Yorkshire CCG | NHS South Tees CCG |
| NHS East Staffordshire CCG | NHS South Tyneside CCG |
| NHS East Surrey CCG | NHS South Warwickshire CCG |
| NHS Eastbourne, Hailsham and Seaford CCG | NHS South West Lincolnshire CCG |
| NHS Eastern Cheshire CCG | NHS South Worcestershire CCG |
| NHS Enfield CCG | NHS Southampton CCG |
| NHS Fareham and Gosport CCG | NHS Southend CCG |
| NHS Fylde and Wyre CCG | NHS Southport and Formby CCG |
| NHS Gloucestershire CCG | NHS Southwark CCG |
| NHS Great Yarmouth and Waveney CCG | NHS St Helens CCG |
| NHS Greater Huddersfield CCG | NHS Stafford and Surrounds CCG |
| NHS Greater Preston CCG | NHS Stockport CCG |
| NHS Greenwich CCG | NHS Stoke on Trent CCG |
| NHS Guildford and Waverley CCG | NHS Sunderland CCG |
| NHS Halton CCG | NHS Surrey Downs CCG |
| NHS Hambleton, Richmondshire and Whitby CCG | NHS Surrey Heath CCG |
| NHS Hammersmith and Fulham CCG | NHS Sutton CCG |
| NHS Haringey CCG | NHS Swale CCG |
| NHS Harrogate and Rural District CCG | NHS Swindon CCG |
| NHS Harrow CCG | NHS Tameside and Glossop CCG |
| NHS Hartlepool and Stockton-on-Tees CCG | NHS Telford and Wrekin CCG |
| NHS Hastings and Rother CCG | NHS Thanet CCG |
| NHS Havering CCG | NHS Thurrock CCG |
| NHS Herefordshire CCG | NHS Tower Hamlets CCG |
| NHS Herts Valleys CCG | NHS Trafford CCG |
| NHS Heywood, Middleton and Rochdale CCG | NHS Vale of York CCG |
| NHS High Weald Lewes Havens CCG | NHS Vale Royal CCG |
| NHS Hillingdon CCG | NHS Wakefield CCG |
| NHS Horsham and Mid Sussex CCG | NHS Walsall CCG |
| NHS Hounslow CCG | NHS Waltham Forest CCG |
| NHS Hull CCG | NHS Wandsworth CCG |
| NHS Ipswich and East Suffolk CCG | NHS Warrington CCG |
| NHS Isle of Wight CCG | NHS Warwickshire North CCG |
| NHS Islington CCG | NHS West Cheshire CCG |
| NHS Kernow CCG | NHS West Essex CCG |
| NHS Kingston CCG | NHS West Hampshire CCG |
| NHS Knowsley CCG | NHS West Kent CCG |
| NHS Lambeth CCG | NHS West Lancashire CCG |
| NHS Leeds CCG | NHS West Leicestershire CCG |
| NHS Leicester City CCG | NHS West London CCG |
| NHS Lewisham CCG | NHS West Norfolk CCG |
| NHS Lincolnshire East CCG | NHS West Suffolk CCG |
| NHS Lincolnshire West CCG | NHS Wigan Borough CCG |
| NHS Liverpool CCG | NHS Wiltshire CCG |
| NHS Luton CCG | NHS Wirral CCG |
| NHS Manchester CCG | NHS Wolverhampton CCG |
| NHS Mansfield and Ashfield CCG | NHS Wyre Forest CCG |
| NHS Medway CCG |
The above can also be downloaded as an Excel spreadsheet.
Annex C: Coefficients for the specialised services model
Download a Word version or Excel version of this table.
Publication reference: PRN01046ii