
Purpose of this document
In November 2024 the Secretary of State announced that NHS England would assess NHS trusts against a range of performance criteria and publish the results. This assessment allows NHS England to determine the support individual NHS trusts need to improve: those in the middle of the pack will be supported by us to improve and those demonstrating persistently low performance will receive prompt intervention, while those performing at the top may be rewarded with additional freedoms.
We published the new NHS Oversight Framework 2025/26 in June 2025 and have assessed NHS trust performance against this framework across a range of areas. Segmentation provides a high-level view of organisational performance but not the range of performance levels within each segment.
To provide detail on performance at both a metric and overall level and flowing directly from our segmentation process, we have developed NHS trust performance league tables for NHS acute, non-acute hospital and ambulance trusts. These tables rank each organisation relative to its peers and show how much it will need to improve by to move into a higher segment.
As well as publishing the NHS trust league tables, below we provide detail on how we calculated them and how they should be interpreted.
Types of ranking
League tables have two distinct ranking types: aggregated metric rankings (AMR) and individual metric rankings (IMR). IMR league tables focus on single specific metrics and can be used to compare performance of organisations across the country – for example, to understand how each trust performs against the 18-week elective care standard. IMR league tables are primarily designed to give patients understanding of how performance varies across the country, to empower them to make more informed decisions about their care.
AMR league tables provide an overall view of each organisation compared to other trusts of the same type. The AMR league table uses the average of all NHS Oversight Framework metric scores to provide a ranked order of trusts. The AMR is designed to support people to understand the overall position of the organisation in relation to its peers and to understand actions needed to progress towards improved segmentation. It is also used as part of local NHS accountability: for example, supporting health and wellbeing boards and local authorities to understand the relative overall performance of trusts in their locality.
Calculating rankings
Individual metric rankings
IMR league tables are provided within the dedicated oversight framework dashboard only for those metrics where ranking is an appropriate approach. It is not appropriate to rank some metrics: for example, those with banded outcomes such as Care Quality Commission (CQC) ratings.
Where ranking is appropriate, the league table is generated by applying linear ranking of performance, with each organisation positioned in a sequential list according to its level of performance. All organisations that submit data for the specific metric are ranked against one another.
Aggregated metric rankings
There are 3 AMR league tables, one for each of 3 trust types. While many organisations submit a range of data covering both acute and non-acute services, each organisation can only feature in a single AMR league table and it is its trust type as recorded in the NHS Estates Returns Information Collection (ERIC) that defines which one that is:
| AMR league table | ERIC trust types |
|---|---|
| Acute trust league table | Small acute, medium acute, large acute, teaching acute, specialist acute, multi-service acute |
| Non-acute trust league table | Community, care, mental health and learning disability |
| Ambulance trust league table | Ambulance |
Trusts are ranked within their league table using two things:
- NHS oversight framework segment
- average metric score
Step 1: Segment Ranking
- trusts are grouped by their segment number (1 to 4)
- segment 1 trusts are ranked highest, followed by segment 2, then 3, and finally 4
- so, all segment 1 trusts will always be above segment 2 trusts in the table
Step 2: Metric score ranking (within each segment)
- inside each segment group, trusts are then ranked by their average metric score
- a lower score means a better ranking
- the top ranked trusts will be the segment one trust with the lowest average metric score, the lowest ranked trust will be the segment four trust with the highest average metric score
Comparability
Ranking organisations against one another can be a helpful indicator of potential areas of disparity for further investigation and to understand variation in performance, but drawing conclusions from this data should always be done cautiously. The sections below detail some factors that users must have in mind when using the league tables to compare one organisation against another.
Types of trust
NHS trusts do many different things and serve very different communities. So, just because one trust ranks higher than another doesn’t mean it’s “better.” For example, comparing a small rural trust with a large city teaching hospital or a specialist centre isn’t always fair as they treat different kinds of patients and do different types of work.
To help you make most sense of the rankings:
- We show each trust’s organisation type along with its segment, score, and rank to help you compare organisations of similar size, function or complexity
- Our dashboard also has a map feature so you can directly compare similar types of trusts – like looking only at teaching hospitals in Greater Manchester.
Lag times
Each performance metric looks at a different time period, so you should be careful when comparing multiple metrics or overall rankings as they might not all cover the same dates. For example, performance in some areas deteriorate during the winter due to increased demand and more unwell patients.
Because data is collected and published at different times (monthly, quarterly, or yearly), there can be delays depending on how complex the data is. This means that when metrics are combined into one ranking, they are based on different timeframes, which makes direct comparisons between them less reliable.
Mergers and acquisitions
Sometimes NHS trusts join together or one trust takes over another. This can affect performance data, for example, a well-performing trust might take on a struggling one and see its results drop because it inherits issues like long waiting lists.
So, when looking at trust data, it’s important to check if there’s been a recent merger or takeover. You can find details about all mergers and acquisitions on our website. (Mergers and acquisitions).
Understanding confidence intervals and performance volatility
League tables use average scores to make performance easier to compare. But averages can be misleading. For example, a trust with a mix of very high and very low scores might have the same average as one that performs steadily across all areas.
To give a fuller picture, the dashboard also shows:
- individual metric scores
- RAG ratings (Red, Amber, Green) This helps users see both the overall average and how performance varies across different measures.
What confidence intervals mean
Our dashboard includes a statistics tab with details on confidence intervals. These show how certain we are about a trust’s rank and average score. They give a range where the score or rank is likely to fall, with 95% certainty, based on the mixture of metrics included within the framework for each organisation.
- trusts that perform consistently across different areas are likely to have narrower intervals (more certainty)
- trusts with more varied performance, very high in some areas and very low in others, have wider intervals (less certainty)
A practical example
Figure 1 shows how this works. Trust 17 ranks first place with an average metric score of 1.3. It has a very narrow confidence interval – its average score could be as low as 1.1 or as high as 1.5. We can say with 95% confidence that Trust 17 performs as well or better than Trust 57 because the lowest possible score for Trust 17 (1.7) is lower than the highest possible score for Trust 18’s confidence interval (1.5).
By contrast, Trust 25 has a very wide confidence interval – its average score could be as low as 1.4 or as a high as 2.6. This means its ranking could be as high as 3rd place or as low as 90th place. This wide range suggests that Trust 25 has an inconsistent performance, strong in some areas but facing challenges in others.
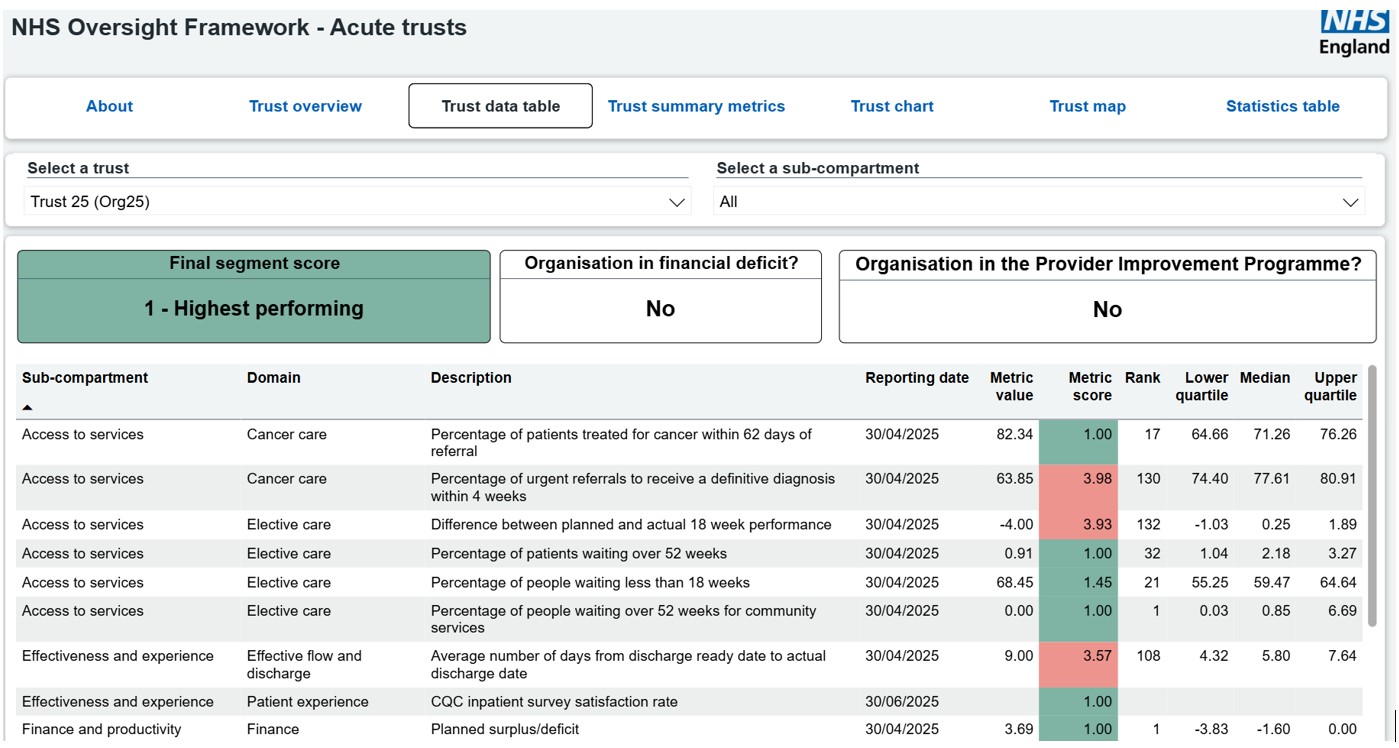
You can verify this by looking at the trust’s detailed performance figures (Figure 2). They show exactly this pattern: many areas of high performance but also pockets of substantial challenge that may require focused support or intervention to resolve.
Figure 1: Section of the statistics table showing the average metric score confidence intervals for trusts at the top of the league table
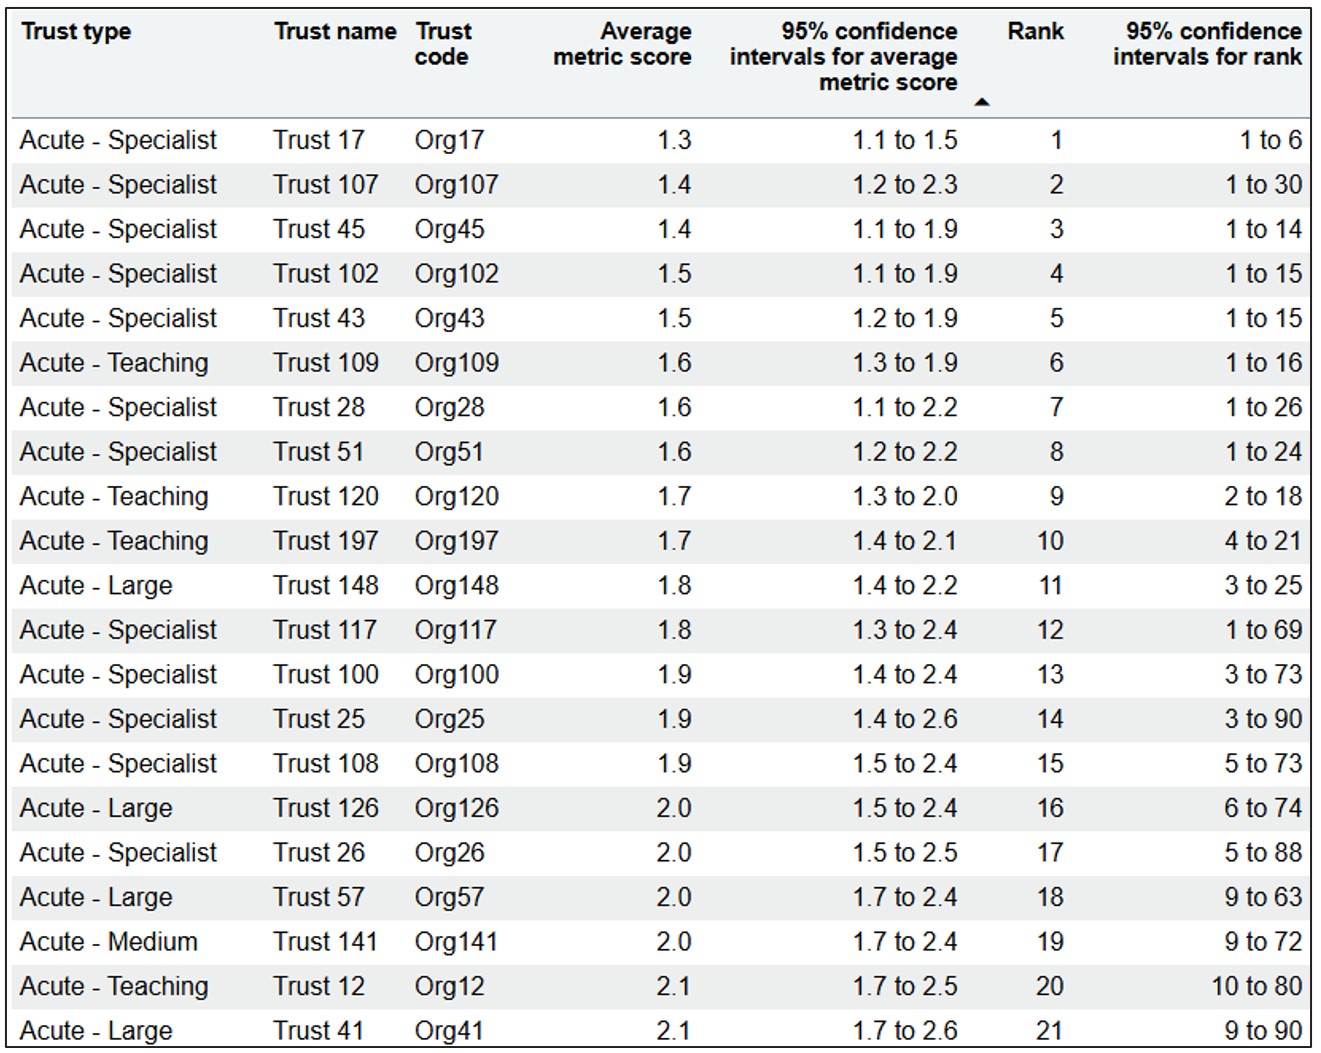
Figure 2: Details of individual metric scores for Trust 25 to show the potential for high variation at metric level even among organisations at the top of the league table and in the top segment
Using the data
When looking at league table data—especially overall rankings—it’s important to check the confidence intervals. These show how certain we are about a trust’s score or rank.
What segmentation can show
Segmentation highlights the range of different challenges a trust faces. Trusts with lots of issues may need more complex solutions for which NHS England may need to offer additional support
What segmentation does not show
Segmentation doesn’t show how serious a problem is, particularly if it only affects one or two areas. That’s where confidence intervals help. They show if a trust that looks strong overall might still need help in a specific area. For example, a trust might rank well overall but struggle with long waiting times for surgery. The confidence intervals can reveal this hidden issue, even if the trust’s average score looks good.
View the aggregated metric rankings (AMR) for:
Publication reference: PRN01916