
Introduction
This guidance contains the information requirements, costing processes and costing methods for the ambulance sector. Guidance for the integrated sector can be found separately here.
The technical document provides detailed information on the data items, terminology and the calculations of the prescribed Approved Costing Guidance. It is important to work through it with the relevant costing standard for full understanding. You will find the Costing glossary invaluable for understanding the concepts and terminology underpinning the standards.
The guidance also refers to supporting information in learning extensions which can be found on our FutureNHS workspace. You can access FutureNHS if you have an NHS email address or email costing@england.nhs.uk to request access if you do not.
Information requirements
Before you implement the information requirements in this document, you should review:
‒ You should ensure you bring in the feeds that cover the largest service areas first.
‒ spreadsheet IR1.1: Information feeds required for costing
‒ spreadsheet IR1.2: Field requirements for the information feeds
‒ spreadsheet IR1.3: Examples of feed data for different scenarios
‒ spreadsheet IR1.4: Diagram: different levels of information recorded for ambulance responses and their relationships.
IR1: Collecting information for costing
Scope
This standard specifies the requirements for the information feeds for the costing processes prescribed in Section 3.
The information requirements apply to all activity going through 999 control centres.
Where the identity of the patient is not known, incident information is required to cost ‘a’ patient, not ‘the’ patient.
Data on clinical interventions falls outside the scope of this standard because there are more appropriate cost drivers for ambulance service costs, such as journey time.
Overview
The information feeds are the input information you need for costing. Note they are not the output you need to produce from your costing system (see the Ambulance National Cost Collection (NCC) guidance) nor the software system specifications (see the Minimum software requirements on FutureNHS).
The standards describe four main information sources for costing:
- master ambulance event information feeds: core information about the ambulance events the auxiliary feeds are matched to, for example the incident information feed
- auxiliary ambulance event information feeds: information that is matched to the master feeds, for example the response feeds
- supplementary information feeds: information to calculate costs for resources more accurately, for example fleet information feed
- relative weight values (RWVs).
Spreadsheet IR1.1 lists the master, auxiliary and supplementary information feeds required for costing. You will need information to support RWVs for all other cost allocations.
The information feeds provide the following information:
- events that have occurred, for example the incident feed contains information on providing telephone clinical advice, which tells the costing system whether to include this activity in the costing process (telephone clinical advice does not happen in all incidents)
- the cost driver to use to allocate costs, for example duration of time on scene
- information for more accurate identification of resources, for example the fleet information feed contains information on the cost of repair and maintenance for an individual vehicle.
Any costs that cannot be allocated using the information in the prescribed information feeds need a supplementary information feed or RWVs to enable allocation. You can choose which method to use.
Where you are using local sources of information for costing that are not prescribed feeds, document them in your integrated costing assurance log (ICAL) worksheet 2: Additional information sources.
You are not required to collect an information feed if your organisation does not provide that activity.
You are not required to collect duplicate information across information feeds unless this is needed for matching. The reasons for including each field in the information feeds are given in spreadsheet IR1.2.
Your informatics department is best placed to get the data. To help you identify the information already being collected by your organisation, use spreadsheet IR1.2.
This standard prescribes the information to be collected but not how it is collected. If you collect several of the specified feeds from one dataset, you should continue to do so, provided the required information is captured.
If you have activity in your information feeds where the costs are reported in another provider’s accounts, you need to report this activity under ‘cost and activity reconciliation items’ as described under Reconciliation of incident- and patient-level activity in Standard CP5: Reconciliation. This is so your own patient costs are not allocated to this activity, deflating the cost of your own patients.
Approach
Table IR1.1 lists the five information feeds we prescribe for ambulance costing. Note: the feed numbers are set across all sectors, which is why the ambulance feeds do not start at 1.
Table IR1.1: Information feeds
|
Feed number |
Feed name |
Feed scope |
Type of feed |
|
20 |
Incident information |
All incidents your organisation responded to within the costing period. Call stage activity information is included in this feed. |
Master |
|
21 |
Response information |
All physical responses, ie staffed vehicles or on-foot responders, that your organisation dispatched to respond to an incident within the costing period. |
Auxiliary |
|
22 |
Patient information |
All patients who were involved in the incidents within the costing period. It is used to take incident-level costs to the patient level. |
Auxiliary |
|
23 |
Staff information |
All staff shifts and working hours within the costing period. |
Supplementary |
|
24 |
Fleet information |
All episodes of vehicle maintenance and repair for all vehicles involved in responding to incidents within the costing period. |
Supplementary |
Each incident may relate to more than one patient. The diagram in spreadsheet IR1.4 explains the different levels of information, particularly call level, response level, incident level and patient level, in relation to the information feeds.
Spreadsheet IR1.2 lists the data fields required for each feed. The following sections describe the feeds in more detail and you should refer to this spreadsheet as you read it.
Spreadsheet IR1.3 has examples of feed data for different scenarios, including Feed 20: Incident information, Feed 21: Response information and Feed 22: Patient information link. Also included are the specific data fields that need to be populated for costing in each scenario.
Feed 20: Incident information
Data source
Activity data is collected from the call or another trigger (for example an ambulance passing a roadside incident or a transfer from NHS 111 service) and any subsequent responses, as recorded in your organisation’s computer-aided dispatch (CAD) system.
Feed detail
Scope: All the incidents your organisation responded to within the costing period, covering every stage of an emergency response (ie job cycle) – from receiving a call to treating and conveying the patient(s) to a treatment location, handing over care and preparing to respond again. See Standard CM31: Allocating costs across job cycle elements for details of job cycle stages.
Feed 20: Incident information is a master feed to which auxiliary feeds such as response information and patient information can be matched.
This feed includes information on:
- call stage activities, for example source of call, start and end time of the call
- incident-level physical response stage activities, for example number of responses dispatched for the incident, number of responses arriving on scene, number of responses arriving at treatment locations
- general information about the incident, for example provider trust, commissioning organisation, incident location and whether the location is cross-border.
Data on call handling activities is usually collected at the call level, which is a lower level of detail than incident level – that is, one incident may be associated with more than one call.
The main call is used for costing because secondary and subsequent calls associated with the same incident cannot be linked to the main call or the incident. The costing standards only require information on the main call associated with the incident – which is the call linked to the incident in your CAD system.
Data on telephone clinical advice activities is usually collected at the incident level.
Data on giving telephone clinical advice to the crew at the scene is not required for costing at patient level and should be treated as an overhead.
One incident may have multiple responses.
Feed 21: Response information
Data source
This data should come from your CAD system.
Feed detail
Scope: All responses – that is, staffed vehicles or on-foot responders – your organisation dispatches to an incident within the costing period, covering all stages of a physical response from the time a response is dispatched, including:
- travelling to the scene
- treating patients at the scene
- conveying the patient(s) to a treatment location
- handing over care, and
- preparing to respond again.
Feed 21: Response information is an auxiliary feed, which is matched to Feed 20: Incident information, using the activity ID (incident ID). See Standard CP4: Matching costed activities to incidents and patients.
This feed includes information on:
- time stamps and duration of the job cycles, for example at scene date and time; left scene date and time
- the response unit, for example vehicle ID, vehicle type, staff ID
- patient handover, for example handover organisation and department.
The number of responses allocated for the incident is used to allocate the cost of dispatchers, and this is matched to the incident level.
Feed 22: Patient information
Data source
This data may come from either your CAD system or your electronic patient record (EPR) system.
Feed detail
Scope: All patients who were involved in the incidents your organisation responded to within the costing period. This feed is used to take incident-level costs to the patient level.
Feed 22: Patient information is an auxiliary feed, which is matched to Feed 20: Incident information. See Standard CP4: Matching costed activities to incidents and linking to patients.
This feed includes patient information collected during the emergency call and response:
- patient identifying information, for example NHS number or other patient ID
- demographic information, for example age, gender
- information relating to the emergency call, for example reasons for the call (also known as chief complaint)
- type of treatment the patient received:
‒ hear & treat
‒ see & treat
‒ see & convey
‒ other.
These details will not be available for all patients but we expect available data to be recorded and an attempt made to find the NHS number using the electronic patient care record (ePCR), NHS Spine or other services. In spreadsheet IR1.2, data field ‘NHS number status indicator code’ we provide the codes to use when data is not available.
Note that information governance issues should be covered by your organisation’s own procedures, not these standards.
For multiple-patient incidents, the number of conveying vehicles arriving at a treatment location should be used as a proxy for the number of patients involved in the incident. A patient record should be generated for each patient conveyed, even if the patient’s details are not available – that is, a proxy patient record needs to be generated. See Standard CM31: Allocating costs across job cycle elements for details of how to allocate costs to multiple patients involved in an incident.
This feed is linked to Feed 20: Incident information, using activity ID (incident ID) recorded in this feed, matching a patient to an incident. It is linked rather than matched because matching only refers to matching of patient-facing activities.
It is also linked to Feed 21: Response information, using conveying response ID, which matches a patient to the response unit that conveys them.
Feed 23: Staff information
Data source
This data may come from the rota (scheduling) system and electronic staff record (ESR) system.
Feed detail
Scope: All staff shifts, working hours and downtime within shifts within the costing period.
Feed 23: Staff information is a supplementary feed. It is an information source to:
- help allocate staff costs at the level of each individual staff member
- calculate non-responding time for frontline staff. See Standard CM33: Non-responding time.
Best practice is to use information from actual rotas and staff pay. This data can directly link staff costs to the activities the staff delivered and accurately distribute non-responding time across jobs. See Standard CM31: Allocating costs across job cycle elements.
This feed includes information on:
- shift start and end date and time
- staff identifier
- staff working hours
- start and end date and time of downtime
- vehicle identifier.
This feed is linked to Feed 20: Incident information, using staff ID for call-taking staff and clinicians who provide telephone clinical advice. It is linked rather than matched because matching only refers to matching of patient-facing activities.
It is also linked to Feed 21: Response information, using staff ID for frontline staff.
Feed 24: Fleet information
Relevant costing standards
Data source
This data may come from your fleet management system. Feedback from the National Ambulance Information Group is that fleet management information is not available consistently across all ambulance service providers. Where it is not available from a single system, gather information from the available sources.
Please follow the guidance in Standard IR2: Managing information for costing to make the information available for costing.
Feed detail
Scope: All occurrences of vehicle maintenance and repair for all vehicles involved in responding to incidents within the costing period. See Standard CM32: Fleet costs for definitions of patient-facing vehicles and support vehicles.
Feed 24: Fleet information is a supplementary feed. It is an information source to:
- help allocate fleet costs at the level of each vehicle
- calculate non-responding time for vehicles. See Standard CM33: Non-responding time.
This feed includes information on the maintenance and running of vehicles in the fleet:
- vehicle identifier
- parts used in repairs and their costs
- technician time
- time vehicle spent off road (in hours).
Deep-cleaning dates and costs should be collected at the individual vehicle level, using a fleet number or other unique identifier.
This feed is linked to Feed 21: Response information, using vehicle ID.
Additional information feeds and fields
If you already collect information feeds for local reporting or more detailed costing in addition to the five specified above, please continue to do so. Record these in ICAL worksheet 2: Additional information sources.
If your organisation has a well-developed EPR system, you may be able to capture more data on the care given to patients than the standards currently require. You should use this extra data as it will increase local understanding of the costs associated with different activities, and future versions of the standards may require it for costing.
The groups of information listed above are the minimum the standards require for costing but they do not cover all patient activities in ambulance services. You need to decide whether specific local costing needs require additional information feeds. Examples of such feeds are:
- patient transport service (PTS)
- NHS 111 service
- GP out-of-hours services
- commercial activities, such as first-aid training and events cover.
Use these three criteria to prioritise obtaining extra information feeds:
- value of service
- volume of service
- priority of the service within the trust and the healthcare economy.
Identifying hidden activity
Take care to identify any ‘hidden’ activity in your organisation. This is activity not recorded on any of your organisation’s main systems such as CAD.
Capturing ‘hidden’ activity is important to ensure that:
- any costs incurred for it are not incorrectly allocated to the recorded activity, thus inflating its reported cost
- costs incurred are allocated over all activity, not just activity reported on the organisation’s main system such as CAD.
Other data considerations
Use spreadsheet IR1.2 to identify in which part of the costing process this data item is used, with a Y for yes and N for no. You may require more data items for local reporting than are noted as Y in the reporting/business intelligence column.
The feed specifications in spreadsheets IR1.1 and IR1.2 do not include description fields for the codes used, for example organisation name for organisation code. You may need to ask for description fields to be included in the feeds; otherwise you need to maintain code and description look-up tables for each feed to understand the costing data supplied. There should be a process for mapping and a rolling programme for revalidating the codes and descriptions with each service.
IR2: Managing information for costing
Scope
All information required for the costing process.
Overview
This standard provides guidance on how you can minimise the impact of poor-quality activity information when producing cost information. These are short-term measures that allow you to produce cost information in line with the costing principles while your organisation continues to work on the quality and coverage of its information as a whole.
As a costing practitioner, you are not responsible for the quality and coverage of information collected in your organisation. However, you are ideally placed to raise data quality issues.
Most of the required information should be held on your information systems, but its availability will vary due to different information management practices and the capacity of your information technology. See Standard IR1: Collecting information for costing.
This standard does not provide guidance on complying with information governance requirements, including confidentiality, data protection and data security. You should consult your organisation’s information governance teams on policies and procedures.
Agree with informatics colleagues:
- the format of information
- frequency of information feeds and
- any specific data quality checks for costing purposes.
Use this information to populate the information feeds log in your integrated costing assurance log (ICAL). ICAL worksheet 1: Patient-level activity feeds gives an example of a completed patient-level feeds log.
Access local information for allocating overheads, such as whole time equivalent (WTE) information for allocating HR costs.
Approach
Assessing the availability of information for costing
You should work with your informatics department and relevant services to:
- assess the availability of data against Standard IR1: Collecting information for costing
- streamline and automate processes for extracting what is required.
The specific data fields in each feed are given in spreadsheet IR1.2. The quality of information varies between organisations, so you may need to map your data to these fields. Their availability can be grouped as:
- Available from computer-aided dispatch (CAD) systems (most fields in feeds 20 to 22): activity and patient data are recorded based on semi-automated job cycle stage triggers – for example, arriving at the scene, leaving the scene, arriving at the treatment location – from response vehicles and dispatchers, and callers’ answers to questions asked over the telephone by the call handler.
- Available from your local information systems (feeds 23 and 24): this information is collected from local information systems other than CAD. The availability of the information depends on how advanced the local systems at your organisation are – for example, some providers do not collect all the fleet and staff information required.
- Available but not necessarily in a usable format (certain fields in feed 22): activity and patient information from patient report forms (PRFs) completed for each patient by frontline staff. This is often captured and stored on paper, making it difficult to incorporate with other data sources on any scale. Trusts with integrated electronic patient record (EPR) systems should use this data source where possible and appropriate, either instead of information from the CAD system or as a supplement to it.
- Not currently available (certain fields in feeds 20 to 22): for example, number of patients treated at the scene is not collected.
If you are not collecting the required information, you must work with the relevant departments in your organisation to begin collecting it and to make it available for costing. Figure IR2.1 shows how to access data for costing.
Figure IR2.1: How to access data for costing
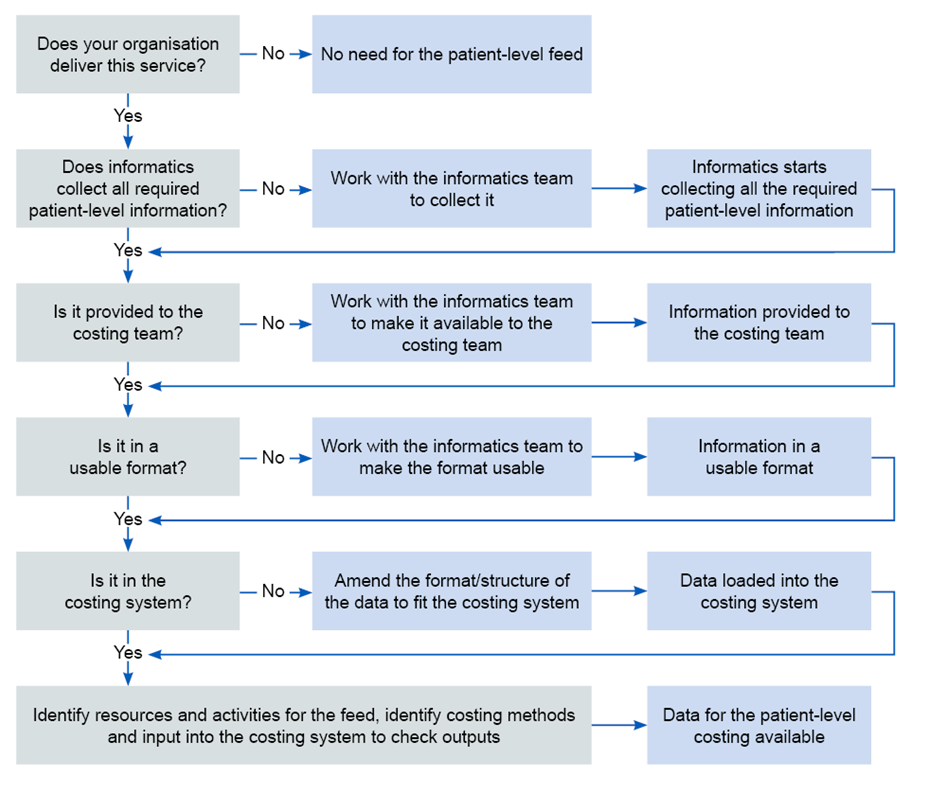
This figure describes the steps of working with the informatic team to make data for patient-level costing available from whether the organisation delivers the service to identifying resources and activities for the feed, costing methods and input into the costing system.
If you cannot achieve all the information requirements initially, you should prioritise accessing:
- fleet information
- staff information
- data fields to:
‒ flag whether an incident involves one or more patients
‒ provide a proxy count of patients based on the number of vehicles arriving at a treatment location.
Data available from systems other than CAD
Payroll data should be available from an internal system such as the electronic staff record (ESR), and rota data should be available from an internal system such as the global rota system, to provide the information required for Feed 23: Staff information.
If you do not currently collect shift data, you should work with your informatics department and relevant operational or scheduling departments to collect it.
You should use staff payroll data to allocate staff costs to the activities these staff deliver. Your CAD system should record which staff respond to which incidents. However, if it does not, continue to use your current method and work towards obtaining the required information. Record the information you collect in ICAL worksheet 2: Additional information source and the approach you use worksheet 14: Local costing methods.
Note: you must ensure the costing team comply with relevant information governance requirements when accessing individual payroll data.
Depending on the development of your fleet management system, Feed 24: Fleet information may or may not be available at your organisation.
If your organisation does not collect the required fleet information, continue to use your current method and work towards obtaining the required information. Record the information you collect in ICAL worksheets 2: Additional information source and the approach you use worksheet 14: Local costing methods.
Available data that may not be suitable for costing
Trusts complete a paper PRF for each patient they treat or convey. In some cases, multiple forms may be completed for the same patient – for example, when care switches between different frontline staff, or when a patient is observed over a long time.
The adoption of EPR systems varies widely, with many trusts still using paper forms; EPR systems vary in their ability to link to hospital systems.
EPR data is not currently prescribed in costing. Any plans to incorporate EPR data into costing should ensure the data is available in a useable format and is of high enough quality (see Figure IR2.2).
Figure IR2.2: Establishing data quality improvement measures
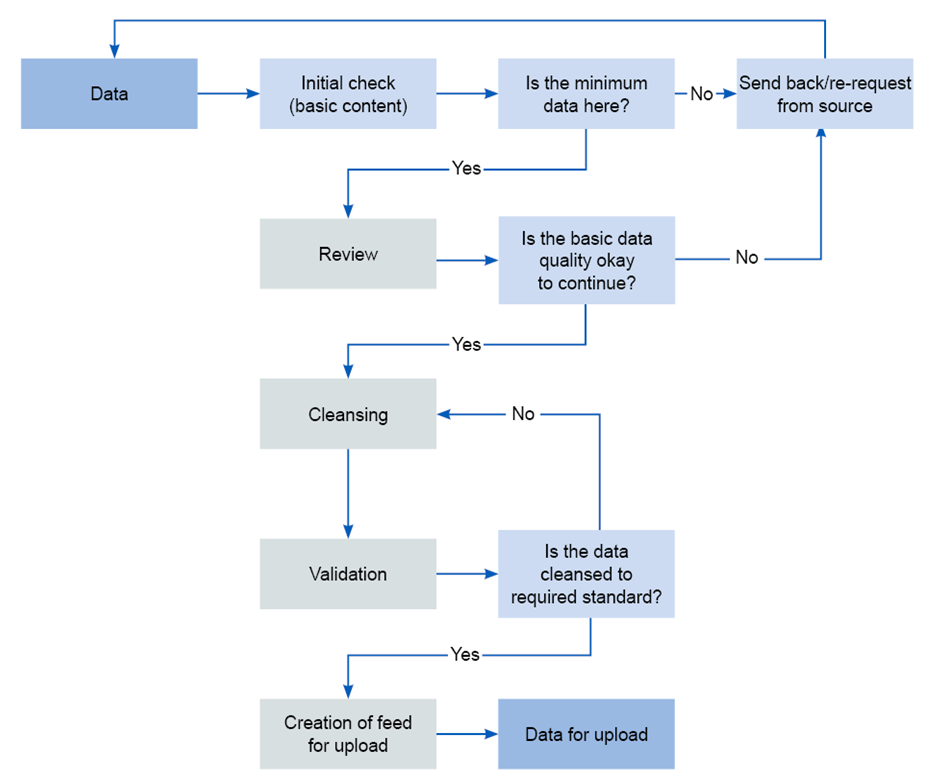
This figure outlines a flow of actions to check whether the minimum data are included, the basic quality is sufficient and it is cleansed to the required standard for the creation of the feed for upload.
In future, quality EPR data could provide a rich and accurate source of data for costing at patient level. Costing systems should be set up in anticipation of this data source becoming available.
Unavailable data and future requirements for data collection
Linking duplicate calls
All call handling activities are recorded in your CAD system. However, when more than one call is made about an incident, only the main call is linked to the incident; all duplicate calls are recorded separately.
To accurately allocate call handling resources it is important to link activity data about all calls, including duplicates, to an incident. This enables you to allocate costs based on the duration of all relevant calls, not just the main call. Developing a way to get this information is a goal for the future development of the standards.
Telephone clinical advice
There are two issues with the activity data on giving telephone clinical advice:
- some providers do not record the duration of giving clinical advice to patients by telephone (ie hear & treat) separately from answering the call and triage, ie, no time stamp is recorded to separate the two activities
- time clinical advisors spend talking to ambulance crews is not recorded.
Separating call handling activities from telephone clinical advice activities is important as different resources need to be allocated to the two types of activity. Developing a way to get this information is a goal for future development of the standards.
In this version of the standards we include a yes/no option for providers that can be used to record when telephone clinical advice is given to ambulance crews (see spreadsheet IR1.2).
Number of patients
In the absence of EPR data, the number of patients treated at the scene cannot be recorded. Developing a way to get this information is a goal for the future development of the standards.
The number of patients conveyed to hospital is not currently recorded by any ambulance provider. Developing a way to collect this data without increasing the workload for call takers or ambulance crews is a goal for the future development of the standards.
Other patient information
Some patient information, such as NHS number, age, gender and clinical data beyond chief complaint, is either unavailable or of poor quality. The full adoption of EPR systems will significantly improve the quality of this information, which is important for meaningful analysis of cost information.
All the issues above are summarised in the list below of items that are either unavailable or have varying availability:
- linking duplicate calls: CAD systems only allow one major call to be linked to an incident. Duplicate calls about the same incident cannot be linked.
- separate time stamps for call handling and providing telephone advice to patients: Some providers do not distinguish between hear & treat and call handling time.
- time stamps for when clinicians provide telephone advice to ambulance crews: Some providers do not distinguish between hear & treat and providing telephone advice to ambulance crews; others have separate resources for each.
- number of patients at the scene: The field exists in some CAD systems based on a question asked during emergency calls but the data quality is poor. Providers using EPR can count the forms completed for unique patients.
- number of patients conveyed to hospital: The field exists in some CAD systems but is reportedly not widely used and when it is, the data is not collected systematically.
- patient information (NHS number, age, gender, etc): Missing values for a significant number of patients.
- clinical data beyond chief complaint: Main source is PRF, which is often available in paper form only and data cannot currently be integrated into the costing system.
Using information in costing
Costing is a continuous process, not a one-off exercise for a national collection. Your costing information should be used for local reporting regularly, so that service managers and senior leaders are familiar with incident cost reporting.
If your organisation has its own quarterly or monthly cost data for local reporting and business intelligence, the National Cost Collection should come from that model. See the Ambulance collections guidance.
If your organisation has no other form of cost data, run the process quarterly as a minimum, although we consider monthly to be best practice.
The benefits of frequent calculation of costs are:
- effects of changes in practice or demand are seen, and you can respond to them while they are still relevant
- internal reporting remains up to date
- mistakes can be identified and rectified early.
It is important the costing system is configured to recognise whether a load is in-month or year-to-date, or it may not load some of the activity.
To ensure the costing system is loading everything it should, follow the guidance in Standard CP5: Reconciliation, and use the patient event activity reconciliation report (see spreadsheet CP5.4).
Bespoke databases, such as fleet management, use the descriptions and codes provided when they were set up. Over time these codes and descriptions may change, become obsolete or be added to. You should map all the descriptions and codes used in the auxiliary and supplementary feeds to those used in the master feeds to ensure the costing allocation methods (particularly matching) are applied correctly. These should be reviewed in a rolling programme.
Refreshing the information feeds
Note the difference between a refresh and a year-to-date feed. A year-to-date feed is an accumulation of in-month reports (unless the informatics team has specified otherwise). A refresh is a rerun of queries or reports by the providing department to pick up any late inputs. The refreshed dataset includes all the original data records plus late entries.
Services will continue to record activity on systems after the official closing date and this activity needs to be costed. Therefore, you need to pick up entries made after the period closes by refreshing the data.
Get a refresh of all the information feeds:
- six-monthly – for the previous six months (April to September)
- annually – for the previous financial year (April to March).
A challenge for costing practitioners is that changes as a result of the refreshes can alter the figures in service-line reports. With the help of the relevant services’ management accountant leads, you need to explain significant changes to users of the service-line reports, highlighting the impact of late inputs to the department providing the information feed.
Using information in the costing system
If the costing system needs to calculate durations – for example, time on scene in seconds, it needs to know which columns to use in the calculation. If the durations have already been calculated and included in the feed, the costing system needs to know which column to use in allocating costs. For the prescribed information feeds, the derived duration fields are included in spreadsheet IR1.2.
Once you decide the method of calculation, use this information to populate the log showing how the costing system uses information feeds in ICAL worksheet 1: Patient-level activity feeds.
Managing information feeds
For each entry you should keep a log of data feeds in ICAL worksheets 1 to 7 including:
- the feed’s source system, data table name, department, named person and a deputy responsible for providing the data source to you
- whether it is an in-month or year-to-date feed
- period covered by the feed: for example, all activities undertaken in the calendar month
- format of information to be loaded into the costing system: SQL script, Excel spreadsheet or text file (for example CSV)
- working day on which the costing practitioner will receive the feed
- any known quality issue with the data source and solutions
- number of records on the feed.
Supporting your organisation to improve data quality for costing, and manage data quality issues in the short term
Data quality issues
The quality of time stamp data for job cycle elements varies. Some providers have many missing values for job cycle element start and end time. This information is vital in cost allocation, as duration of job cycle elements is used as a weighting in many of the allocation methods prescribed (see spreadsheet CP3.3). You need to talk to your informatics and service colleagues to look for ways to make the data records useable in the short term and improve data quality in the longer term. Methods to treat gaps caused by missing time stamps in job cycles should be developed locally and recorded in ICAL worksheets 6: Activity data quality checks and 7: Activity data cleansing.
You need to be aware that the chief complaint or initial diagnosis recorded for a patient does not always accurately reflect their medical problem. This is because it is based on symptoms reported according to triage system coding, not a medical diagnosis by a clinician who has assessed the patient in person.
For providers that have fleet management systems, their use and the quality of data available varies. You should be aware of this and perform quality checks on fleet data (see Figure IR2.2) before incorporating it into your costing system.
Data quality checks
Follow a three-step quality checking process for costing data:
- Step 1 Review the source data: identify any deficiencies in the feed, including file format, incomplete data, missing values, incorrect values, insufficient detail, inconsistent values, outliers and duplicates.
- Step 2 Cleanse the source data: remedy/fix the identified deficiencies. Follow consistent rules and log your alterations, creating a ‘before’ and ‘after’ copy of the data feed. Applying duration caps is part of this step (see Use of duration and other data value caps below). Always report data quality issues to the department supplying the source data so they can be addressed for future processes. Keep data amendments to the minimum, only making them when fully justified and documenting them clearly.
- Step 3 Validate the source data: you need a system that checks the cleansed and correct data is suitable for loading into the costing system. This may be part of the costing system itself. Check the cleansing measures have resolved or minimised the data quality issues identified in Step 1; if they have not, either repeat Step 2 or request higher quality data from the informatics team.
Consider automating the quality check to reduce human errors and varied formats. Automatic validation, via an ETL (extract, transform, load) function of the costing software or self-built process, can save time. But take care the process tolerates differences in input data and, if not, this data is consistent. Otherwise you risk spending disproportionate time fixing the automation.
Your organisation should continuously improve data quality for audit purposes. Request changes to the information feeds from the source department or informatics team, then review the revised data for areas to improve. Set up a formal process to guide these data quality improvement measures and ensure those most useful to costing are prioritised.
Use of duration and other data value caps
Moderate outlier values by rounding them up or down to bring them within accepted parameters. Review the feeds to decide where to apply caps and build them into the costing system.
You can apply a data value cap to reduce outliers: for example, a call that is not properly closed and appears to last over six hours could be reduced to six hours. Applying a cap removes the distraction of unreasonable unit costs when sharing costing information.
Capped data needs to be reported as part of the data quality check. The caps need to be clinically appropriate and signed off by the relevant service.
Example caps are given below. Such caps should be used as the default in the absence of better local assumptions:
- With Feed 1 Incident information in Call duration you could round the call down from ≥3,601 (seconds) to 3,600 seconds.
- With Feed 1 Incident information in Number of response units allocated for incident you could cap the number of response units from ≥21 to 20.
While caps moderate or even remove outlier values, studying these outliers (that is, unexpected deviations) is informative from a quality assurance point of view. You should record the caps used and work with the informatics department and the department responsible for the data feed to improve the data quality and reduce the need for data value caps over time.
Record any duration or other data value caps you use in ICAL worksheet 1: Patient-level activity feeds, showing how the costing system uses patient-level activity feeds.
When information is not available for costing
Information for costing may be unavailable because data is not:
- collected at an individual patient level
- given to the costing practitioner
- in a usable format for costing
- loaded into the costing system and included in costing processes.
If you are missing any of the required data fields in spreadsheet IR1.2, follow the steps shown in Figure IR2.2 above to make the data available for costing.
Until the data becomes available, you need to:
- continue to use your current methods
- document these in your costing assurance log
- start discussions with the department responsible for the data on how to obtain the information for costing.
Where data is not available because it has not been made available to the costing practitioner, work with the costing steering group to agree a solution and work towards obtaining the data. See the FutureNHS Assurance of cost data: learning extension.
Costing processes
Before you implement the costing processes in this document, you should review:
‒ spreadsheet CP3.1: Resources for patient-facing costs
‒ spreadsheet CP3.2: Activities for patient-facing costs
‒ spreadsheet CP3.3: Allocation methods to allocate patient-facing resources, first to activities then to incidents and finally to patients.
CP1: Ensuring the correct cost quantum
Scope
This standard should be applied to all lines of the general ledger (GL).
Overview
You need the income and expenditure for costing. We refer to this as the GL output. This output needs to be at cost centre and expense code level and is a snapshot of the general ledger at a point in time. Expense codes may also be called ‘account codes’ or ‘subjective codes’.
You do not require balance sheet items for costing.
If your charitable funds are within your general ledger, they should be identified and not included in the costing system, except where costs funded by charitable funds have been transferred to own patient care services.
You can bring your general ledger into your costing system by bringing in:
- the trial balance: for audit purposes this should balance to zero or
- only the cost and income: this should reconcile to your statement of comprehensive income.
To reduce the burden on your costing system, we recommend the second approach.
As a minimum, you should bring the values into the costing system each quarter. This allows regular work to map the GL combinations in the costing system in a manageable way. Leaving this process to the year-end will be a burden on the costing and wider finance teams.
As superior method, SCM83 Loading finance data from the GL monthly, you can bring your financial values into the system in the cycle that is recognised by financial management teams. See spreadsheet CP3.5 Superior and alternatives. Loading financial values more frequently can enable swifter resolution of mapping problems and allow more accurate adjustments.
The general ledger is closed at the end of the period, after which it cannot be revised although some systems may allow you to back-post payroll journals. For example, if in March you discover an error in the previous January’s ledger that needs to be corrected, the correction can only be made in March’s ledger. Doing so will correct the year-to-date position, even though the January and March figures do not represent the true cost at those times: one will be overstated and the other understated. Check with the finance team to ensure that only finally closed periods that contain any such changes are brought into the costing system.
If such corrections are material, you may choose to amend the costing system GL input with a journal, ensuring an audit trail is kept of such adjustments to ensure reconciliation.
The timing of when some costs are reported in the general ledger may pose a challenge. For example, overtime pay for a particular month may be posted in the general ledger in the month it was paid, not the month the overtime was worked. This highlights a limitation in the time-reporting and expense payment system that we recognise but are not currently proposing a work-around for.
Discuss the general ledger’s layout and structure with the finance team so that you understand it. Referring to the financial accounting requirements may help. This will help you understand the composition of the costing output.
Keep a record of the input of cost into your costing system for each costing period. There may be multiple loads and we recommended each load is noted and recorded in integrated costing assurance log (ICAL) worksheet 12: GL load record.
Approach
Obtaining the general ledger output
The finance team should tell you when the general ledger has been closed for the period and give you details of any off-ledger adjustments for the period. You need to put these adjustments into your cost ledger (CL), especially if they are included in your organisation’s report of its financial position, as you will need to reconcile to this.
Keep a record of all these adjustments in ICAL worksheet 11: Adjustments to the general ledger at each load, to reconcile back to the GL output. Take care to ensure that any manual adjustments are mapped to the correct line of the cost ledger. If the number of adjustments is significant, you can maintain a log of adjustments elsewhere and record the location of the file(s) in the costing assurance log.
Ensure the process for extracting the GL output is documented in ICAL worksheet 8: Extracting GL output. Extract this only after the finance team tells you it has closed the general ledger for the period.
The finance team should tell you when it has set up new cost centres and subjective codes in the general ledger, and when there are material movements in costs or income between subjective codes or cost centres. Cross-team approval increases the different teams’ understanding of how any changes affect them.
Finance teams should not rename, merge or use existing cost centres for something else without informing you, as not knowing when this has been done will cause problems. Finance teams should close a cost centre and set up a new one rather than renaming it. If this is not possible, they should tell you about any changes.
The new GL cost centres and expense codes need to be mapped to the cost ledger. You then need to reflect these changes in the costing system.
‘Error suspense’ ledger codes need to be addressed so that all costs can be assigned accurately to incidents. Work with your finance colleagues to determine what these codes contain so that the contents are mapped to the correct lines of the cost ledger. Organisations may use a different name for these codes, such as holding or ‘dump’ ledger codes.
You should have a rolling programme of regular meetings with your finance colleagues to review the general ledger and its role in costing. This can identify problems and enhance their engagement with the use of the data.
Where income from a charitable donation appears in the general ledger it should be aligned with the expenditure in the cost centre and expense code where the expenditure is recorded, using the income code shown in spreadsheet CP2.1. This allows compliance with both costing standards (income should be identifiable) and collections (charitable income can be netted off from the cost which it funded).
Where charitable cost centres are in the general ledger the expenditure and income on the cost centre should net to zero at the end of the costing period. The income not used would normally be deferred until the next period but you should review any negative balances on the charitable fund cost centres and ensure the costing system does not offset the income against the cost of own patient care cost group. A set of charitable fund cost centres is shown in the cost ledger as cost centre codes starting with WWW for transparency.
CP2: Clearly identifying costs
Scope
This standard should be applied to all lines of the general ledger (GL) in conjunction with the GL load described in Standard CP1: Ensuring the correct cost quantum.
Overview
The costing processes should identify and consistently allocate costs to enable meaningful analysis both locally and nationally.
An organisation’s general ledger is normally set up for local requirements rather than to support the standardised cost process. This means general ledgers will vary in structure.
This standard aims to ensure a process is in place to take this into account when the costing process starts, ensuring costs are mapped to resources consistently. To achieve this, the Approved Costing Guidance uses a standardised cost ledger (CL). See Ambulance technical document spreadsheet CP2.1.
The standardised cost ledger ensures that as part of the costing process, all costs across the NHS are categorised and allocated in the same way. This process is called general ledger to cost ledger (GL to CL) mapping.
This standard describes a flexible approach that enables you to decide between two methods of GL mapping. These methods are defined as:
- Method 1 – Essential mapping: This method will take your GL chart of accounts directly to the collection resources or overheads.
- Method 2 – Full mapping: This method will take your general ledger and map all the GL codes to the standardised cost ledger.
This standard describes the process for method 2 mapping as this is our preferred approach for most organisations. It also details how you should allocate overheads to patient-facing and incident resources so that they can be distributed to activities. You can find more detailed explanations with examples in the FutureNHS Ledger mapping learning extension.
As part of your costing process, you may encounter elements of negative cost and the treatment of these is explained at the end of this standard.
There will also be some areas of your ledger that need specialist treatment. You should ensure you understand and implement Standard CP5: Reconciliation and Integrated Standard CM8: Clinical and commercial services.
In completing method 1 you should ensure you do not miss costs that need remedial action to get them in the right place to start the costing process.
Approach
The following key principles enable you to clearly identify costs and allocate them according to the prescribed methodology:
- Patient-facing costs relate directly to delivering patient care and are driven by patient-facing activity. Incident costs also relate directly to delivering the ambulance service to support patients. For the purposes of this standard, incidents are called ‘patient-facing costs’ even though some incident activity will take place before the patient is reached.
- Patient-facing costs can be either pay or non-pay and should be allocated using an activity-based allocation method. The allocation of resources is covered in Standard CP3: Allocating costs to activities.
- Patient-facing costs are grouped into resources for allocation and linked to activities in the costing process.
- Overheads do not directly relate to delivering patient care, and many relate to running the organisation. For example, they may be a corporate service, such as finance or a service role such as ward clerk.
- Corporate overheads such as finance and HR are allocated to all services that used them, using a code starting T1S, each with a prescribed allocation method. These costs should not be directly mapped to resources and activities in the costing process.
- Income can be clearly and transparently identified.
Work with your financial management team to ensure costs are aligned to the correct location in the cost ledger starting with the most material items first.
Mapping methods
You may choose either method 1 – essential mapping or method 2 – full mapping (see above). You may change mapping methods to meet the needs of your organisation. You may combine mapping methods if that better represents your organisation.
Whichever method you choose:
- you must understand the general ledger, especially larger items, and make sure costs are mapped appropriately to resources
- ensure the costing system reconciles at resource method; otherwise further steps will not reconcile and may prove more complex to unravel. See Standard CP5: Reconciliation and the FutureNHS Assurance of cost data: learning extension.
Over time, all trusts should aim to use method 2 mapping where method 1 does not ensure consistency for national level analysis. For example, where different allocation methods are prescribed by costing resource and costing activity level but only one allocation method is possible at collection resource and collection activity level.
Trusts may wish to retain some elements of method 1 mapping if that is more suitable for the environment you are working in.
Figure CP2.1 shows the application of the cost ledger to the organisation’s general ledger in the two mapping methods.
Figure CP2.1: Mapping methods
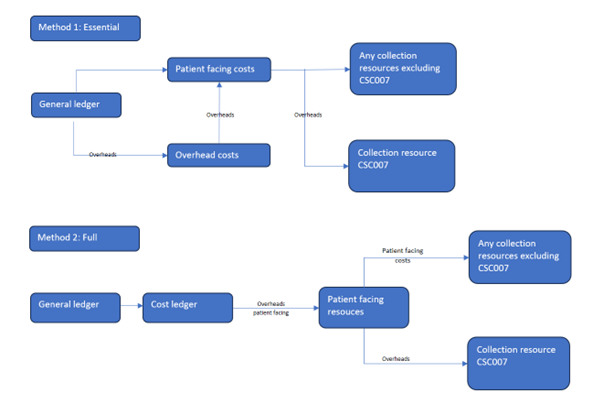
This figure outlines the two mapping methods. Essential method 1 maps costs from the general ledger to patient facing and overhead costs and then any collection resources excluding CSC007 and collection resource SCS007. Full method 2 maps costs from the general ledger via the cost ledger to patient-facing resources and then any collection resources excluding CSC007 and collection resource CSC007.
Complying with method 2 requires an in-depth investigation of the general ledger to understand the costs but you should not get too focused on immaterial details.
Method 2 provides a way to get the costs into the right starting position with the appropriate label – that is, from your general ledger to the CL costing account codes, and then to the correct resource codes.
Method 1 is more straightforward and aggregates costs to collection resources. There are benefits to implementing method 1 including the ability to establish a holistic view of your GL costs.
If you use method 1, retain evidence of your mapping exercise if this can’t be completed in your costing software. It should evidence that all material costs have been considered.
Regardless of mapping method, you should still comply with the prescribed resource and overhead allocation methods in spreadsheets CP2.2 (for overheads) and CP3.3 (for patient-facing resources).See Standard CP3: Allocating costs to activities for more detail.
You should not use locally defined allocation methods to allocate costs. You should use either a superior costing method or an alternative as listed in the technical document on CP3.5. You should note the method in your ICAL and ensure your executive team are aware of this.
There are potential risks to adopting method 1, as there is more risk of inaccuracy. Trusts should be aware of these risks and plan appropriate mitigations.
If as an organisation, you choose not to complete the full GL to CL exercise, it is still important to understand method 2. The FutureNHS Ledger mapping: learning extension outlines the main premises of the two mapping methods.
Implementing method 2
The cost ledger outlines the chart of accounts suitable for most costs in most trusts but is not exhaustive. Where the cost ledger does not have a combination of cost centre and expense code required for your organisation, you should refer to the resource application hierarchy (RAH) tool and customise your cost ledger.
You should review the mapping exercise at least once a year, in line with any refresh of the ambulance technical document, to ensure it remains representative of how the costs in each part of your general ledger are used for costing.
The process of GL to CL mapping may run incrementally or simultaneously. For ease of understanding, we describe the process in linear steps.
The transformation of the general ledger into the resources should occur within your costing system to ensure that mappings can be traced and reconciled to your general ledger.
If your costing process takes place at a more granular level than the prescribed costing resources, you may continue using this method. The use of local resources or cost items will require the implementation of an additional mapping process. You should log the method you use in ICAL worksheet 15: Superior costing methods.
Your actions should include:
- Disaggregation: Some costs may be reported in the general ledger at a level that is not detailed enough for costing, for example where multiple costs are combined in a singular GL code. These costs need to be disaggregated when creating the cost ledger, using an appropriate method.
- Aggregation: Some costs may be reported separately in the general ledger, but for patient-level costing these costs can be aggregated when creating the cost ledger to simplify areas with the same treatment.
- Remedial actions: If a cost has been incorrectly recorded in the general ledger, it should be corrected at this point.
At the same time or following the system process to put the costs into the right starting place following the GL to CL mapping, the costing system will undertake a process called reciprocal costing (see below for more detail).
Figure CP2.2 Simplified costing process
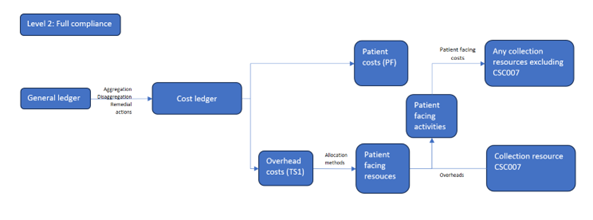
Figure CP2.2 is a flow diagram outlining a simplified costing process from general ledger to cost ledger then overhead costs and patient costs feeding into patient facing resources and from there to patient facing activities.
Treatment of overheads (including reciprocal costing)
Certain costs in your general ledger are not patient facing but provide the support services for clinical and non-clinical areas. These are called overheads.
Overhead costs refer to expenses associated with running an organisation that can’t be directly linked to the treatment of a patient. They are incurred regardless of activity level.
Overheads should be allocated to the cost centre(s) which use the service using prescribed allocation methods. Once the overhead has been allocated to the cost centre(s), it should be apportioned to the expense codes within the cost centre(s).
Overheads are grouped into overhead titles and assigned a T1S code in spreadsheet CP2.2. Each T1S code and its allocation method is shown in spreadsheet CP2.2.
As superior method, SCM84 Overhead costs (patient level), you may use an appropriate two-step allocation method which incorporates a patient or incident level activity-based method.
Figure CP2.3 describes the treatment of overheads from the general ledger to cost ledger to collection. Overheads that have been absorbed into patient-facing resources need to be separated for the cost collection and grouped into the two support collection resources: CSC004 (Pay) and CSC005 (Non Pay).
Figure CP2.3 Simplified GL to collection output
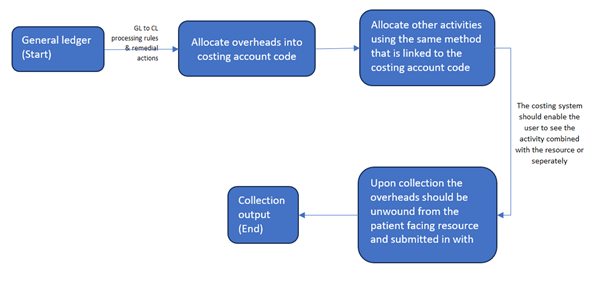
Figure CP2.3 describes the treatment of overheads from the general ledger to cost ledger to collection output.
Using an expenditure-based allocation method, some areas of the ledger may get a larger proportion of the allocated overheads because of specific high cost items.
Costs that may affect the allocation calculation include the Clinical Negligence Scheme for Trusts (CNST), high cost medicines, interventional radiology/nuclear medicine consumables or prostheses. If so, investigate and correct the overheads allocation and adjust the allocation to allow for this. Any amendment to overheads should be recorded in your ICAL worksheet 13. Percentage split of allocation bases.
Devolved and centrally held costs
During your review of the general ledger, it is important to identify whether a cost is centrally held or has already been devolved to the relevant cost centres in the cost ledger – for example, as part of service-line reporting. You should discuss the allocation method used for devolving costs with your financial management department, so you can understand whether the devolved general ledger represent costs allocated using a method prescribed for costing.
Once understood, you can identify any steps needed to put the costs in the correct starting place for the costing process:
- If the cost is held centrally in the general ledger: use the prescribed allocation method.
- If the cost is already devolved to the cost centre that used it, using the prescribed method or a superior method: no action – costs are already in the correct place. You do not need to aggregate the costs.
- If the cost is already devolved to the cost centre that used it, but not using the prescribed method or a superior method: aggregate to a central code, so the process will use the prescribed allocation method.
Reciprocal costing
This standard prescribes reciprocal costing. This enables allocation of overheads across patient facing and other overhead cost centres, as all those services have ‘used’ the cost of the overhead. It must take place within the costing system.
You should do this using a reciprocal allocation method, which allows all corporate support service costs to be allocated to, and received from, other corporate support services. For example, HR costs should be allocated across all cost centres that have staff, as all staff benefit from HR services.
A reciprocal allocation method reflects the interactions between supporting departments and therefore provides more accurate results than a hierarchical approach.
Overheads should not be allocated using a hierarchical method as this will only allow cost to be allocated in one direction between corporate support services.
Following this process, patient-facing costs with their allocated portion of overheads are then mapped to resources.
General ledger negative costs
A negative cost is a balance less than zero on a costing account code that is for expenditure. This code would normally have a positive balance to show the expenditure.
Negative costs flowing into the costing system can cause problems in calculating an appropriate cost for a patient event, as they reduce the true cost of the care. Where a negative cost is significant, the impact may even show as patient events which have a negative cost. In the data validation engine negative costs will show as a warning for any negative row of data, and a submission failure if the aggregate currency is negative. For example, the total of point of delivery, treatment function code and healthcare resource group could not be a negative.
When doing the final, full-year costing process for the National Cost Collection, many negative balances that show in the monthly or quarterly reporting disappear, as the expenditure in that costing account code will be sufficient to offset them. However, you should monitor negative balances throughout the year, to avoid major issues.
Our FutureNHS Negative costs: briefing note has more detail.
Cost classification
Classifying costs as fixed, semi-fixed or variable is not part of the costing calculations but rather a classification showing how costs behave based on the level of activity. It is therefore used for reporting purposes, based on national classification rules given here and in spreadsheet CP2.1 The standardised cost ledger.
This classification is important for an organisation’s internal financial management as well as for discussions about service change and developing local payment mechanisms.
When activity levels change, costs do not all change in the same way. Variable costs will usually change in relation to the activity change but fixed costs will remain the same over the given period.
You should classify each line in your cost ledger as fixed, semi-fixed or variable, based on a timeframe of 12 months. Where trusts are applying method 1 mapping and do not use the cost ledger, they should still ensure they have an appreciation of which costs are fixed, semi-fixed and variable.
Fixed costs
Fixed costs remain the same regardless of the level of activity.
Typical examples of fixed costs include corporate costs such as rates, depreciation, CNST, financial charges and board of directors’ costs.
Agenda for Change (AfC) staff at band 8a and above are classed as fixed, as the AfC guidelines state these grades do not qualify for overtime. Trust scale senior managers are also classified as fixed costs. This classification should be applied regardless of the role or duties for which they were employed.
Medical staff basic pay must be paid regardless of their activity, so this is a fixed cost.
Semi-fixed costs
Semi-fixed costs remain the same until a certain level of activity is reached; the costs then increase in proportion to the level of activity or ‘step up’ to a new level, where again they remain the same until the next threshold of activity is achieved.
Costs are defined as semi-fixed when the level of cost needed to maintain the infrastructure to deliver the contracted activity level is fixed. The costs incurred to deliver activity above that level are thus variable.
Staff contracted at band 7 and below are classified as semi-fixed costs, as their salary is fixed but they can work and be paid for overtime.
Variable costs
Variable costs increase in proportion to the level of activity.
Variable costs are only incurred to deliver activity – for example, medicines, patient consumables and hire or issue of equipment – and the cost will depend on the level of activity.
The costs of additional sessions that reduce waiting lists will be variable.
Locums, agency and bank staff will also fall into this category. We understand that sometimes these staff are contracted to cover longer term absences (for example planned staff sickness) but as a general principle these staff should be classified as variable.
Other considerations
As each CL line is mapped to a classification, resources may end up containing costs of all three cost classifications, based on how overheads are allocated in the costing process. The classification of fixed/semi-fixed/variable costs will be applied at CL level. Therefore, resources will not map to a single classification.
Activity codes are not classified as fixed, semi-fixed or variable. Some expense codes within an activity will vary in classification according to the behaviour of the cost when the number of patient events changes.
The classification should be applied regardless of the role for which an individual was employed. For example: a nurse manager may have a portion of their role in a clinical setting and the rest in a management capacity. Their whole role will be considered as one classification.
CP3: Allocating costs to activities
Scope
This standard should be applied to all costs reported in the costing system and all activities undertaken by the organisation.
This standard covers relative weight values (RWVs): data items used to create a proportional allocation of costs; for example square metres of floor area as a proportion of the whole floor area. They are an agreed weighting of an item used to allocate costs for a patient event. See the Costing glossary.
Overview
The standardised costing process using resources and activities aims to capture cost information by reflecting how those costs are incurred.
After mapping from the general ledger to the cost ledger and resources, the costing process allocates resources to incidents and patients in three steps:
- Step 1: allocate resources to activities (as explained in this standard)
- Step 2: match costed activities to the correct incident (Standard CP4: Matching costed activities to incidents and patients)
- As a superior method, link the costed incidents to patients Standard CP4: Matching costed activities to incidents and patients).
The allocation methods prescribed in the standards in most cases do not include an RWV for acuity or intensity. If you are using an RWV for acuity or intensity on top of the prescribed allocation method, continue to do this and record it in integrated costing assurance log (ICAL) worksheet 15: Superior costing methods.
Approach
Resources
Resources are the components used to deliver the activities, such as staff, equipment and consumable items. The costs of providing these resources are recorded in your general ledger, and the resource code prescribed by the standards groups these costs into themes.
In the standardised cost ledger (see spreadsheet CP2.1) all patient-facing cost lines are mapped to the prescribed resources. Once you have mapped your general ledger to the standardised cost ledger, you will get a subset of resources that your organisation uses from the list shown in spreadsheet CP3.1.
The costs within a resource may include overhead costs, as overheads are allocated to patient-facing resources to be allocated to activities. For example, the patient-facing frontline staff resource could include the costs of frontline staff salaries and overheads such as operational manager costs, station non-pay costs, HR and finance costs. See Standard CP2: Clearly identifying costs for more detail.
The transparency of these costs – what they are and where they come from in the general ledger – should be maintained throughout the costing process. In the National Cost Collection, the overheads are identifiable as separate pay support cost and non-pay support cost collection resources.
Once these separated costs have been calculated they can be aggregated to whatever level the resources have been set at, and you can be confident the resource unit cost is accurate because it is underpinned by this costing process.
Activities
Activities are the work all resources carry out to deliver the services that achieve desired outcomes for patients; for example, answering a call or treating patients at the scene.
This standard prescribes a list of activities for ambulance services (see spreadsheet CP3.2).
Together, resources and activities form a two-dimensional view of what costs were incurred to deliver services. The acceptable combinations are shown in spreadsheet CP3.3 PF allocations, with the prescribed allocation method.
You need to identify all the activities your organisation performs from the prescribed list of patient-facing activities in spreadsheet CP3.2.
Some activities are informed by activity feeds: for example, the activity mobile to scene (activity ID: AMA183) uses information from Feed 21: Response information for costing.
Spreadsheet CP3.2 indicates which prescribed patient-level feed informs the activity or if another information source is required where a patient-level feed is not prescribed.
Allocate resources to activities
There are four different types of source information that inform the activities:
- master feeds
- auxiliary feeds
- standalone feeds
- RWVs.
You need to use these prescribed resource and activity combinations in your costing system.
Identify the resource and activity combinations used in the costing process for your organisation by:
- obtaining the list of resources for your organisation from mapping your general ledger to the cost ledger or mapping directly to resources (see Standard CP2: Clearly identifying costs)
- reviewing the prescribed list of activities to identify those performed by your organisation (see spreadsheet CP3.2).
You must allocate resources to the activities using the methods prescribed in spreadsheet CP3.3.
Ignore combinations of activities and their related resources in the spreadsheet CP3.3 if your organisation does not perform them.
You must allocate resources to the activities using the methods prescribed in spreadsheet CP3.3.
Resources need to be allocated to activities in the correct proportion. There are three ways to do this:
- based on actual time, items or costs from the relevant information feed prescribed (the actual costs should be used as a proportional RWV rather than as a fixed cost amount to be allocated to a patient event)
- using RWVs created in partnership with the relevant departments
- using a local information source.
Where one resource needs to be apportioned to several activities, you need to determine the percentage of the cost to apportion to each activity after discussions with clinicians and managers, supported by documented evidence where available (for example paramedic rota plans). These splits and their basis should be recorded in ICAL worksheet 13: % allocation bases. Note this is a different process from disaggregating costs in your general ledger to map them to the cost ledger.
For example: the disaggregation of band 6 front-line staffing costs to three different activities is shown in Figure CP3.1 while this is the resource/activity matrix for a division of frontline staffing costs:
- Job cycle activities: £24,000
- Private and events: £3,000
- Commercial training: £3,000
- Total of all: £30,000.
Figure CP3.1: Identifying the correct quantum of cost to be apportioned to activities
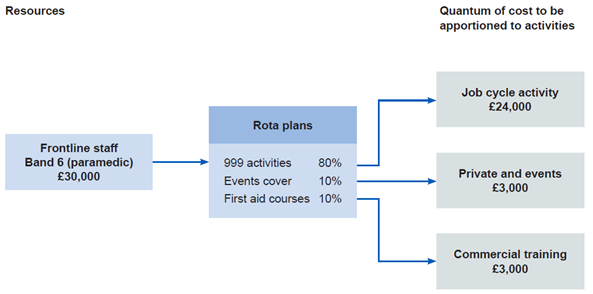
Figure CP3.1 outlines the correct quantum of cost to be apportioned from frontline staff via rota plans to activities.
Note that in this example the job cycle activities are shown as a group. The full costing process will apportion the frontline staffing resources to a range of job cycle activities such as allocation to mobile, mobile to scene, time on scene, convey patients to treatment location, patient handover and handover to clear. (See Standard CM31: Allocating costs across job cycle elements).
You should not apportion resources or costs equally to all activities without clear evidence they are used in this way.
Use an RWV unless there is a local reason for applying a specific traceable cost. You should document the reason for using a traceable cost in the integrated costing assurance log (ICAL) worksheet 14: Local costing methods.
Where the same cost driver is used for several calculations in the costing system, and the costs can be disaggregated after calculation, you can aggregate the resources in your costing system to reduce calculation time. For example, if several resources for treating patients at the scene use the driver ‘duration of the activity’, you can add them together for the cost calculation.
If you have a more sophisticated cost allocation method for resources to activities:
- confirm whether it is considered a superior costing method on spreadsheet CP3.5
- if it is shown on CP3.5, keep using it
- document it in ICAL worksheet 15: Superior costing methods.
If your method does not show on CP3.3 or CP3.5 contact us at costing@england.nhs.uk. spreadsheet CP3.5 contains the methods we have accepted as superior methods, developed from experiences of implementation across sectors. We like to hear about other methods you are using based on experience, so if appropriate we can add them to the prescribed or superior lists.
Some superior methods require a subset of resources. For example, standard superior method SCM7 allocates actual payroll detail for frontline staff. To do this, a resource below the standard level of resources is needed for each staff member. There is no requirement currently to adopt this method, but if you are already performing such detailed work, continue to do so and log it in ICAL worksheet 15: Superior costing methods.
There are some cost allocation methods we do not accept as superior to the prescribed methods. These include using income or national averages to weight costs.
The activity feeds will inform the cost allocation methods providing key cost drivers, such as duration of each job cycle element. The information feeds will also provide information about the RWVs (see below) to be used in the costing process, such as fleet repairs and maintenance costs in Feed 24: Fleet information.
Investigate any costs not driven to an activity or any activities undertaken by your organisation that have not received a cost and correct these.
Relative weight values
You should allocate all material costs based on actual use or consumption using the prescribed allocation method and an information feed. However, where there is no information feed, or the costs are immaterial, use a relative weight value to allocate costs.
RWVs are a method of using appropriate source information as a proportional (percentage) weighting to distribute or ‘drive’ the allocation of cost. An example of a relative weight value is shown in Figure CP3.2. Relative weight values may be used to:
- disaggregate costing account codes so the cost can flow to different resources in conjunction with the mapping to the cost ledger (see Standard CP2: Clearly identifying costs)
- apportion overheads to resources (see Standard CP2: Clearly identifying costs and the FutureNHS Overhead allocation: learning extension)
- apportion resources where resources deliver more than one activity (see Figure CP3.1)
- allocate costs from resources to activities
- attribute costed activities to incidents.
One way to store the RWVs for use in your costing system is to compile statistic allocation tables.
Income values and national cost averages should not be used as relative weight values.
You must develop and agree RWVs with the relevant service, to ascertain all aspects of the costs involved and ensure these are as accurate as possible.
Different costs will require different approaches to derive appropriate RWVs to support their allocation.
RWVs should be reviewed on a rolling programme or when a significant change occurs in the relevant department.
Overheads
The cost ledger shows the costing account codes that relate to overhead costs, by using a code starting T1S in spreadsheet CP2.1. To allocate overheads in the correct proportion, you will need to create RWVs by obtaining the relevant information from the departments, for example RWVs for actual whole time equivalent (WTE). See the FutureNHS Overhead allocation: learning extension for more details.
CP4: Matching costed activities to incidents and linking to patients
Scope
This standard should be applied to all costed activities.
Overview
Matching is integral to accurate incident level and patient-level costing. For an accurate final patient unit cost, the costed activities need first to be matched to the incident and then linked to the patient(s). This allows the final costed record to show the different components of cost within the incident and patient event.
The matching process for ambulance costed activities involves three steps:
- Step 1: allocate resources to activities (see Standard CP3: Allocating costs to activities)
- Step 2: match activities to incidents
- Step 3: link costed incidents to patients.
This three-step matching process is used because more than one patient can be treated in any one incident (which is widely used as the unit of activity for ambulance emergency responses). To derive the patient unit cost, you need to first match costed activities to the incident and then link these activities to the patient.
Matching costed activities to incidents can be done using one of two approaches:
- for activities informed by an information feed, use the matching fields in the information feeds (see spreadsheet IR1.1)
- for all other activities, use the prescribed cost allocation methods to match the costed activities to incidents.
Matching physical response stage activities (including allocation to mobile, mobile to scene, time on scene, convey patients to treatment locations, patient handover and handover to clear) and some call-stage activities (including call taking and telephone clinical advice) to incidents takes place before the costing process – it is done in your computer aided despatch (CAD) system (see Standard IR1: Collecting information for costing). Therefore, you do not need to repeat this step to match these activities in the costing process.
Linking costed incidents to patient(s) can be done using either of the two approaches below:
- for single-patient incidents, link the costed activities matched to the incident to the patient recorded for the incident
- for multiple-patient incidents:
‒ first use the prescribed cost allocation rules to produce patient-level cost for each activity matched to the incident
‒ then link the costed activities (at patient level) to the patients recorded for the incident.
Limitations of the data on number of patients, patient identifiers and other patient information (see Standard IR2: Managing information for costing for details) mean that exact matching of costed activities to each patient involved in one incident is not currently possible. The standards prescribe cost allocation rules, and you are required to create proxy patient records to generate patient unit costs (that is, a patient-level cost).
We will update this standard with rules to match costed activities to individual patients once information is available to enable this; we anticipate this will be possible once the electronic patient record (EPR) system has been more widely adopted by the ambulance sector.
Approach
Matching costed activities to the incident
The prescribed matching fields ensure the relevant auxiliary information feeds can be attached to the correct incident.
The incident, call or response ID always generates the best match.
If you obtain your auxiliary information feeds from the CAD system and you can include the incident ID in the feeds, use this ID to match the auxiliary feed (for example response information feed) to the master feed (incident information feed).
Matching physical response stage activities and some of the call stage activities to incidents is done in your organisation’s CAD system (see spreadsheet 3.3 for details).
However, there are problems matching activities to incidents when:
- duplicate calls are taken
- clinical advice is provided to an ambulance crew at the scene.
These problems are discussed in Standard IR1: Collecting information for costing.
Where a duplicate call can be identified and matched, the cost should be absorbed as an overhead absorbed back to the primary incident/call.
For unmatched clinical advice provided to an ambulance crew at the scene, you should treat the cost allocated to these activities as an overhead and absorb them to ‘Call handling and telephone clinical advice’ activities.
- Once costed activities are matched to the incident, the next step is to link the costs to patients and create patient unit costs.
Linking incident-level costs to patients
The process linking to patient(s) differs depending on whether an incident involves one patient or more than one patient.
Use number of vehicles arriving at the treatment location in Feed 20: Incident as a proxy for the number of patients involved in each incident to determine whether an incident is a single-patient or a multiple-patient. See Standard CM31: Allocating costs across job cycle elements and Standard IR2: Managing information for costing, for an explanation of why the proxy is used.
Linking incident-level costs to patients in single-patient incidents
Most incidents are single-patient incidents. After matching the costed activities to these single-patient incidents, you should have the patient unit cost.
You should then link the costed incident to the patient recorded for the incident to create patient-level costs using recorded incident identifiers (activity ID) and patient identifiers (patient ID) in Feed 22: Patient information.
We know that patient identifiers are not always collected, so the incident will show with no patient. In these cases, a proxy patient record (with a proxy patient ID) needs to be generated to match to the costs for the incident.
You will now have patient-level costs for all incidents that involve single patients.
Linking incident-level costs to patients in multiple-patient incidents
A small proportion of incidents involve more than one patient. Creating patient-level costs from incident-level costs for these incidents involves an extra step to the process linking the cost of a single incident to a single patient described above.
Use the prescribed cost allocation rules to produce patient-level cost for each activity matched to the incident, then link the costed activities (at patient level) to each of the patients recorded for the incident.
Producing patient-level costs
Use number of vehicles arriving at the treatment location as a proxy for the number of patients conveyed, and then split the costs of each activity matched to the incident between this number of patients.
Use the cost allocation rules prescribed in spreadsheet CP3.3 to allocate the incident-level activity costs to all the patients involved in an incident to derive the patient unit cost.
Linking to patients
You should then link the costed incident to the patients recorded for the incident to create patient-level costs using recorded incident identifiers (activity ID) and patient identifiers (patient ID) in Feed 22: Patient information.
Limitations of the information collected on patients mean it is not currently possible to match every patient involved in a multiple-patient incident (see Standard IR2: Managing information for costing and Standard CM31: Allocating costs across job cycle elements).
As with single incident/single-patient events, we know that patient identifiers are not always collected. For multiple-patient incidents where the total number of patients recorded in Feed 22: Patient information is smaller than the number of vehicles arriving at the treatment location, proxy patient records (with proxy patient IDs) need to be created in the information feed. This is to ensure that all the costs at the patient level have a patient record to link to, and you are therefore costing ‘a’ patient not ‘the’ patient.
You will now have patient-level costs for all incidents that involve multiple patients.
Other considerations
The accuracy with which costed activities are matched depends on the quality of the feeds. Follow the guidance in Standard IR2: Managing information for costing, to help your organisation improve its data quality.
If your matching rules are more sophisticated than the prescribed matching fields and improve the accuracy of your matching, continue to use them and record them in ICAL worksheet 15: Superior costing methods.
Your costing system should produce a report of the matching criteria used in the system, as described under Reconciliation of incident- and patient-level activity in Standard CP5: Reconciliation, and you should have a rolling programme to review this.
Reporting unmatched activity for local business intelligence
Organisations have traditionally treated the cost of the unmatched activity in different ways. Most commonly, it has been absorbed by matched activity, a practice which can have a material impact on the cost of matched activity, particularly when reviewing the cost at an individual patient level for benchmarking and decision-making.
For local reporting purposes, we recommend you do not assign unmatched activity to other incidents or patients but report them as reconciliation items.
If reported unmatched activity forms a material proportion of an organisation’s expenditure, this is likely to be due to inadequate source data. As this issue will deflate the incident unit cost and the patient unit cost, it needs to be identified and steps taken to improve the quality of the source data, rather than artificially inflating the unit costs by allocating unmatched activity. Please follow the guidance in Standard IR2: Managing information for costing, to support your organisation in improving its data quality.
For national reporting, refer to the Ambulance collections guidance, and ensure that unmatched costs not linked to incidents are treated appropriately.
CP5: Reconciliation
Scope
- This standard covers all costs, income and activity included in the costing process.
Overview
All costing process outputs must reconcile to the information reported to the board, submitted for national reporting, and in the final audited accounts. This ensures a clear link between the costing outputs and the costs and activity information captured in the source data.
Reconciliation to an agreed tolerance is important as it allows users of cost data to use it with confidence. See the FutureNHS Assurance of cost data: learning extension and the costing principle: materiality. The benefits of reconciliation include assurance that:
- the data is reliable and complete
- patient unit costs reflect the true cost of treatment, undistorted by provider-incurred costs unrelated to the organisation’s own-patient activity
- the true cost is more appropriate for benchmarking between peers as non-patient related costs can significantly affect cost reporting by different providers.
Tolerance levels: for your reconciliations you should agree the level of acceptable difference between input values and output values with your costing steering group. The tolerance level for patient events may be different percentages for the different datasets that are reconciled to. See the Reconciliation section in the Ambulance collections guidance for the financial value tolerance level in the national submission.
Approach
The costs and income outputs from the costing system must reconcile to the main sources of this information which are the general ledger output and the organisation’s reported financial position. See Standard CP2: Clearly identifying costs, where adjustments may be made between the general ledger output and the cost ledger these must be included in your reconciliation.
The incident and patient event outputs should also reconcile to what has been reported nationally. For example, if your organisation reports XX incidents in any costing period, your activity costing outputs should reconcile to this.
The submissions to national datasets will include data items that are not used for costing; for example, activity under a provider-to-provider contract. These should be noted on your local reconciliation as they will form part of the difference between the costing system outputs and the submission made by your organisation.
To avoid any reconciliation differences due to timing, the information feeds used in the costing process and those reported by the organisation should be created at the same time.
Reconciliation of cost and income
To demonstrate that the costing system’s outputs reconcile to the main sources of cost, income and activity information, use the reports detailed in under Reconciliation of incident- and patient-level activity. The reports must be created from the costing system as described in the Minimum software requirements on FutureNHS.
To support reconciliation and reporting, once the costing model is fully processed, the costs associated with incidents, patients and other cost groups should be classified into the following four cost groups:
- Own-patient care:
‒ National Cost Collection included services: incidents
‒ Services performed by another NHS provider: clinical services received (such as capacity purchased from private inpatient organisations)
‒ Patient care for patients funded from outside the NHS: private patients, overseas visitors, non-NHS funded patients and patients funded by the Ministry of Defence
- Activities other than patient care:
‒ Costs relating to research and development or education and training in the organisation
- Other activities
‒ National Cost Collection included services that are not incidents
- Commercial services: Cost and activity reconciliation items
‒ Services performed by another NHS provider: cost to provide agreed resources to an external body with no responsibility for delivering a service to a commissioner, for example a provider-to-provider service-level agreement, cost to employ a staff member, such as a youth worker, for activity undertaken by the local council and the trust is unable to include it in the costing system
‒ Accounting adjustments: grants or donations received
- Services excluded from the National Cost Collection: homecare medicines including factor products; homecare appliances.
To complete the reconciliation, it is also necessary to understand the income shown in the organisation’s accounts:
- Operating income (relates to cost group ‘own patient care’
‒ National Cost Collection included services: income for own patient care – for example incidents
‒ services performed by another NHS provider: clinical services received (such as capacity purchased from private organisations)
- Patient care outside the NHS: private patients, overseas visitors, non-NHS funded patients and patients funded by the Ministry of Defence.
- Other operating income (this income group includes income that does not relate to own patient care):
‒ income relating to research and development in the organisation
‒ income relating to education and training in the organisation
‒ commercial income
- For further information on the treatment of income in the National Cost Collection, please see the Reconciliation section of the NCC Ambulance guidance.
- Recharges and adjustments to cost (this income can be netted off from the cost to reduce the value shown in the costing system):
- Recharges between trusts where the staff/service is provided at cost, but the employing trust does not have all the activity that is supported (subject to a materiality decision).
Reconciliation of incident- and patient-level activity
You should reconcile the incident and patient outputs to the incident and (where used) patient activity counts in the source datasets, to ensure all the activity you entered in your costing system has been costed and included in the costing output. Use the information feed log in ICAL worksheet 1: Patient-level activity feeds to record the input data. This can then be used to compare to the output data.
The activity outputs should be the same data your trust reports: for example the costed incidents should reconcile to the contracting reports and other national submissions as relevant to each service area, to ensure all data produced and submitted is consistent and accurate.
Some costed activity outputs should be reconciled to external sources such as the national ambulance quality indicators return.
To demonstrate the costing system’s outputs reconcile to the main sources of activity information, use activity reconciliation reports below as created from the costing system, as described in the Minimum software requirements on FutureNHS:
- Core activity reconciliation: Shows the core ambulance activity used in the costing model reconciled to the original source data – for example, number of calls, number of physical responses, number of incidents, number of patients – with all exclusions and amendments clearly recorded and explained.
- Patient event activity reconciliation: Shows patient event activity used in the costing model – for example on-scene time – reconciled to the initial data feeds, with all exclusions and amendments clearly recorded and explained.
- Board report reconciliation: Enables reconciliation of incidents used in the costing model to the board report based on geographical areas – for example, locally defined operational areas or Integrated Care Boards (ICBs). This activity must also be reconciled to the outputs of the costing system to ensure all activity has been processed.
- Full cost reconciliation: Shows the full costs for all the activities loaded into the costing system as part of the outputs of the costing model.
- Timing differences reconciliation: Records timing so if differences in the timing arise between capturing the activity in the costing system and the activity reported by the provider, these differences can be explained. To avoid these timing differences, it is good practice to use a dataset for trust reporting produced on the same day as that to be used in the costing system.
- Output activity reconciliation: Demonstrates that the activity from the source datasets matches the outputs of the costing system, except for any legitimate – and documented – adjustments or exclusions. This reconciliation report should encompass activity feeds received from the informatics team, data warehouse or equivalent, as well as any activity data captured and reported manually.
- Non-NHS patient report: Ensures all activity that does not relate to NHS patients is clearly identifiable and reportable to enable the use of the costing system to complete a National Cost Collection return.
Proxy records
Proxy records may be generated for services that do not keep a record of patient contacts for information governance purposes; see Standard IR2: Managing information for costing. You should ensure that proxy records are included in the activity reconciliation.
Services with legally restricted/sensitive data requirements
You will need to consider pseudonymising data for services with legally restricted/sensitive data. Some services have extra levels of required information governance for them because the legal data holding regulations and patient consent differ.
‘A’ patient rather than ‘the’ patient will need to be costed. The reconciliation of both cost and activity with other trust records will need to take this into account.
Trust to trust services reconciliation
Your trust may provide services for other NHS ambulance trusts and may receive services from other NHS ambulance trusts. This includes ‘cross border’ journeys where your call centre takes the call but a neighbouring service vehicle is despatched, or where your vehicles support calls to other emergency services. Integrated Standard CM8 Services supplied and services received provides more information.
Where your trust has the activity but no cost, as the costs are incurred by another NHS trust, you cannot cost this activity. Report this activity in the ‘cost and activity reconciliation items’ cost group, and ensure it is noted in your activity reconciliation. You must make this activity data available to the other trust at the required contractual level. For NHS providers, the activity data should include all the prescribed information required for the Approved Costing Guidance and the National Cost Collection.
If you have cost but no activity at incident level because the contractual detail is in the information system of another trust, you should request the incident information from the other trust and enter it in your costing system. If there are difficulties obtaining this data, discuss the next steps with your costing steering group, and contact the NHS England costing team at costing@england.nhs.uk.
Costing standards
Before you implement the costing methods in this section you should read and understand Section 1: Information requirements and Section 2: Costing processes.
To successfully implement the costing methods, use them in conjunction with the technical document, especially the following spreadsheets:
- spreadsheet IR1.2: Field requirements for the activity feeds
- spreadsheet CP2.2: Overheads allocation method
- spreadsheet CP3.1: Resource list
- spreadsheet CP3.2: Activity list
- spreadsheet CP3.3: Methods to allocate resources to activities
For CM31: Allocating costs across job cycle elements, you will also need to read and understand:
- spreadsheets CM31.1 and CM31.2: Costing ambulance activity flowcharts – single and multiple patients.
For CM33: Non-responding time, you will also need to read and understand:
- spreadsheet CM33.1: Definition of non-responding time
Note the standard numbers are set across all sectors; therefore, the costing method standards for ambulance costing do not start at CM1.
CM31: Allocating costs across job cycle elements
Scope
This standard applies to all job cycles within the costing period.
The job cycle comprises the series of activities issuing from the emergency operations centre (EOC): receiving a call, deciding on an action, sending one or more responses to treat one or more patients, the treatment at the scene and conveying patients to a treatment location.
A job cycle starts when:
- a call is received – if the call comes through the 999 call centre
- a response is assigned – if the patient is referred from other services such as NHS 111 (note: a response involves vehicle and staff)
- a response is self-assigned – if a staffed emergency vehicle or clinician encounters an incident before a call is made, and they are immediately on scene with the patient (also known as a running incident).
A job cycle ends when the response is ready to be sent on another job.
This standard covers the allocation of costs to activities at a patient level. The method is based on information recorded for the job cycle elements for activity that goes through the 999 control centre.
Overview
The duration of each stage of the job cycle is an important cost driver and is affected by multiple factors, including demand, supply, location (rural, urban), level of traffic, nature of clinical complaint, clinical decisions, hospital emergency department (ED) capacity, hospital handover procedure and ambulance turnaround procedure.
One job cycle process model should represent all incidents. To clarify how different combinations of activities fit into the model, we have divided the approach into the following sections:
- job cycle stages and activities
- costing call stage activities
- costing physical response stage activities
- costing multiple-patient incidents
- costing incidents with no patients.
Approach
Job cycle stages
The job cycle consists of one to three call stages and one to six physical response stages, as listed below. Call and physical response stages can occur at the same time, but physical response stages never overlap for the same response. See the flowchart (Costing ambulance activity) in spreadsheet CM31.1 for details of each stage.
- Call stages (stage 1):
‒ Stage 1.1: Call handling (answering and finding out location – call stages T0 to T2 for most computer-aided dispatch (CAD) systems)
‒ Stage 1.2: Triage (call stages T3 to T6 for most CAD systems)
‒ Stage 1.3: Telephone clinical advice provided by EOC clinicians.
- Physical response stages (stages 2 to 6):
‒ Stage 2.1: Mobilisation
‒ Stage 2.2: Travel to scene
‒ Stage 3: On scene
‒ Stage 4: Travel to treatment location
‒ Stage 5: Handover
‒ Stage 6: Handover to clear.
The start and end points of these stages are recorded on the CAD system. The duration may be recorded or may need to be calculated.
An incident can terminate at the end of any of the following five stages, depending on the scenario:
- A call resulting in no further response, for example a duplicate or information call incident will terminate at Stage 1.1: Call handling stage
- A call which, after initial contact with the call taker, results in telephone clinical advice, either through transfer or call back incident will terminate at Stage 1.3: Telephone clinical advice
- A response is dispatched but then cancelled before arriving at the patient’s location incident will terminate at Stages 2.3 to 2.7: Physical response cancelled, but stage 6 must still be completed
- No patient at the scene, patient(s) treated at the scene or referred for further treatment without being conveyed from the scene incident will terminate at Stage 3: On scene, but stage 6 must still be completed
- Patient(s) conveyed to treatment location incident will terminate at Stage 6: Handover to clear.
Although telephone clinical advice is primarily an alternative to sending a physical response, it can be given alongside physical response dispatch in these circumstances:
- a response was dispatched before the call was triaged down to a ‘hear & treat’; it was subsequently cancelled before arriving at the scene
- a caller requires telephone advice while a response is on its way to them; examples include giving advice to women in labour and on performing resuscitation
- ambulance staff on scene call the clinical hub for advice; for example, on toxicology where there is a suspected overdose or poisoning.
Job cycle stage activities
Eight patient-facing activities are prescribed in the standards based on the job cycle stages. See CP3: Appropriate cost allocation methods and spreadsheet CP3.2 for detailed definitions. The job cycle stages map to the prescribed list of activities, as shown below.
The call stage includes 1.1 call handling, 1.2 triage and 1.3 telephone clinical advice. These map to AMA180 Call handling and telephone clinical advice.
The physical response stage includes:
2.1 Mobilisation maps to AMA182 allocation to mobile
2.2 Travel to scene maps to AMA183 Mobile to scene
3 On scene maps to AMA184 Treating patient on scene
4 Travel to treatment location maps to AMA185 Convey patient to treatment location
5 Handover maps to AMA186 Patient handover
6 Handover to clear maps to AMA187 Handover to clear
The dispatch and control (AMA181) activity can occur during either the call or physical response stage.
The costing information for these stages is described below, in two sections: the call and telephone clinical advice and then the physical response.
Costing call stage activities (call handling and telephone clinical advice)
Input information
Obtain Feed 20: Incident information and Feed 22: Patient information feed for all call stage activity as prescribed in Standard IR1: Collecting information for costing and spreadsheets IR1.1 and IR1.2.
Use the matching fields in spreadsheet IR1.1 to ensure the supplement feeds such as the staff information feed match to the correct calls.
Allocating costs
Spreadsheet CP3.3 specifies the detailed methods to allocate costs to call stage activities.
Where duration of call (in seconds) is used as weighting for cost allocation:
- use the duration of the main call associated with the incident (CAD systems do not currently enable the user to identify all calls relating to one incident. The National Ambulance Information Group has indicated this may not be difficult to solve, but one complication is that trusts use different CAD systems. For this version we only use the duration of the main call.
- use the duration of individual duplicate calls for those that cannot be matched to any incident.
CAD system
Cost of the CAD system should be allocated equally to all call stage and physical response stage activities regardless of their duration, as time is not a driver for this cost.
Call handler and EOC clinician
Allocate relevant call handler (AMR149) and EOC clinician (AMR150) resources to the activity: call handling and telephone clinical advice (AMA180).
The duration of clinical advice given to ambulance staff on scene is not currently recorded; however, where it can be costed (for example by recording whether clinical advice was given to the crew), this should be allocated to the treating patient on scene (AMA184) activity in the physical response stage.
Where EOC activity is contracted to a third-party provider, the costs should be allocated to the relevant call stage activities using duration (in seconds) as a weighting. See Integrated Standard CM8: Clinical and commercial services.
EOC telephony
Allocate EOC telephony (AMR148) costs to call handling and telephone clinical advice (AMA180) using the duration (in seconds) of each activity as a weighting.
EOC dispatchers
Use the number of responses allocated to each incident (number of allocations) as a weighting to allocate the costs of EOC dispatchers (AMR151) (that is, the people who dispatch responses) to the dispatch and control (AMA181) activity. Do not use the duration of the actual activity as the weighting as this is difficult to record (the ‘dispatch part’ is very short and the ‘control part’ occurs simultaneously for several incidents).
For each resource and activity combination, there is a prescribed allocation method in spreadsheet CP3.3.
Matching to incidents and linking to patients
Activity information on call taking and telephone clinical advice is recorded in Feed 20: Incident information. Therefore, it does not require matching to the incident.
Use the incident ID and patient ID recorded on Feed 22: Patient information to link the costed call stage activities to patient(s).
Costing physical response stage activities
Input information
Obtain Feed 20: Incident information and Feed 21: Response information for all physical response stage activities as prescribed in Standard IR1: Collecting information for costing and spreadsheets IR1.1 and IR1.2.
Use the linking fields in spreadsheet IR1.1 to ensure the feeds such as Feed 23: Staff information and Feed 24: Fleet information link to the correct physical responses. See Feed 21: Response information.
Allocating costs
Spreadsheet CP3.3 specifies the detailed methods to allocate costs to physical response stage activities.
Fleet resources and frontline staff resources
Fleet resources and frontline staff resources need to be apportioned between non-responding time and patient-facing activities. See Standard CM33: Non-responding time, for details.
Fleet resources apportioned to patient-facing activities should then be allocated to physical response activities using the allocation methods specified in Standard CM32: Fleet costs and spreadsheet CP3.3.
Note that fleet resources are not allocated to the activity allocation to mobile (AMA182). This is because the time of allocation to mobile consists mainly of staff time, for example getting to the vehicle and getting ready to mobilise. If the staff are in the vehicle when a job is allocated, it usually takes very little time to mobilise.
- Frontline staff resources apportioned to patient-facing activities should be allocated to all job cycle activities delivered by each staff member, using the duration (in seconds) of each physical response stage activity as a weighting, as specified in spreadsheet CP3.3.
Community first responders
- The costs of the community first responder service should be allocated to the activities allocation to mobile (AMA182), mobile to scene (AMA183) and treating patient on scene (AMA184) for all incidents within the responsible area of the community first responder service, using the duration (in seconds) of each activity as a weighting.
Medicines, clinical supplies and consumables
Medicines, clinical supplies and consumables costs should be allocated equally to all incidents that take up any on-scene time. This is because currently these costs cannot be matched to incidents and time is not a cost driver for this group of costs – that is, time does not predict drug or dressing use. The costs should be allocated to incidents within locally defined areas or service lines to ensure the consumable costs are allocated to the correct incidents. Allocate the costs to treating patient on scene (AMA184), convey patient to treatment location (AMA185) and patient handover (AMA186) activities.
Third-party resources
Where activity is contracted to another provider such as a private ambulance service, the costs should be allocated across each physical response stage activity of the relevant incidents using duration (in seconds) as a weighting. See Integrated Standard CM8: Clinical and commercial services.
Third-party patient transport costs (for example taxi to convey patients) should be allocated to the relevant convey patient to treatment location (AMA185) activities using actual spend as a weighting.
Hospital ambulance liaison officers
Costs of hospital ambulance liaison officers (HALOs) should be allocated to the patient handover (AMA186) activity using the duration (in seconds) of the activity as a weighting.
Sometimes the duration of patient handover is not recorded in the CAD system. In these cases, use the national target of 15 minutes for patient handover as a proxy for the duration. The duration of handover to clear can then be calculated by subtracting the duration of patient handover from the recorded time between arriving at the treatment location and clear.
Matching to incidents and linking to patients
Use the matching fields specified in spreadsheet IR1.1 to match physical response activities in Feed 21: Response information to incident in Feed 20: Incident information.
Use the incident ID and patient ID recorded on Feed 22: Patient information to link the costed activities to patients. See Standard CP4: Matching costed activities to incidents and patients, for details.
Costing multiple-patient incidents
- See Standard CP4: Matching costed activities to incidents and patients, for more details of matching costed activities to multiple patients involved in an incident.
Currently, most providers do not record the number of patients treated in an incident. See Standard IR1: Collecting information for costing and Standard IR2: Managing information for costing, for more detail on data collection, management and assumptions. The number of patients conveyed to a treatment location can be estimated from the number of vehicles making this journey: ambulances usually transport one patient each. In this version of the standards we assume that one response conveys one patient. We understand that not all vehicles can transport patients in a conventional sense, and in rare cases a vehicle can convey more than one patient.
The steps involved in multiple-patient incidents and the ways to cost them are shown in the flowchart in spreadsheet CM31.2.
Allocating costs for multiple patients seen and treated at the scene only
- The cost of seeing and treating multiple patients at the scene includes all costs incurred up until a response unit leaves the scene, including resources to deliver activities:
- call handling and telephone clinical advice (AMA180)
- dispatch and control (AMA181)
- allocation to mobile (AMA182)
- mobile to scene (AMA183)
- treating patient on scene (AMA184).
As a count of patients treated at the scene cannot currently be obtained, these incidents should be flagged as multiple-patient incidents but costed as if there were only one patient. You should do this by:
- following the steps for costing call stage and physical response stage activities
- linking the costs to the one patient recorded on the CAD system (or your electronic patient record (EPR) system if that is available).
Note that such incidents costed as single-patient incidents should still have the multiple-patient incident flag.
The costing output for incidents that involve multiple patients treated at the scene only is the same as that for single-patient incidents.
We appreciate this is not the most accurate approach to allocate on-scene costs as it allocates the costs of treating multiple patients to one patient. This can result in variable patient-level costs for treatment on scene.
We will update this standard with rules to match costed activities to individual patients once information is available to enable this. We anticipate this will be possible once the ambulance sector has adopted the EPR system more widely.
Allocating costs where some or all patients involved in the incident are conveyed for treatment
The cost of a patient treated on scene includes all the costs of each response sent until it leaves the scene. You should:
- follow the steps for costing single-patient incidents to allocate costs to relevant activities
- split the costs allocated to call handling and telephone clinical advice (AMA180), dispatch and control (AMA181), allocation to mobile (AMA182), mobile to scene (AMA183) and treating patient on scene (AMA184) between the patients conveyed.
Match the costs allocated to activities convey patient to treatment location (AMA185), patient handover (AMA186) and handover to clear (AMA187) to the response and then to the incident.
Link Feed 22: Patient information to Feed 21: Response information using patient ID and response ID to create patient-level cost.
The costing output for incidents that involve multiple patients and for which patient(s) are conveyed for treatment is the same as for single-patient incidents. However, costs of each resource and activity combination need to be split between the patients conveyed to produce a report for each patient. If three patients are conveyed, there will be three outputs for the incident.
We appreciate this is not the most accurate approach to allocating costs, as the costs of treating patients not conveyed are allocated to those who are.
Costing incidents with no patients
Some incidents involve no patients – for example, when a call is cancelled while a response is on its way to the scene because a patient informs the ambulance service there is no emergency or the ambulance arrives at the scene but the patient has left the area and cannot be found. These incidents are covered in scenarios 2.6, 2.7 and 3.1 in the flowchart in spreadsheet CM31.1.
Activities for an incident with no patient should be costed as for a single-patient incident and assigned a flag indicating there was no patient. In this way the number of such incidents and their costs are recorded. We acknowledge the information necessary to flag in the CAD system whether a patient is at the scene is not always collected.
Table CM31.1: Example of allocating costs in different scenarios
|
Scenario |
Number of patients treated on scene only |
Number of patients conveyed |
Multiple- patient incident? |
Allocating costs to patient level |
|
Incident with no patients |
0 |
0 |
No |
Treat as a single-patient incident |
|
No patients treated on scene only, one patient conveyed |
0 |
1 |
No |
Single-patient incident |
|
No patients treated on scene only, multiple patients conveyed |
0 |
2+ |
Yes |
Use the number of conveying vehicles as a proxy to split costs between the patients conveyed |
|
One patient treated on scene |
1 |
0 |
No |
Single-patient incident |
|
One patient treated on scene; one patient conveyed |
1 |
1 |
Yes |
Treat as a single-patient incident. Allocate all costs to the patient conveyed |
|
One patient treated on scene; multiple patients conveyed |
1 |
2+ |
Yes |
Allocate all costs to the patients conveyed. Use the number of conveying vehicles as a proxy to split costs between the patients conveyed |
|
Multiple patients treated on scene; no patients conveyed |
2+ |
0 |
Yes |
Treat as a single-patient incident. Allocate all costs to the patient recorded on CAD |
|
Multiple patients treated on scene; one patient conveyed |
2+ |
1 |
Yes |
Treat as a single-patient incident. Allocate all costs to the patient conveyed |
|
Multiple patients treated on scene; multiple patients conveyed |
2+ |
2+ |
Yes |
Allocate all costs to the patients conveyed. Use the number of conveying vehicles as a proxy to split costs between the patients conveyed. |
CM32: Fleet costs
Scope
This standard applies to all fleet costs within the costing period. Fleet costs are defined here as costs relating to:
- depreciation of vehicles
- lease of vehicles
- insurance for vehicles
- maintenance and repair of vehicles
- vehicle preparation/cleaning
- fuel
- support costs for vehicles.
Overview
Whether a fleet cost is considered a patient-facing or a support cost largely depends on the type and use of the vehicle. You must follow the definition of patient-facing and support costs in Standard CP2: Clearly identifying costs, to determine which vehicles are patient-facing and which non patient-facing, to categorise fleet costs.
Overheads for fleet
For non patient-facing vehicles, depreciation, lease, insurance, fuel, and maintenance and repair (including the facilities required to do these) are categorised as overheads for fleet.
Fleet management and administration costs for both patient-facing and non patient-facing vehicles are categorised as overheads for fleet.
Overheads for all fleet vehicles in each service line should be allocated using the method specified in Standard CP2: Clearly identifying costs and spreadsheet CP2.2.
Patient-facing fleet costs
For patient-facing vehicles, depreciation, lease, insurance, vehicle preparation and cleaning, fuel and maintenance and repair (including the facilities required to do these) costs are categorised as patient-facing costs.
These costs are mapped to the patient-facing fleet resources which are allocated to physical response stage activities using the methods specified in Standard CP3: Appropriate cost allocation methods and spreadsheet CP3.3.
Approach
Apportioning fleet costs to different service lines
In some organisations, the same vehicles may be used for activity going through the 999 control centre, the patient transport service (PTS) and potentially other services (for example commercial services). It should be possible to record which service a vehicle is working for during a shift so that costs can be allocated correctly using locally developed relative weight values.
Overheads for fleet need to be apportioned to all relevant service lines using the consistent methods specified in Standard CP2: Clearly identifying costs and spreadsheet CP2.2.
Allocating overheads for fleet
Overheads for fleet apportioned to the 999 service line should be allocated to patient-facing resources in the relevant teams or locally defined/geographical areas using the method specified in Standard CP2: Clearly identifying costs and spreadsheet CP2.2. The area across which the fleet support costs are allocated should be chosen so that the allocation to the vehicles is as accurate as possible, given the available data.
Patient-facing fleet resources
Depreciation, lease and insurance costs
Depreciation schedules provide the data for allocation of vehicle depreciation. The cost of depreciation for each vehicle should be calculated quarterly as a minimum. All these costs should be mapped to the vehicle depreciation resource (AMR153).
For leased vehicles, quarterly (or more frequently) lease costs can be recorded or calculated for each vehicle. All these costs should be mapped to the vehicle lease resource (AMR156).
For both leased and owned vehicles, insurance is a significant part of the cost. Insurance cost records provide the data for insurance allocation to individual vehicles and should be calculated quarterly as a minimum. All these costs should be mapped to the vehicle insurance resource (AMR155).
Maintenance and repair costs
For providers that use their own workshops, a breakdown of the cost by vehicle for repairs should be obtained, including labour, parts and workshop support costs. These costs should be mapped to the fleet maintenance and repair – internal resource (AMR154).
Facilities are required to carry out maintenance and repairs, and to house vehicles not in use. The costs of these should be mapped to the fleet maintenance and repair – internal resource (AMR154).
For providers that contract third-party workshops, the costs of maintenance and repairs should be mapped to the fleet maintenance and repairs – external contracts resource (AMR152). As these costs will not be attributable at vehicle level, a different allocation method is used from that for the fleet maintenance and repair internal resource.
Vehicle preparation and cleaning costs
You should map all costs on vehicle deep cleaning (make ready) to the fleet preparation/cleaning resource (AMR158). For providers that contract third-party make-ready services, the costs of the contracts should be mapped to the same resource.
Fuel costs
You should map all costs on fuel for patient-facing vehicles to the fuel resource (AMR157).
Linking patient-facing fleet costs to specific vehicles
All the patient-facing fleet costs should be linked to the relevant vehicles by fleet reference number or vehicle ID.
Your fleet management system should provide the information required to make the link. However, This according to the National Ambulance Information Group. not all providers can currently access this information. If your trust cannot link these costs to specific vehicles, the costs should be allocated across all relevant vehicles using locally defined allocation methods.
Allocating patient-facing fleet costs
Input information
Obtain Feed 21: Response information and Feed 24: Fleet information for all physical response stage activity as prescribed in Standard IR1: Collecting information for costing and spreadsheets IR1.1 and IR1.2.
Use the vehicle ID in spreadsheet IR1.1 to ensure the fleet information links to the correct response.
Allocating costs
Spreadsheet CP3.3 specifies the detailed methods to allocate fleet costs to physical response stage activities and non-responding time.
Vehicle depreciation (AMR153), lease (AMR156) and insurance (AMR155) resources, and fleet maintenance and repairs (AMR152 and AMR154) resources should be apportioned between patient-facing activities and non-responding time (AMA188) using the methods specified in Standard CP3: Appropriate cost allocation methods and Standard CM33: Non-responding time. Note that fuel (AMR157) and fleet preparation/cleaning (AMR158) resources should not be apportioned to non-responding time.
Allocate all the fleet resources apportioned to non-responding time equally to all non-responding time (AMA188) activities as specified in Standard CM33: Non-responding time and spreadsheet CP3.3.
Allocate the resources, except fuel, that have been apportioned job cycle time to the five patient-facing activities using the duration (in seconds) of each activity as a weighting, as specified in Standard CM31: Allocating costs across job cycle elements and spreadsheet CP3.3:
- mobile to scene (AMA183)
- treating patient on scene (AMA184)
- convey patient to treatment location (AMA185)
- patient handover (AMA186)
- handover to clear (AMA187).
Allocate fuel (AMR157) resource to travelling activities only (mobile to scene (AMA183) and convey patient to treatment location (AMA185) using the duration (in seconds) of each activity as a weighting.
For incidents that involve multiple patients, split all the patient-facing fleet costs allocated to the relevant activities between the patients linked to the incidents, as specified in Standard CP4: Matching costed activities to incidents and patients and spreadsheet CP3.3.
For each resource and activity combination, there is a two-step prescribed allocation method in spreadsheet CP3.3.
CM33: Non-responding time
Scope
This standard applies to all non-responding time within the costing period.
This standard excludes non-responding time for the hazardous area response team (HART).
Overview
A safe ambulance service requires a minimum level of response be available at all times, even though the resources kept for this purpose may be used infrequently in some areas.
Non-responding time is defined as the time frontline staff and vehicles are available to respond to a 999 call but do not actually respond.
The diagram in spreadsheet CM33.1 defines different blocks of time for frontline resources, including for staff and vehicles:
- absence (planned and unplanned)
- downtime
- time available, not responding
- time actively responding.
Non-responding time should be the ‘time available, not responding’ only.
The cost of non-responding time for frontline staff and vehicles should be allocated to the activity non-responding time (AMA188).
Approach
Calculating non-responding time for vehicles and staff
Non-responding time for each frontline staff member is calculated by subtracting the total time spent responding to incidents (job time), absence (planned and unplanned) and downtime from the total recorded working hours over a costing period (for example month). See spreadsheet CM33.1 for definitions of the time blocks.
Non-responding time for each patient-facing vehicle is calculated by subtracting the total time spent responding to incidents (job time), absence (planned and unplanned) and downtime from the total time of the costing period (for example month). See spreadsheet CM33.1 for definitions of the time blocks.
The information needed to calculate non-responding time is shown in spreadsheet IR1.2:
- working hours and absence for frontline staff – from Feed 23: Staff information
- off-road time for vehicles – from Feed 24: Fleet information
- job time – from Feed 21: Response information.
An example of calculating non-responding time is provided below.
We are aware that staff are paid compensation when their meal breaks are interrupted. However, since these cannot be traced to individual shifts, they must be included in the cost of the relevant staff across all the activities they perform.
Using relative weight values to split non-responding time at the resource level
Once non-responding time has been calculated for each frontline staff member and vehicle, you can use it to calculate the percentage division of different blocks of time including job time, non-responding time, absence and downtime for each resource. This percentage division is used to apportion costs to job cycle activities and non-responding time activities. See Figure CM33.1 below for an example.
Time of absence and downtime should be grouped with responding time and the costs of these times allocated to job cycle activities: allocation to mobile (AMA182), mobile to scene (AMA183), treating patient on scene (AMA184), convey patient to treatment location (AMA185), patient handover (AMA186) and handover to clear (AMA187). See Standard CM31: Allocating costs across job cycle elements.
Figure CM33.1: Identifying the correct quantum of cost to be apportioned to non-responding time activities
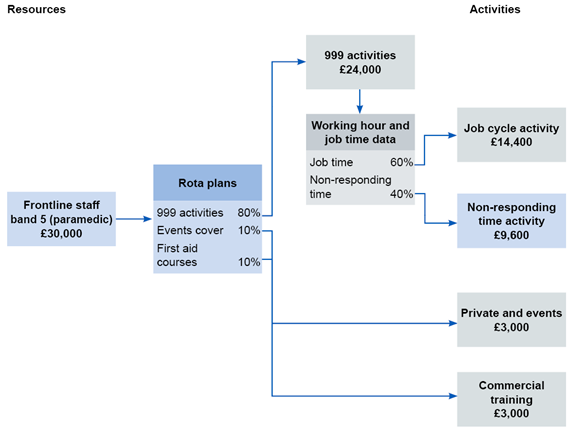
Figure CM33.1 outlines the correct quantum of cost to be apportioned from frontline staff via rota plans to 999 activities and then via working hour and job tie data to job cycle activity and non-responding time activity.
Allocating costs to non-responding time activity
Treat non-responding time as an activity (AMA188) that consumes the frontline staff and fleet resources in the same way as responding to an incident. The exclusions and reasons for them are:
- fleet preparation/cleaning (AMR158): as these resources are only consumed to treat patients
- fuel (AMR157): although a vehicle may be driven when it is not responding to an incident, we have not included fuel costs, as recording this movement for costing is not currently practical; the fuel costs incurred during non-responding time should be allocated to job cycle activities: mobile to scene (AMA183) and convey patient to treatment location (AMA185)
- frontline staff – officer or manager (AMR142): officers and managers sometimes cover frontline work and respond to incidents but this is not their main job; costs of their time not spent on a job should not be treated as non-responding time but as support costs, for example operational support
- third-party resources (AMR146): non-responding time is relevant to own frontline resources only.
Splitting costs equally between all jobs that a resource responded to during a period is the fairest way, as no aspect of the job itself affects the time spent not responding. Costs of non-responding time should be allocated equally to all jobs that:
- the same patient-facing resource (either a staff member or a vehicle) responded to over a costing period (for example a month)
- have a recorded duration (from allocation) of at least one minute (60 seconds).
Jobs where the response does not arrive at the scene should also be allocated costs of non-responding time: for example, because the incident was dealt with via telephone advice as a ‘hear & treat’ and the response was cancelled, or because the response was cancelled for any other reason.
We appreciate this is not the most accurate approach to allocating non-responding time costs as other factors that have not been weighted for can cause variations in non-responding time, for example urban versus rural differences. Especially where resources cover both urban and rural areas, the cost of non-responding time waiting in a rural area may be allocated to jobs in an urban area covered by the same resource. However, allocating non-responding time to geographical area is not currently practical.
For each resource and activity combination, there is a prescribed allocation method in spreadsheet CP3.3.
Example of calculating non-responding time
Available information
Shift cost (vehicle and crew): £1,200
Table CM33.1a: Shift cost
|
Total shift time (hours) | |||||||||||
|
1 |
2 |
3 |
4 |
5 |
6 |
7 |
8 |
9 |
10 |
11 |
12 |
|
NR |
Job1 |
NR |
Job2 |
NR |
Job 3 |
NR |
Job 4 | ||||
|
Area 1 |
Area 1 |
Area 1 |
Area 2 | ||||||||
NR: non-responding time.
Allocation of non-responding time and costs
Total non-responding time costs (5 hours): £500
Equally allocated to jobs (four in shift): £125
Table CM33.1b: Allocating non-responding time cost to jobs
|
Allocating non-responding time cost to jobs | ||
|
Job 1 |
Job cycle cost |
£100 |
|
Non-responding time |
£125 | |
|
Total |
£225 | |
|
Job 2 |
Job cycle cost |
£100 |
|
Non-responding time |
£125 | |
|
Total |
£225 | |
|
Job 3 |
Job cycle cost |
£200 |
|
Non-responding time |
£125 | |
|
Total |
£325 | |
|
Job 4 |
Job cycle cost |
£300 |
|
Non-responding time |
£125 | |
|
Total |
£425 | |