
Section one – scoring metrics
These metrics contribute to the overall segmentation of organisations, providers will receive scores for each of these metrics if they report the data unless there is specific exclusion criteria noted in the specification.
1. Access to services
Elective care
OF0023 – Percentage of cases where a patient is waiting 18 weeks or less for elective treatment
| ID | OF0023 |
| Status | Scored – MHS |
| Metric Name | Percentage of cases where a patient is waiting 18 weeks or less for elective treatment |
| Granularity | Acute trusts |
| Basis | Latest month in the period |
| Description | Of the total elective (RTT) waiting list, the percentage of patients who have been waiting less than 18 weeks. |
| Purpose | This allows absolute 18 week performance to be tracked to allow for direct performance comparisons. |
| Published source | Statistics » Referral to Treatment (RTT) Waiting Times |
| Metric methodology | Numerator: Count of patients on the waiting list for less than 18 weeks Denominator: Total count of patients on the waiting list. Calculation: Numerator as a percentage of denominator Filters and exclusions: 1. Patients whose care is commissioned by non-English commissioner are excluded. 2. Cancer specialist trusts and non-acute providers are excluded |
| Scoring methodology | Organisations are scored between 1.00 and 4.00 based on absolute % value ranked high to low (higher is better) |
OF0106 – Difference between planned and actual 18 week performance
| ID | OF0106 |
| Status | Scored – manual |
| Metric Name | Difference between planned and actual 18 week performance |
| Granularity | Acute trusts |
| Basis | Latest month in the period |
| Description | The percentage point difference between planned and actual 18 week elective performance |
| Purpose | Delivering the NHS ambitions on waiting list reduction requires all trusts to deliver their individual target levels of reduction, this metric enables visibility of those off track against their plan |
| Published source | NHS England does not currently publish operational plan data, this metric is based on internal management information and published 18 week performance |
| Metric methodology | Numerator: Percentage of patients currently waiting no longer than 18 weeks Denominator: Percentage of patients planned to wait no longer than 18 weeks Calculation: Percentage point difference between numerator and denominator. Filters and exclusions: 1. Patients whose care is commissioned by non-English commissioner are excluded. 2. Cancer specialist trusts and non-acute providers are excluded |
| Scoring methodology | All organisations at or above planned level (i.e. 0% or higher) score 1.00, remainder scored between 2.00 and 4.00 based on % distance from plan (closer to plan is better) |
OF0003 – Percentage of cases where a patient is waiting more than 52 weeks for elective treatment
| ID | OF0003 |
| Status | Scored – MHS |
| Metric Name | Percentage of cases where a patient is waiting more than 52 weeks for elective treatment |
| Granularity | Acute trusts |
| Basis | Latest month in the period |
| Description | Of the total elective (RTT) waiting list, the percentage of patients who have been waiting more than 52 weeks. |
| Purpose | This metric allows us to track delivery of the 2025/26 priority to reduce 52 week waits to below 1%. |
| Published source | Statistics » Referral to Treatment (RTT) Waiting Times |
| Metric methodology | Numerator: Count of patients on the waiting list for more than 52 weeks Denominator: Total count of patients on the waiting list Calculation: Numerator as a percentage of denominator Filters and exclusions: 1. Patients whose care is commissioned by non-English commissioner are excluded. 2. Cancer specialist trusts and non-acute providers are excluded |
| Scoring methodology | All organisations below the 1% target level receive a score of 1.00. Those at or above 1% are scored between 2.00 – 4.00 based on absolute % value ranked low to high (lower is better) |
OF0005 – Percentage of patients waiting over 52 weeks for community services
| ID | OF0005 |
| Status | Scored – UDAL |
| Metric Name | Percentage of patients waiting over 52 weeks for community services |
| Granularity | Community, integrated and acute trusts |
| Basis | End of period |
| Description | Of the total community health waiting list, the number of patients who have been waiting more than 52 weeks. |
| Purpose | This captures issues with clearing the longest waiting patients from the community services waiting list. |
| Published source | Statistics » Community health services waiting lists |
| Metric methodology | Numerator: Count of patients on the waiting list for more than 52 weeks Denominator: Total count of patients on the waiting list Calculation: Numerator as a percentage of denominator Filters and exclusions: 1. Patients whose care is commissioned by non-English commissioner are excluded. 2. Any trust submitting data to the dataset is included regardless of type |
| Scoring methodology | Organisations scored between 1.00 and 4.00 based on absolute % ranked high to low (lower is better) |
Cancer care
OF0010 – Percentage of urgent referrals to receive a definitive diagnosis within 4 weeks.
| ID | OF0010 |
| Status | Scored – UDAL |
| Metric Name | Percentage of referrals to receive a definitive diagnosis within 4 weeks |
| Granularity | Acute trusts |
| Basis | Aggregated quarterly position |
| Description | Percentage of patients receiving a communication of diagnosis for cancer or a ruling out of cancer, or a decision to treat (FDS clock stops) within 28 days following an urgent cancer referral. |
| Purpose | This measures the percentage of patients seen in a timely way following urgent cancer referral. |
| Published source | Statistics » Monthly Data and Summaries |
| Metric methodology | Numerator: Total number of patients told their diagnosis within 28 days in the period Denominator: Total number of patients told their diagnosis in the period Calculation: Numerator as a percentage of denominator Filters and exclusions: 1. Patients whose care is commissioned by non-English commissioner are excluded. 2. Specialist acute and non-acute trusts are excluded |
| Scoring methodology | All organisations meeting or exceeding target of 80% score 1.00. Remainder ranked from 2.00 – 4.00 based on absolute % (higher is better) |
OF0011 – Percentage of patients treated for cancer within 62 days of referral
| ID | OF0011 |
| Status | Scored – UDAL |
| Metric Name | Percentage of patients treated for cancer within 62 days of referral |
| Granularity | Acute trusts |
| Basis | Aggregated quarterly position |
| Description | Percentage of patients receiving a first treatment for cancer within 62 days following an urgent referral. |
| Purpose | This measures the percentage of patients beginning treatment in a timely way following urgent cancer referral. |
| Published source | Statistics » Monthly Data and Summaries |
| Metric methodology | Numerator: Total number of patients treated in the period within the 62 day standard Denominator: Total number of patients treated in the period Calculation: Numerator as a percentage of denominator Filters and exclusions: 1. Patients whose care is commissioned by non-English commissioner are excluded. 2. Specialist acute and non-acute trusts are excluded |
| Scoring methodology | All organisations meeting or exceeding the target of 75% score 1.00. Remainder ranked from 2.00 – 4.00 based on absolute % (higher is better) |
Urgent and emergency care
OF0013 – Percentage of emergency department attendances admitted, transferred or discharged within four hours
| ID | OF0013 |
| Status | Scored – UDAL |
| Metric name | Percentage of emergency department attendances admitted, transferred or discharged within four hours |
| Granularity | Acute trusts |
| Basis | Aggregated quarterly position |
| Description | Percentage of emergency department attendances managed within 4 hours |
| Purpose | This measures performance against the NHS constitutional pledge and is a key metric for showing pressure on the urgent and emergency care system. There are a range of different mechanisms of delivering urgent care, we have taken performance figures at an acute trust footprint level which apportions some or all of the lower acuity activity from surrounding type 3 providers to acute trusts. This enables performance to consider redirection of lower acuity patients to a more appropriate setting. |
| Published source | Statistics » A&E Attendances and Emergency Admissions |
| Metric methodology | Numerator: Number of attendances where the patient was admitted, discharged or transferred within four hours of arrival. Denominator: Total number of attendances at all type A&E departments (acute footprint basis). Calculation: Numerator as a percentage of denominator. Filters and exclusions: 1. Patients whose care is commissioned by non-English commissioner are excluded. 2. Non-acute trusts are excluded. |
| Scoring methodology | All organisations meeting or exceeding the objective of 78% score 1.00. Remainder ranked from 2.00 – 4.00 based on absolute % (higher is better). |
OF0014 – Percentage of emergency department attendances spending over 12 hours in the department
| ID | OF0014 |
| Status | Scored – UDAL |
| Metric Name | Percentage of emergency department attendances spending over 12 hours in the department |
| Granularity | Acute trusts |
| Basis | Aggregated quarterly position |
| Description | Percentage of patients attending A&E who are not admitted, discharged or transferred within 12 hours of arrival. |
| Purpose | This measures the longest stays in A&E departments, limited to department type 1 and 2. |
| Published source | Statistics » A&E Attendances and Emergency Admissions The supplementary ECDS analysis file contains this information. To note published data applies data suppression to small numbers and so there may be some small differences between the position calculated from public data and the value displayed within NOF reporting products. |
| Metric methodology | Numerator: Number of attendances in the reporting period where the patient spent more than 12 hours in the department. Denominator: Total number of attendances in the reporting period. Calculation: Numerator as a percentage of denominator. Filters and exclusions: 1. Urgent Treatment Centre activity is excluded. 2. Patients whose care is commissioned by non-English commissioner are excluded. 3. Non-acute trusts are excluded. |
| Scoring methodology | Organisations scored between 1.00 and 4.00 based on % over 12 hours ranked high to low (Lower is better) |
OF0017 – Average Category 2 ambulance response time
| ID | OF0017 |
| Status | Scored – Manual |
| Metric Name | Average Category 2 ambulance response time |
| Granularity | Ambulance trusts |
| Basis | Year to date |
| Description | Mean time from 999 call until the ambulance arrives on scene. |
| Purpose | The NHS Objectives and Planning Guidance for 2025/26 set out that all ambulance trusts should respond to category two calls within an average of 30 minutes. This metric tracks delivery of that objective. |
| Published source | Statistics » Ambulance Quality Indicators Annual timeseries data is used to track year-to-date performance not single monthly data due to seasonal effects |
| Metric methodology | Numerator: Total response time for category 2 incidents Denominator: Category 2 incident count Calculation: Numerator divided by denominator presented in HH:MM:SS format Filters and Exclusions: Non-English ambulance services are excluded |
| Scoring methodology | All organisations meeting the objective of <00:30:01 score 1.00. Remainder ranked from 2.00 – 4.00 based on actual minutes (Lower is better) |
Mental health care
OF0041 – Annual change in the number of children and young people accessing NHS-funded MH services
| ID | OF0041 |
| Status | Scored – manual |
| Metric Name | Annual change in the number of children and young people accessing NHS-funded MH services |
| Granularity | Mental health trusts |
| Basis | 12-month rolling, year-on-year comparison |
| Description | The percentage change in number of people under the age of 18 who have had at least one contact from NHS funded mental health services vs previous year. This metric only counts a unique patient once. If a patient has multiple referrals in the 12-month period with 1+ contacts recorded, they would only be counted once in the access metric. |
| Purpose | The NHS priorities for 2025/26 specified an objective to increase the numbers of children and young people accessing services, this metric identifies how far each organisation is increasing levels of access. |
| Published source | Mental Health Services Monthly Statistics – NHS England Digital, measure MHS95 |
| Metric methodology | Numerator: Number of CYP aged under 18 supported through NHS funded mental health with at least one contact in a rolling 12 month period. Denominator: as above, for the preceding 12 month period. Calculation: Percentage point difference between numerator and denominator. Filters and exclusions: Included – direct contact with a patient, parent or carer (as a patient proxy) or between professionals (as indirect activity), as long as they are clinically meaningful. Excluded – 05 – Email; 09 – Text Message (Asynchronous); 10 – Instant messaging (Synchronous); 12 – Message Board (Asynchronous); 13 – Chat Room (Synchronous); 98 – Other (not listed). |
| Scoring methodology | Organisations scored between 1.00 and 4.00 based on % change ranked high to low (Higher is better) |
2. Effectiveness and experience
Patient Experience
OF1046 – Summary Hospital Level Mortality Indicator
| ID | OF1046 |
| Status | Scored – MHS |
| Metric Name | Summary Hospital Level Mortality Indicator |
| Granularity | Acute trusts |
| Basis | Rolling 12-month |
| Description | The SHMI is the ratio between the actual number of patients who die following hospitalisation at the trust and the number that would be expected to die on the basis of average England figures, given the characteristics of the patients treated there. |
| Purpose | This is to monitor the ratio between the actual number of patients who die following hospitalisation at the trust and the number that would be expected to die on the basis of average England figures, given the characteristics of the patients treated there. It covers all deaths reported of patients who were admitted to non-specialist acute trusts in England and died either while in hospital or within 30 days of discharge. Bandings indicating whether the SHMI is ‘higher than expected’, ‘as expected’ or ‘lower than expected’ are also provided. |
| Published source | Summary Hospital-level Mortality Indicator (SHMI) – Deaths associated with hospitalisation – NHS England Digital |
| Metric methodology | Indicator specification: Summary Hospital-level Mortality Indicator (SHMI) |
| Scoring methodology | Score is based on SHMI band (1.00 = better than expected, 2.00 = as expected, 3.00 = worse than expected) |
OF1069 – CQC inpatient survey satisfaction rate
| ID | OF1069 |
| Status | Scored – manual |
| Metric Name | CQC inpatient survey satisfaction rate |
| Granularity | Acute trusts |
| Basis | Annual |
| Description | The banded score relating to inpatient satisfaction for each trust |
| Purpose | Patient experience is a critical element of the quality of care provided by the NHS. This metric enables an objective independent view of the level of satisfaction inpatients at each trust experienced. |
| Published source | Surveys – Care Quality Commission |
| Metric methodology | 20240821_aip23_QualityMethodology.odt Banded score for section 11 – overall experience |
| Scoring methodology | Proprietary CQC methodology, each org receives a band which we translate to a score (1.00 = better or much better than expected, 2.00 = somewhat better than expected or as expected, 3.00 = somewhat worse than expected, 4.00 = worse or much worse than expected) |
OF1035 – CQC community mental health survey satisfaction rate
| ID | OF1035 |
| Status | Scored – manual |
| Metric Name | CQC community mental health survey satisfaction rate |
| Granularity | Mental health trusts and integrated trusts |
| Basis | Annual |
| Description | The banded score relating to satisfaction of patients who use community mental health services for each trust |
| Purpose | Patient experience is a critical element of the quality of care provided by the NHS. This metric enables an objective independent view of the level of satisfaction patients at each trust experienced. |
| Published source | Surveys – Care Quality Commission |
| Metric methodology | https://www.cqc.org.uk/sites/default/files/2025-04/20250403_cmh24_QualityMethodology.odt Banded score for section 12 – overall experience |
| Scoring methodology | Proprietary CQC methodology, each org receives a band which we translate to a score (1.00 = better or much better than expected, 2.00 = somewhat better than expected or as expected, 3.00 = somewhat worse than expected, 4.00 = worse or much worse than expected) |
OF1047 – NHS staff survey advocacy score
| ID | OF1047 |
| Status | Scored – UDAL |
| Metric Name | NHS staff survey advocacy score |
| Granularity | Ambulance trusts |
| Basis | Annual |
| Description | The combined staff survey scores covering the percentage of staff who say that care of patients is their organisation’s top priority, the percentage of staff who would recommend the organisation as a place to work and the percentage who would be happy with the standard of care their organisation provides if a friend or relative needed treatment. |
| Purpose | Patient experience is a critical element of the quality of care provided by the NHS, as ambulance patients are not surveyed as part of national surveys, this measure is designed to allow an understanding of the quality of service ambulance trusts provide based on the views of their own staff. |
| Published source | National results across the NHS in England | NHS Staff Survey |
| Metric methodology | Advocacy sub-score Weighted score (out of 10) based on responses to these questions: Q25a – “Care of patients / service users is my organisation’s top priority.” Q25c – “I would recommend my organisation as a place to work.” Q25d – “If a friend or relative needed treatment I would be happy with the standard of care provided by this organisation.” |
| Scoring methodology | Organisations scored between 1.00 and 4.00 based on score ranked high to low (Higher is better) |
Effective flow and discharge
OF0025 – Average number of days from discharge ready date to actual discharge date (including zero days)
| ID | OF0025 |
| Status | Scored – UDAL |
| Metric Name | Average number of days from discharge ready date to actual discharge date (including zero days) |
| Granularity | ICBs and Acute trusts |
| Basis | Latest month in the period |
| Description | The average delay to discharge, from when the patient is ready for discharge to the date of discharge. |
| Purpose | This measures the extent of delays experienced by patients who are medically ready for discharge but are not able to be discharged from hospital. |
| Published source | Statistics » Discharge ready date |
| Metric methodology | Numerator: The total aggregate number of days from discharge ready date to date of discharge for all patients discharged in the period Denominator: The total number of patients that have been discharged in the period Calculation: Numerator divided by denominator presented as a number of days Note: Where the provider reports that all their discharges are on discharge ready date, i.e. the denominator is zero, the denominator is set to the total count of discharges to allow a metric value to be calculated. |
| Scoring methodology | Trusts scored between 1.00 and 4.00 based on average number of days high to low (Lower is better) ICBs are not scored in 2025/26 |
OF0063 – Percentage of inpatients with >60 day length of stay
| ID | OF0063 |
| Status | Scored – Manual |
| Metric Name | Percentage of inpatients aged 18-65 with >60 day length of stay |
| Granularity | Mental health trusts |
| Basis | Average for latest quarter |
| Description | Percentage of adult inpatients (between the ages of 18 and 65) with a length of stay over 60 days at discharge |
| Purpose | The NHS priorities for 2025/26 specified an objective to reduce length of stay for mental health patients, This metric is used to track volumes of patients being discharged with long lengths of stay. |
| Published source | Mental Health Services Monthly Statistics – NHS England Digital, Metric IDs: MHS140, MHS100, and MHS100b |
| Metric methodology | Numerator: of the denominator, discharges from adult acute beds with a length of stay over 60 days Denominator: The number of people discharged in the reporting period where bed type at the time of discharge was an adult acute bed and the person was aged between 18 and 64. Calculation: Numerator as a percentage of denominator |
| Scoring methodology | Organisations scored between 1.00 and 4.00 based on % of delayed patients ranked high to low (Lower is better) |
Effective out of hospital care
OF0057 – Urgent Community Response 2-hour performance
| ID | OF0057 |
| Status | Scored – MHS |
| Metric Name | Urgent Community Response 2-hour performance |
| Granularity | Community trusts and acute trusts who provide community services |
| Basis | Quarterly aggregated figure |
| Description | Percentage of standard urgent community response referrals seen within 2 hours. |
| Purpose | The Secretary of State set out three shifts required in healthcare one of which is the need to move care from acute settings to the community. Urgent Community Response services are a vital part of preventing avoidable attendance in acute settings and this metric enables us to identify those most effectively providing these services. |
| Published source | Community Services Statistics – NHS England Digital |
| Metric methodology | Numerator: Number of referrals in the period that had a Referral to Treatment waiting time of under 120 minutes. Denominator: Number of standard urgent community response referrals received in the period. Calculation: Numerator as a percentage of denominator |
| Scoring methodology | All Organisations <70% score 4.00. Remainder ranked from 1.00 – 3.00 based on absolute % (Higher is better) |
OF0028 – Percentage of ambulance patients conveyed to emergency departments
| ID | OF0028 |
| Status | Scored – Manual |
| Metric Name | Percentage of ambulance patients conveyed to emergency departments |
| Granularity | Ambulance trusts |
| Basis | Year to date |
| Description | The percentage of incidents where an ambulance is dispatched which result in conveyance to an emergency department |
| Purpose | The NHS is committed to moving more care into the community and reducing reliance on hospital care, this measure allows us to understand how much ambulance activity results in a trip to an emergency department, improved community and integrated urgent care services should result in reduced need to convey to emergency departments |
| Published source | Statistics » Ambulance Quality Indicators Year to date count |
| Metric methodology | Numerator: The count of incidents that resulted in a conveyance to an Emergency Department Denominator: The total count of incidents Calculation: Numerator as a percentage of denominator |
| Scoring methodology | Organisations scored between 1.00 and 4.00 based on % of patients conveyed to ED low to high (Lower is better) |
3. Patient safety
OF0061 – NHS Staff survey – raising concerns sub-score
| ID | OF0061 |
| Status | Scored – MHS |
| Metric Name | NHS Staff survey – raising concerns sub- score |
| Granularity | All organisations |
| Basis | Annual |
| Description | NHS staff survey “raising concerns” sub-score |
| Purpose | This is a primary measure of organisational safety culture and set out as a key metric in the NHS Safety Strategy, organisations with safer culture are recognised by their staff as being places where concerns can be raised |
| Metric methodology | NHS staff survey sub score for the following measures: Q20a – I would feel secure raising concerns about unsafe clinical practice Q20b – I am confident that my organisation would address my concern Q25e – I feel safe to speak up about anything that concerns me in this organisation Q25f – If I spoke up about something that concerned me I am confident my organisation would address my concern For further details see Section 3.1 of NHS Staff Survey Technical Guide |
| Published source | Local results for every organisation | NHS Staff Survey |
| Scoring methodology | Organisations scored between 1.00 and 4.00 based on % positive responses ranked high to low (Higher is better). Note: Organisations are ranked within their organisation type staff survey benchmark group, e.g. ambulance trusts against other ambulance trusts, acute against other acutes etc. |
OF1067 – CQC safe inspection score
| ID | OF1067 |
| Status | Scored – Manual |
| Metric Name | CQC safe inspection score |
| Granularity | All trusts |
| Basis | Periodic inspection |
| Description | The CQC rating is based on a physical inspection, with possible ratings of outstanding, good, requires improvement or inadequate. |
| Purpose | Comprehensive CQC inspections of health and social care services are carried out to make sure services are providing care that is safe, caring, effective, responsive to people’s needs and well-led. In order to ensure that organisational scores are not impacted by historic ratings this measure is only applied where it is less than two years old. |
| Published source | Using CQC data – Care Quality Commission |
| Metric methodology | CQC safe rating – possible ratings are Outstanding, Good, Requires Improvement and Inadequate Note: If the organisation has not been awarded a CQC rating within the last 24 months the organisation is excluded |
| Scoring methodology | CQC rating translated to a score (1.00 = outstanding, 2.00 = good, 3.00 = requires improvement, 4.00 = inadequate) |
OF0020 – Number of MRSA infections
| ID | OF0020 |
| Status | Scored – Manual |
| Metric Name | Number of MRSA infections |
| Granularity | Acute trusts |
| Basis | 12-month rolling |
| Description | 12-month rolling counts of methicillin resistant staphylococcus aureus (MRSA) bacteraemia by organisation and location of onset |
| Purpose | HCAIs pose a serious risk to patients, clients, staff and visitors to health and social care premises. They can incur significant costs for the NHS and others and cause significant morbidity and mortality for those infected. As a result, infection prevention and control is a key priority for the NHS. |
| Published source | For 12-month rolling count values: UK Health Security Agency (UKHSA) published data MRSA bacteraemia: monthly data by location of onset – GOV.UK |
| Metric methodology | Numerator: Number of MRSA bacteraemia Trust apportioned cases (In the published data files, filter ‘Organisation type’ by ‘NHS acute trust’ and ‘Metric’ by ‘Hospital-onset healthcare-associated’ AND ‘Community-onset healthcare-associated’). Note: The six prior healthcare exposure groups for C. difficile are Hospital-onset healthcare-associated (HOHA), Community-onset healthcare-associated (COHA), Community-onset indeterminate-association (COIA), Community-onset community-associated (COCA), Unknown and No information. HOHA and COHA are the only prior healthcare exposure groups included in the numerator. Denominator: The metric for MRSA does not have a denominator. This is because the NHS Standard Contract specifies that the threshold is zero for all trusts. |
| Scoring methodology | All organisations with no cases of MRSA receive a score of 1.00, remaining organisations are scored between 2.00 and 4.00 based on absolute number of cases, lower is better |
OF0088 – Rate of C-Difficile infections
| ID | OF0088 |
| Status | Scored – Manual |
| Metric Name | Rate of C-Difficile infections |
| Granularity | Acute trusts |
| Basis | 12-month rolling |
| Description | 12-month rolling counts of Clostridioides difficile (C. difficile) infections by NHS organisation and prior trust exposure (from April 2019) in patients aged 2 years and over. |
| Purpose | HCAIs pose a serious risk to patients, clients, staff and visitors to health and social care premises. They can incur significant costs for the NHS and others and cause significant morbidity and mortality for those infected. As a result, infection prevention and control is a key priority for the NHS. |
| Published source | Rates: C. difficile infection (CDI): monthly data by prior trust exposure – GOV.UK Thresholds: NHS England » Minimising Clostridioides difficile and Gram-negative Bloodstream Infections |
| Metric methodology | Numerator: Number of incidences of Clostridium difficile Trust apportioned cases. In the published data files, filter ‘Organisation type’ by ‘NHS acute trust’ and ‘Metric’ by ‘Hospital-onset healthcare-associated’ AND ‘Community-onset healthcare-associated’. This metric uses the new counting methodology of Hospital-onset healthcare-associated (HOHA) + Community-onset healthcare-associated (COHA) The six prior healthcare exposure groups for C. difficile are Hospital-onset healthcare-associated (HOHA), Community-onset healthcare-associated (COHA), Community-onset indeterminate-association (COIA), Community-onset community-associated (COCA), Unknown and No information. HOHA and COHA are the only prior healthcare exposure groups included in the numerator. Denominator: Threshold for 12 months (published annual NHS Standard Contract Threshold for the relevant year for the data submission). Calculation: Numerator divided by denominator Note: for a small number of organisations the threshold value is 0 so cannot be calculated as a percentage and the actual number of cases will be shown. |
| Scoring methodology | Where the organisation has a value at or below 100% (at or beneath threshold level) a score of 1.00 is awarded. For those organisations over 100% a score between 2.00 and 4.00 is awarded based on distance from threshold, lower is better Note: for a small number of organisations the threshold value is 0 so cannot be calculated as a percentage. For these organisations a score is determined by the absolute number of cases as follows: 0 cases = 1.00, 1 case = 2.00, 2 cases = 3.00, >2 cases = 4.00 |
OF0048 – Rate of E-Coli infections
| ID | OF0048 |
| Status | Scored – Manual |
| Metric Name | Rate of E-Coli infections |
| Granularity | Acute trusts |
| Basis | 12-month rolling |
| Description | 12-month rolling counts of Escherichia coli (E.coli) bacteraemia by organisation and location of onset |
| Purpose | HCAIs pose a serious risk to patients, clients, staff and visitors to health and social care premises. They can incur significant costs for the NHS and others and cause significant morbidity and mortality for those infected. As a result, infection prevention and control is a key priority for the NHS. |
| Published source | Rates: E. coli bacteraemia: monthly data by location of onset – GOV.UK Thresholds: NHS England » Minimising Clostridioides difficile and Gram-negative Bloodstream Infections |
| Metric methodology | Numerator: Number of E.coli Trust apportioned cases. In the published data files, filter ‘Organisation type’ by ‘NHS acute trust’ and ‘Metric’ by ‘Hospital-onset healthcare-associated’ AND ‘Community-onset healthcare-associated’. This metric uses the new counting methodology of Hospital-onset healthcare-associated (HOHA) + Community-onset healthcare-associated (COHA). The six prior healthcare exposure groups for C. difficile are Hospital-onset healthcare-associated (HOHA), Community-onset healthcare-associated (COHA), Community-onset indeterminate-association (COIA), Community-onset community-associated (COCA), Unknown and No information. HOHA and COHA are the only prior healthcare exposure groups included in the numerator. Denominator: Threshold for 12 months (published annual NHS Standard Contract Threshold for the relevant year for the data submission) Calculation: Numerator divided by denominator Note: for a small number of organisations the threshold value is 0 so cannot be calculated as a percentage. For these organisations the actual number of cases will be displayed. |
| Scoring methodology | Where the organisation has a value at or below 100% (at or beneath threshold level) a score of 1.00 is awarded. For those organisations over 100% a score between 2.00 and 4.00 is awarded based on distance from threshold, lower is better. Note: for a small number of organisations the threshold value is 0 so cannot be calculated as a percentage. For these organisations a score is determined by the absolute number of cases – 0 cases = 1.00, 1 case = 2.00, 2 cases = 3.00, >2 cases = 4.00 |
OF0068 – Rate of restrictive interventions use
| ID | OF0068 |
| Status | Scored – Manual |
| Metric Name | Rate of restrictive interventions use |
| Granularity | Mental health trusts |
| Basis | Quarterly |
| Description | Rate of restrictive interventions per 1,000 inpatient mental health, learning disability and autism bed days |
| Purpose | To identify rates of restrictive interventions and support reduction of restrictive practices in inpatient services and ensure compliance with the reporting requirements within the Use of Force Act 2018. |
| Published source | Mental Health Services Monthly Statistics – NHS England Digital MHS96 Restrictive practice rate |
| Metric methodology | Numerator: Aggregate number of restrictive interventions occurring in the reporting period Denominator: Aggregate number of occupied bed days occurring in the reporting period Calculation: Numerator divided by denominator multiplied by 1000 to express as a rate per 1000 bed days. |
| Scoring methodology | Organisations scored between 1.00 and 4.00 based on crude rate ranked high to low (Lower is better) |
OF0016 – Percentage of patients in mental health crisis to receive face-to-face contact within 24 hours
| ID | OF0016 |
| Status | Scored – Manual |
| Metric Name | Percentage of patients in mental health crisis to receive face-to-face contact within 24 hours |
| Granularity | Mental health trusts |
| Basis | Quarterly |
| Description | Percentage of new urgent referrals to crisis services with first face to face contact within 24 hours of referral |
| Purpose | The urgent and emergency care recovery strategy articulated that A&E is rarely the best place for a patient in crisis and timely access to crisis mental health services is critical for individuals experiencing acute distress. The measure will enable identification of those organisations delivering high levels of face to face crisis care in a timely manner. |
| Published source | Mental Health Services Monthly Statistics – NHS England Digital, Metric IDs: CCR120 (numerator) and CCR73 (denominator) |
| Metric methodology | Numerator: New Urgent Referrals to Crisis Services with first face to face contact within 24 hours of referral in the period Denominator: New Urgent Referrals to Crisis Services with first face to face contact in the period Calculation: Numerator as a percentage of denominator Filters: • The Service or Team Type Referred To (Mental Health) is either A02, A18, A19 • Where the Clinical Response Priority Type is 2 (urgent) • Where the Attended Or Did Not Attend is 5 or 6 and the Consultation Medium Used is face to face communication. |
| Scoring methodology | Organisations scored between 1.00 and 4.00 based on absolute % ranked high to low (Higher is better) |
4. People and workforce
Retention and culture
OF0082 – Sickness absence rate
| ID | OF0082 |
| Status | Scored – UDAL |
| Metric Name | Sickness absence rate |
| Granularity | ICBs and all trusts |
| Basis | Quarterly – aggregated monthly figures |
| Description | The percentage of working days in the previous quarter where staff are sick and unable to work |
| Purpose | Improving retention was a key priority of the Long Term NHS Workforce Plan which focussed on a need to improve staff wellbeing and motivation. Lower rates of sickness could indicate organisations with healthier and more motivated workforces improving skills and outcomes and reducing reliance on temporary staffing. |
| Published source | NHS Sickness Absence Rates – NHS England Digital |
| Metric methodology | Numerator: FTE number of days sick (including non-working days) in the period Denominator: FTE number of days available in the period Calculation: Numerator as a percentage of denominator Filters: Status in ‘Acting Up, Active Assignment, Internal Secondment’ Exclusions: Exclude type of Contract: Bank, Honorary, Widow/Widower |
| Scoring methodology | Organisations scored between 1.00 and 4.00 based on 3 month rolling rate of sickness ranked high to low (Lower is better) Note: ICBs are not scored in 2025/26 |
OF0084 – NHS Staff survey engagement theme sub-score
| ID | OF0084 |
| Status | Scored – Manual |
| Metric Name | NHS Staff survey engagement theme sub-score |
| Granularity | ICBs and all trusts |
| Basis | Annual |
| Description | The NHS Staff Survey Staff engagement theme sub-score. |
| Purpose | The engagement theme score of the staff survey is a recognised barometer of overall staff engagement with their organisation and thus a headline indicator of how effectively organisations are managing their people. |
| Published source | Local results for every organisation | NHS Staff Survey |
| Metric methodology | Composition: This score is comprised of 3 individual sub-scores covering motivation, involvement and advocacy, aggregated to an overall score. Each sub-score is comprised of a number of questions which are scored on a 0-10 scale and reported as a mean score. A higher score indicates a more favourable result. Specific variable ID: theme_engagement_2024 |
| Scoring methodology | Organisations scored between 1.00 and 4.00 based on % positive responses ranked high to low (Higher is better). Note that organisations are ranked within their organisation type, e.g. ambulance trusts against other ambulance trusts, acute against other acutes etc. Note: ICBs are not scored in 20256/26 |
5. Finance and productivity
Finance
OF0076 / OF0079 – Planned surplus/deficit
|
ID |
OF0076 / OF0079 |
|
Status |
Scored – Manual |
|
Metric Name |
Planned surplus/deficit |
|
Granularity |
ICBs and all trusts |
|
Basis |
Annual plan |
|
Description |
The overall level of planned surplus/deficit of the organisation for the financial year once deficit support funding has been removed |
|
Purpose |
It is essential that all NHS organisations return to financial balance in 2025/26, this measure allows us to understand those who do not currently have a plan to achieve break-even or surplus |
|
Published source |
This information is not currently published and is based on annual financial plan returns |
|
Metric methodology | Numerator: Planned Surplus / Deficit excluding deficit support funding Denominator: Turnover (trusts) or Allocation (ICBs) minus deficit support funding |
|
Scoring methodology | Scored based on planned level of surplus / deficit (1.00 = 0% or surplus, 2.00 = below 0% and above -1%, 3.00 = between -1% and -2%, 4.00 = beyond -2%)Note: ICBs are not scored in 2025/26 |
OF0078 / OF0081 – Variance year-to-date to financial plan
|
ID |
OF0078 / OF0081 |
|
Status |
Scored – Manual |
|
Metric Name |
Variance year-to-date to financial plan |
|
Granularity |
ICBs and all trusts |
|
Basis |
Year to date |
|
Description |
The variance between the year to date planned surplus/deficit and the year to date actual surplus/deficit |
|
Purpose |
It is essential that all NHS organisations return to financial balance in 2025/26, this measure allows us to understand each organisation’s variance from their financial plan |
|
Published source |
This information is not currently published and is based on monthly financial returns |
|
Metric methodology | Numerator: Year to date (YTD) variance – YTD actual surplus/deficit less YTD planned surplus/deficit Denominator: YTD Turnover (trusts) or YTD Allocation (ICBs) |
|
Scoring methodology | Score based on variation from plan (1.00 = on plan or better, 2.00 = below 0.5% adverse variance, 3.00 = between 0.5% and 1% adverse variance, 4.00 = beyond 1% adverse variance) Note: ICBs are not scored in 2025/26 |
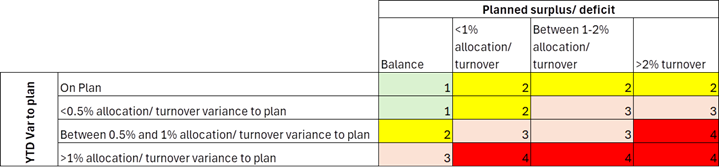
OF1080 – Combined finance score
| ID | OF1080 |
| Status | Scored – Manual |
| Metric Name | Combined finance score |
| Granularity | ICBs and all trusts |
| Basis | Year to date |
| Description | The combined financial position of the organisation taking into account both planned and actual position |
| Purpose | To give a balanced financial view of each organisation it is important that both the planned and actual position are considered together not in isolation to avoid, for example, an in year position above plan score cancelling out a planned deficit score. This metric takes the planned financial position score and the variance year-to-date score and plots them against each other to give an overall score |
| Published source | This information is not currently published and is based on monthly financial returns |
| Metric methodology | Measure one: Planned surplus deficit score (OF0076 / 0079) Measure two: Variance year-to-date score (OF0078 / 0081) Computation: The two measure scores are plotted on a sixteen box grid to give an overall score, see scoring methodology section for details |
| Scoring methodology | Note: ICBs are not scored in 2025/26 https://www.england.nhs.uk/wp-content/uploads/2025/09/scoring-methodology.png |
Productivity
OF0085 – Implied productivity level
| ID | OF0085 |
| Status | Scored – manual |
| Metric Name | Implied productivity level |
| Granularity | ICBs and acute trusts |
| Basis | In-year figure to latest month vs same period in previous year |
| Description | The change in implied productivity of an organisation compared with a baseline period |
| Purpose | NHS Organisations have a responsibility to act responsibly with public funds; this measure allows us to understand for each organisation the extent to which they are potentially increasing productivity (activity is growing faster than costs) |
| Published source | Not currently published, will be published as an experimental statistic from September |
| Metric methodology | Numerator: Estimated growth in cost-weighted activity between the periods Denominator: Real terms spending growth between the periods Computation: Numerator divided by denominator presented as a % of the same calculation for the same period in the previous year |
| Scoring methodology | Organisations ranked from 1.00 – 4.00 based on % productivity increase (Higher is better) Note: ICBs are not scored in 2025/26 |
OF0086 – Relative difference in costs
| ID | OF0086 |
| Status | Scored – manual |
| Metric Name | Relative difference in costs |
| Granularity | Non-acute trusts |
| Basis | Annual |
| Description | National Cost Collection Index (Adjusted for Market Forces Factor) |
| Purpose | The National Cost Collection Index (NCCI) is a measure of the relative cost difference between NHS providers. This metric is an interim measure of productivity/efficiency until implied productivity figures are available at non-acute trust level |
| Published source | NHS England » National Cost Collection for the NHS |
| Metric methodology | Computation: Provider actual cost / provider expected cost * 100 See National Cost Collection Index (NCCI) calculation tab of NCCI dashboard for further details |
| Scoring methodology | Organisations scored between 1.00 and 4.00 based on comparative cost value ranked high to low (Lower is better). |
Section two – compound scoring
The scores in this section are not individual metrics but are how the individual scoring metrics laid out in section one are amalgamated to form overall scores.
6. Domain Scores
OF4000 – Access to services domain score
| ID | OF4000 |
| Status | Scored – MHS automated |
| Metric Name | Access to services domain score |
| Granularity | All trust types |
| Basis | Quarterly |
| Description | Average of all access to services metric scores |
| Purpose | This score is designed to allow users to see the average of all metric scores related to effectiveness and experience |
| Published source | Published NOF scores |
| Metric methodology | Numerator: Sum total of all metric scores in group one of section one for which the organisation has a value recorded Denominator: Count of all metrics in group one of section one for which the organisation has a value recorded |
| Scoring methodology | Numerator divided by denominator rounded to two decimal places |
OF4100 – Access to services domain segment
| ID | OF4100 |
| Status | Scored – MHS automated |
| Metric Name | Access to services domain segment |
| Granularity | All trust types |
| Basis | Quarterly |
| Description | The domain average score, placed into quartiles |
| Purpose | This score is designed to allow users to see overall NOF score for the domain |
| Published source | Published NOF scores |
| Metric methodology | All organisations domain average scores are divided into quartiles. 1 – Up to and including the 25th percentile 2 – Up to and including the 50th percentile 3 – Up to and including the 75th percentile 4 – Up to and including the 100th percentile |
| Scoring methodology | As above |
OF4005 – Effectiveness and experience domain score
| ID | OF4005 |
| Status | Scored – MHS automated |
| Metric Name | Effectiveness and experience domain score |
| Granularity | All trust types |
| Basis | Quarterly |
| Description | Average of all effectiveness and experience metric scores |
| Purpose | This score is designed to allow users to see the average of all metric scores related to effectiveness and experience |
| Published source | Published NOF scores |
| Metric methodology | Numerator: Sum total of all metric scores in group two of section one for which the organisation has a value recorded Denominator: Count of all metrics in group two of section one for which the organisation has a value recorded |
| Scoring methodology | Numerator divided by denominator rounded to two decimal places |
OF4105 – Effectiveness and experience domain segment
| ID | OF4105 |
| Status | Scored – MHS automated |
| Metric Name | Effectiveness and experience domain segment |
| Granularity | All trust types |
| Basis | Quarterly |
| Description | The domain average score, placed into quartiles |
| Purpose | This score is designed to allow users to see overall NOF score for the domain |
| Published source | Published NOF scores |
| Metric methodology | All organisations domain average scores are divided into quartiles. 1 – Up to and including the 25th percentile 2 – Up to and including the 50th percentile 3 – Up to and including the 75th percentile 4 – Up to and including the 100th percentile |
| Scoring methodology | As above |
OF4002 – Patient safety domain score
| ID | OF4002 |
| Status | Scored – MHS automated |
| Metric Name | Patient safety domain score |
| Granularity | All trust types |
| Basis | Quarterly |
| Description | Average of all patient safety metric scores |
| Purpose | This score is designed to allow users to see the average of all metric scores related to patient safety |
| Published source | Published NOF scores |
| Metric methodology | Numerator: Sum total of all metric scores in group three of section one for which the organisation has a value recorded Denominator: Count of all metrics in group three of section one for which the organisation has a value recorded |
| Scoring methodology | Numerator divided by denominator rounded to two decimal places |
OF4102 – Patient safety domain segment
| ID | OF4102 |
| Status | Scored – MHS automated |
| Metric Name | Patient safety domain segment |
| Granularity | All trust types |
| Basis | Quarterly |
| Description | The domain average score, placed into quartiles |
| Purpose | This score is designed to allow users to see overall NOF score for the domain |
| Published source | Published NOF scores |
| Metric methodology | All organisations domain average scores are divided into quartiles. 1 – Up to and including the 25th percentile 2 – Up to and including the 50th percentile 3 – Up to and including the 75th percentile 4 – Up to and including the 100th percentile |
| Scoring methodology | As above |
OF4004 – People and workforce domain score
| ID | OF4004 |
| Status | Scored – MHS automated |
| Metric Name | People and workforce domain average score |
| Granularity | All trust types |
| Basis | Quarterly |
| Description | Average of all people and workforce metric scores |
| Purpose | This score is designed to allow users to see the average of all metric scores related to finance and productivity |
| Published source | Published NOF scores |
| Metric methodology | Numerator: Sum total of all metric scores in group four of section one for which the organisation has a value recorded Denominator: Count of all metrics in group four of section one for which the organisation has a value recorded |
| Scoring methodology | Numerator divided by denominator rounded to two decimal places |
OF4104 – People and workforce domain segment
| ID | OF4104 |
| Status | Scored – MHS automated |
| Metric Name | People and workforce domain segment |
| Granularity | All trust types |
| Basis | Quarterly |
| Description | The domain average score, placed into quartiles |
| Purpose | This score is designed to allow users to see overall NOF score for the domain |
| Published source | Published NOF scores |
| Metric methodology | All organisations domain average scores are divided into quartiles. 1 – Up to and including the 25th percentile 2 – Up to and including the 50th percentile 3 – Up to and including the 75th percentile 4 – Up to and including the 100th percentile |
| Scoring methodology | As above |
OF4003 – Finance and productivity domain score
| ID | OF4003 |
| Status | Scored – MHS automated |
| Metric Name | Finance and productivity domain average score |
| Granularity | All trust types |
| Basis | Quarterly |
| Description | Average of all finance and productivity metric scores |
| Purpose | This score is designed to allow users to see the average of all metric scores related to finance and productivity |
| Published source | Published NOF scores |
| Metric methodology | Numerator: Sum total of all metric scores in group five of section one for which the organisation has a value recorded Denominator: Count of all metrics in group five of section one for which the organisation has a value recorded |
| Scoring methodology | Numerator divided by denominator rounded to two decimal places |
OF4103 – Finance and productivity domain segment
| ID | OF4103 |
| Status | Scored – MHS automated |
| Metric Name | Finance and productivity domain segment |
| Granularity | All trust types |
| Basis | Quarterly |
| Description | The domain average score, placed into quartiles |
| Purpose | This score is designed to allow users to see overall NOF score for the domain |
| Published source | Published NOF scores |
| Metric methodology | All organisations domain average scores are divided into quartiles. 1 – Up to and including the 25th percentile 2 – Up to and including the 50th percentile 3 – Up to and including the 75th percentile 4 – Up to and including the 100th percentile |
| Scoring methodology | As above |
7. Overall scores
OF5002 – Average metric score
| ID | OF5002 |
| Status | Scored – MHS automated |
| Metric Name | Average metric score |
| Granularity | All trust types |
| Basis | Quarterly |
| Description | Average of all metric scores |
| Purpose | Each NOF metric produces an individual score, this metric determines an average metric score to allow individual organisations to be compared with one another in order to apply segmentation |
| Published source | Published NOF scores |
| Metric methodology | Numerator: Sum total of all metric scores in section one for which the organisation has a value recorded Denominator: Count of all metrics in section one for which the organisation has a value recorded |
| Scoring methodology | Numerator divided by denominator rounded to two decimal places |
OF5003- Unadjusted segment
| ID | OF5003 |
| Status | Scored – MHS automated |
| Metric Name | Unadjusted segment |
| Granularity | All trust types |
| Basis | Quarterly |
| Description | The quartile into which each organisation’s average metric score falls prior to any financial override |
| Purpose | Average metric scores are divided into quartiles to produce an initial segment of 1 – 4 for each organisation. This measure is important when determining potential further support or intervention that may be required. |
| Published source | Published NOF scores |
| Metric methodology | Computation: Average metric scores for all organisations ranked in sequential order from low to high and quartiled to produce four equal segments |
| Scoring methodology | Where the organisation’s average metric score is in the lowest quartile they will receive a segment of one. Where the average metric score is lower than average but higher than the lower quartile they will receive a segment of two. Where the average metric score is higher than average but lower than the upper quartile they will receive a segment of three. Where the average metric score is in the upper quartile they will receive a segment of four. |
OF5004 – Financial override
| ID | OF5004 |
| Status | Scored – manual |
| Metric Name | Financial override |
| Granularity | ICBs and all trusts |
| Basis | Quarterly |
| Description | This is an automated rule that denotes whether or not the organisation is currently in financial deficit |
| Purpose | Restoring financial balance across the NHS is a core priority, and progression into higher segments and the freedoms they receive is only appropriate for organisations that can operate within their allocated budgets; accordingly, a financial override is applied so any organisation in deficit cannot be better than segment three |
| Published source | This metric is based on internal finance data |
| Metric methodology | Three criteria are considered in sequential order: Criterion one: Is the organisation in receipt of deficit support funding? (Y/N) Criterion two: Does the organisation have a planned annual deficit? (Y/N) Criterion three: Does the organisation have a negative variance from financial plan at the current point? (Y/N) |
| Scoring methodology | If criterion one = Y then the override is applied, and no further rules are run. If criterion two = Y then the override is applied and no further rules are run. If criterion three = Y then it is determined whether the negative variance would result in an overall planned deficit, if yes then the override is applied if no it is not. If all three criteria = N then no override is applied. |
OF5000 – Adjusted segment
| ID | OF5000 |
| Status | Scored – MHS automated |
| Metric Name | Adjusted segment |
| Granularity | All trust types |
| Basis | Quarterly |
| Description | The quartile of each organisation following consideration of the financial override |
| Purpose | The metric ensures that where the financial override has been applied the final organisational segment reflects this |
| Published source | Published NOF scores and financial override |
| Metric methodology | Two criteria are considered in sequential order: Criterion one: Is the financial override applicable (Y/N) Criterion two: Is the unadjusted segment one or two? (Y/N) |
| Scoring methodology | Where both criteria = Y the organisation receives an adjusted segment of three. Where either or both criteria = N the adjusted segment is directly inherited from the unadjusted segment. |
Publication reference: PRN01916