
Martha’s Rule Programme January 2026
Please note that this data has been published as management information.
1 Background
Martha’s Rule is a patient safety initiative to support the early detection of deterioration by ensuring the concerns of patients, families, carers and staff are listened to and acted upon.
It has been developed in response to the death of Martha Mills and other cases related to the management of deterioration. Central to Martha’s Rule is the right for patients, families and carers to request a rapid review if they are worried that their or their loved one’s condition is getting worse and their concerns are not being responded to. The three core components of Martha’s Rule are:
- Patients will be asked, at least daily, about how they are feeling, and if they are getting better or worse, and this information will be acted on in a structured way.
- All staff will be able, at any time, to ask for a review from a different team if they are concerned that a patient is deteriorating, and they are not being responded to.
- This escalation route will also always be available to patients themselves, their families and carers and advertised across the hospital.
Martha’s Rule can work alongside existing physiological scoring systems to increase the sensitivity of identifying and responding to acute deterioration.
Further information about Martha’s Rule and its implementation can be found here.
This report provides analysis of submissions to the Martha’s Rule Data Collection from September 2024 to January 2026. This data relates to phase 1 and phase 2 sites within NHS acute trusts across England. Phase 2 sites began reporting data from August 2025.
2 Response rate
The below table and chart summarise the number and proportion of responses received for the Martha’s Rule Data Collection. In August 2025, phase 2 of Martha’s Rule commenced, where the programme was rolled out to all acute inpatient hospital sites in England.
The total number of sites increase over time for the following reasons:
- In Jul-25 due to one trust separating their reporting for two sites
- In Aug-25 due to commencing of phase 2
- In Oct-25 due to later onboarding of 5 sites
- In Dec-25 due to later onboarding of 1 site.
Later onboarding of other sites may increase the total number of sites in future publications.
Table 1: Number of valid submissions each month and response rate. The number of valid submissions excludes the submissions that had to be removed due to data quality issues (see Data quality notes).
| Date | Number of valid submissions | Number of sites (phase 1 or phase 2) | Response rate (%) |
|---|---|---|---|
| Sep-24 | 144 | 147 | 98% |
| Oct-24 | 144 | 147 | 98% |
| Nov-24 | 140 | 147 | 95% |
| Dec-24 | 142 | 147 | 97% |
| Jan-25 | 143 | 147 | 97% |
| Feb-25 | 145 | 147 | 99% |
| Mar-25 | 146 | 147 | 99% |
| Apr-25 | 144 | 147 | 98% |
| May-25 | 143 | 147 | 97% |
| Jun-25 | 145 | 147 | 99% |
| Jul-25 | 144 | 148 | 97% |
| Aug-25 | 200 | 214 | 93% |
| Sep-25 | 203 | 214 | 95% |
| Oct-25 | 219 | 219 | 100% |
| Nov-25 | 219 | 219 | 100% |
| Dec-25 | 217 | 220 | 99% |
| Jan-26 | 214 | 220 | 97% |
3 Summary
The key figures for the Martha’s Rule Programme data across NHS England from September 2024 to January 2026 are:
- In total, 11,238 Martha’s Rule escalation calls have been received.
- The highest proportion of calls came via the family/carer escalation process (72%).
- 3,763 (33%) Martha’s Rule escalation calls related to acute deterioration.
- 486 calls (13% of acute deterioration calls) required transfers of care to ICU/HDU, enhanced levels of care, tertiary centre or referral/transfer to specialists or a specialist ward.
- 1,624 (43% of acute deterioration calls) required other changes in treatment.
4 Calls analysis
This section examines who made the Martha’s Rule escalation call, calls per region and whether the call related to acute deterioration.
4.1 Call trends over time
Calls have increased in line with increasing implementation of the programme. Figure 2 highlights that the highest proportion of Martha’s Rule escalation calls came via the family/carer escalation process (72%). Not all sites respond each month and the data excludes submissions that had to be removed due to data quality issues. Please refer to the response rates for context.
Figure 1: Number of Martha’s Rule calls per month by escalation process. Reporting period from September 2024 to January 2026.
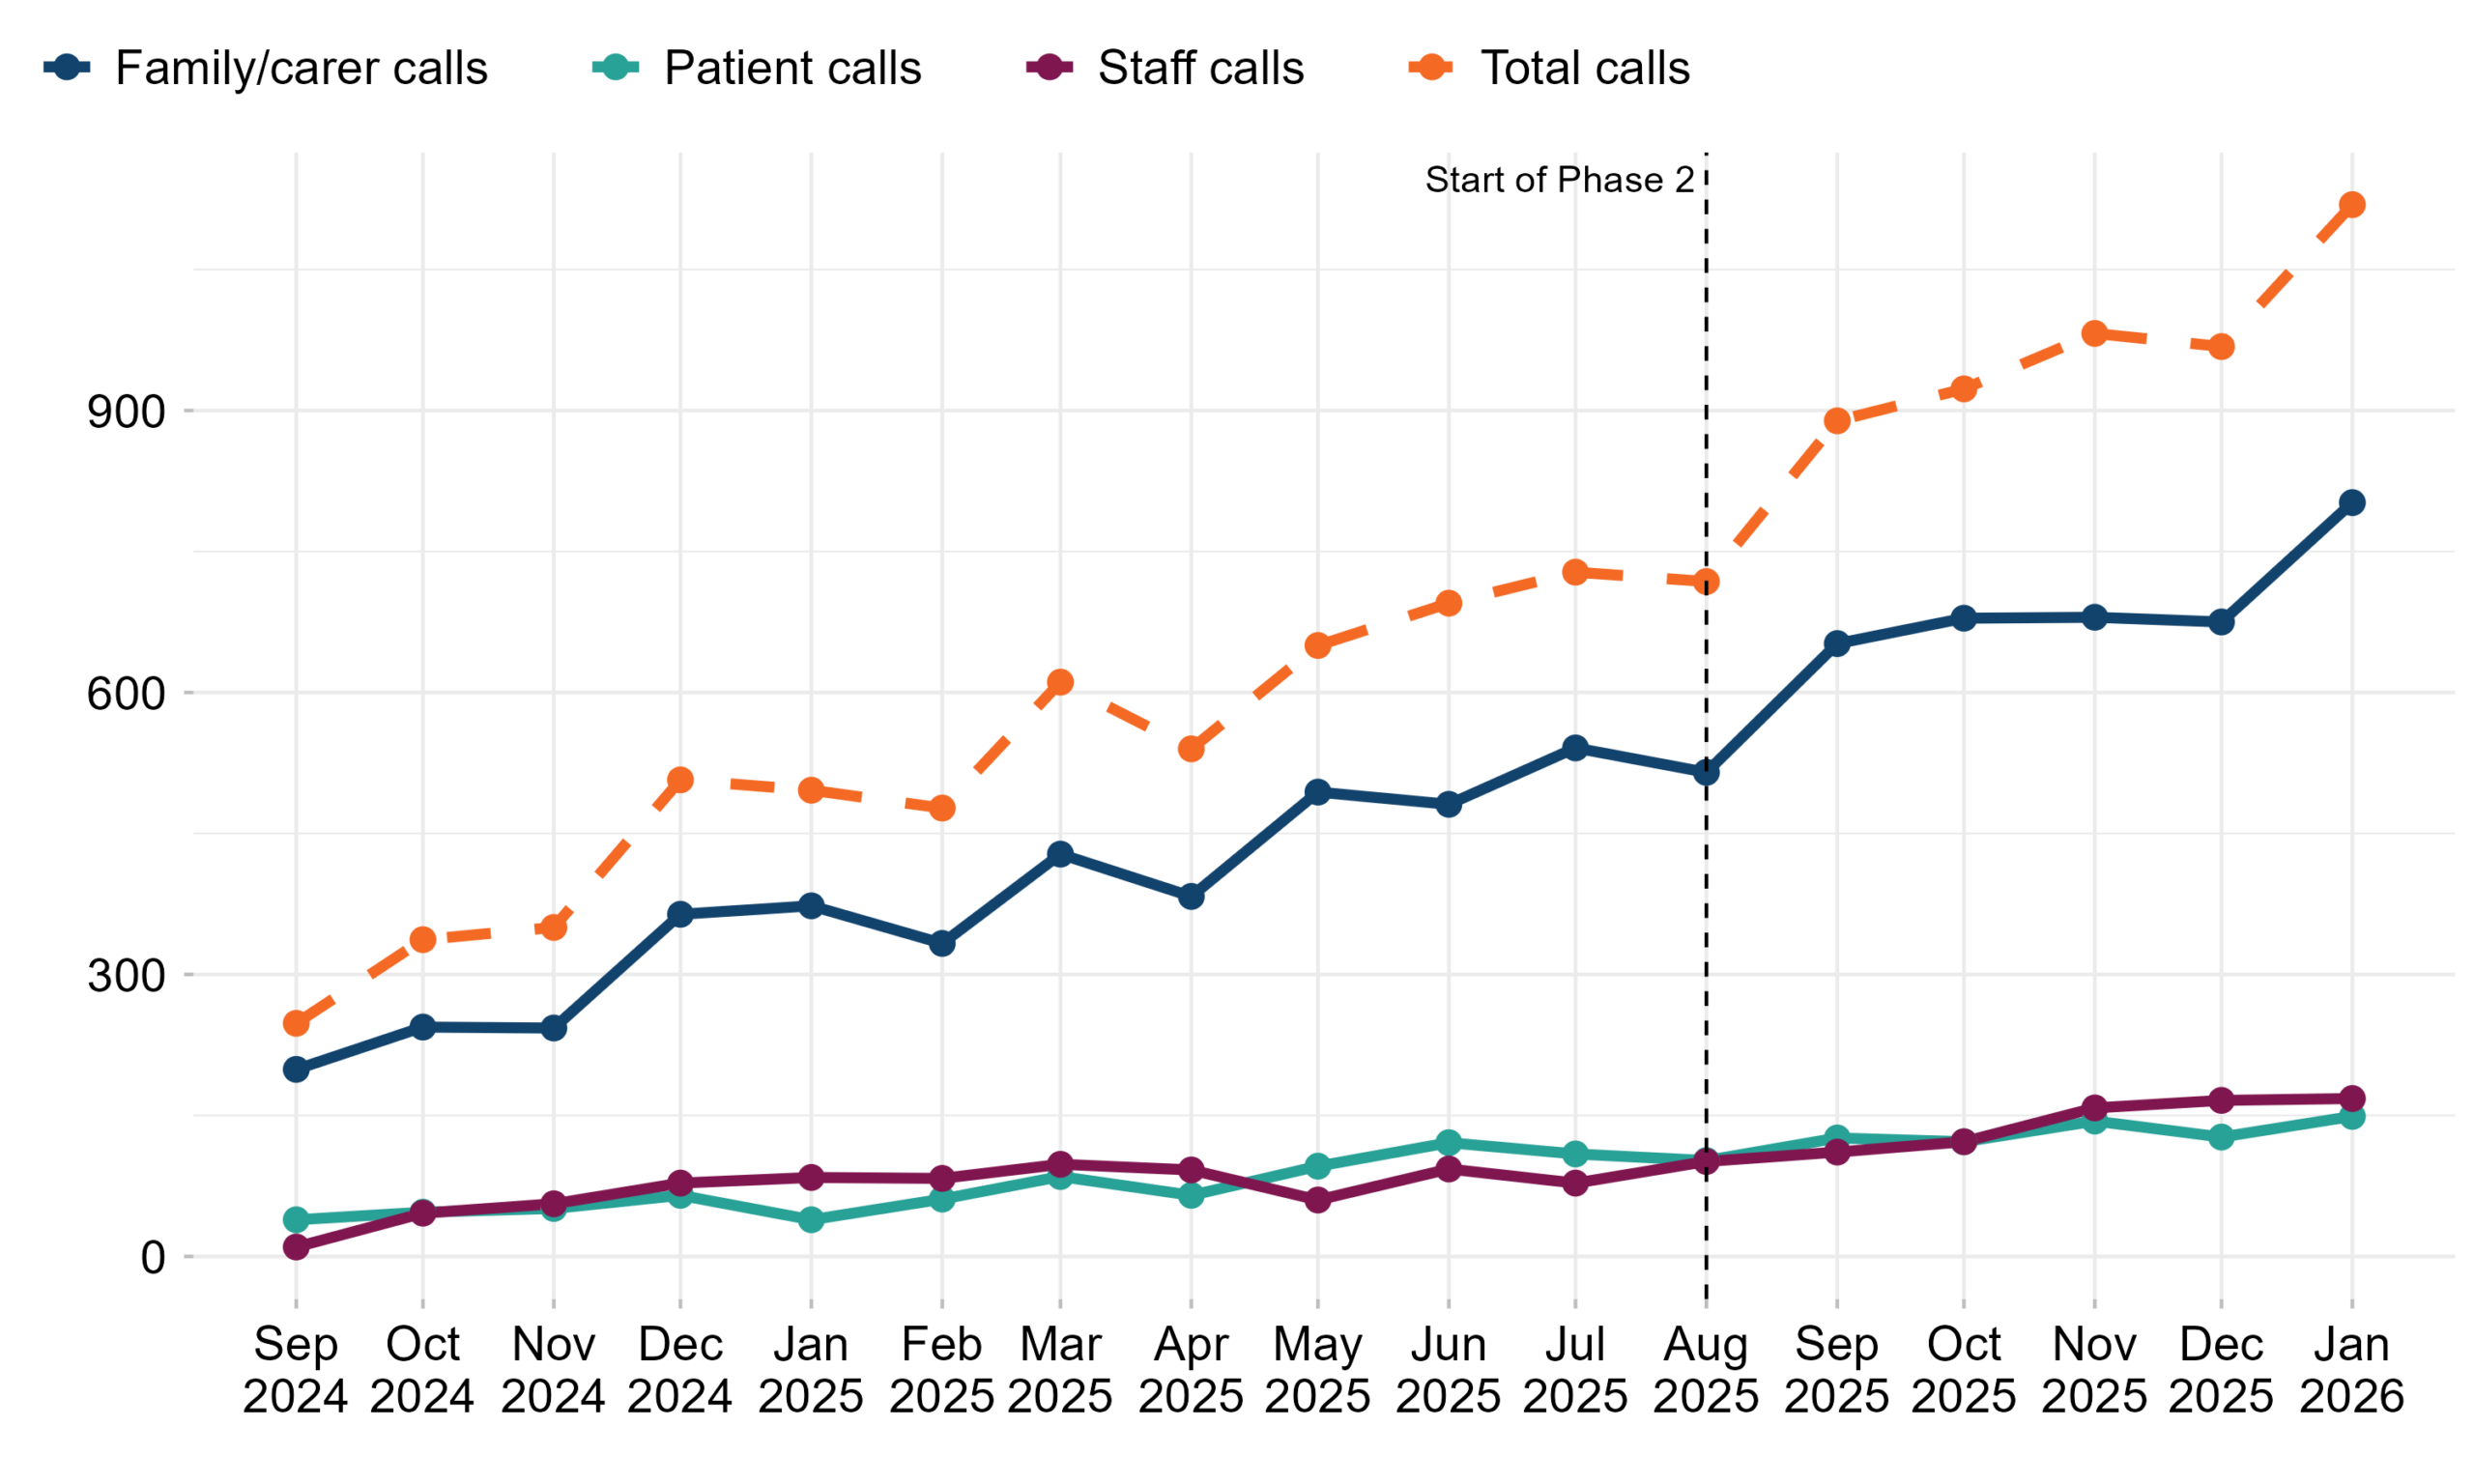
Table 2: Number of Martha’s Rule calls by escalation process. Reporting period from September 2024 to January 2026.
| Date | Family/carer calls | Patient calls | Staff calls | Total calls |
|---|---|---|---|---|
| Sep-24 | 199 | 39 | 10 | 248 |
| Oct-24 | 244 | 47 | 46 | 337 |
| Nov-24 | 243 | 51 | 56 | 350 |
| Dec-24 | 364 | 65 | 78 | 507 |
| Jan-25 | 373 | 39 | 84 | 496 |
| Feb-25 | 333 | 61 | 83 | 477 |
| Mar-25 | 428 | 85 | 98 | 611 |
| Apr-25 | 383 | 65 | 92 | 540 |
| May-25 | 494 | 96 | 60 | 650 |
| Jun-25 | 481 | 121 | 93 | 695 |
| Jul-25 | 541 | 109 | 78 | 728 |
| Aug-25 | 515 | 102 | 101 | 718 |
| Sep-25 | 652 | 126 | 111 | 889 |
| Oct-25 | 679 | 122 | 122 | 923 |
| Nov-25 | 680 | 144 | 158 | 982 |
| Dec-25 | 675 | 127 | 166 | 968 |
| Jan-26 | 802 | 149 | 168 | 1,119 |
| Total | 8,086 | 1,548 | 1,604 | 11,238 |
4.2 Martha’s Rule calls by NHS England region
Figure 2: Number of calls and number of phase 1 or phase 2 sites per NHS England region. Phase 2 sites started reporting data from August 2025. This figure is an aggregate of phase 1 and phase 2 sites from September 2024 to January 2026.
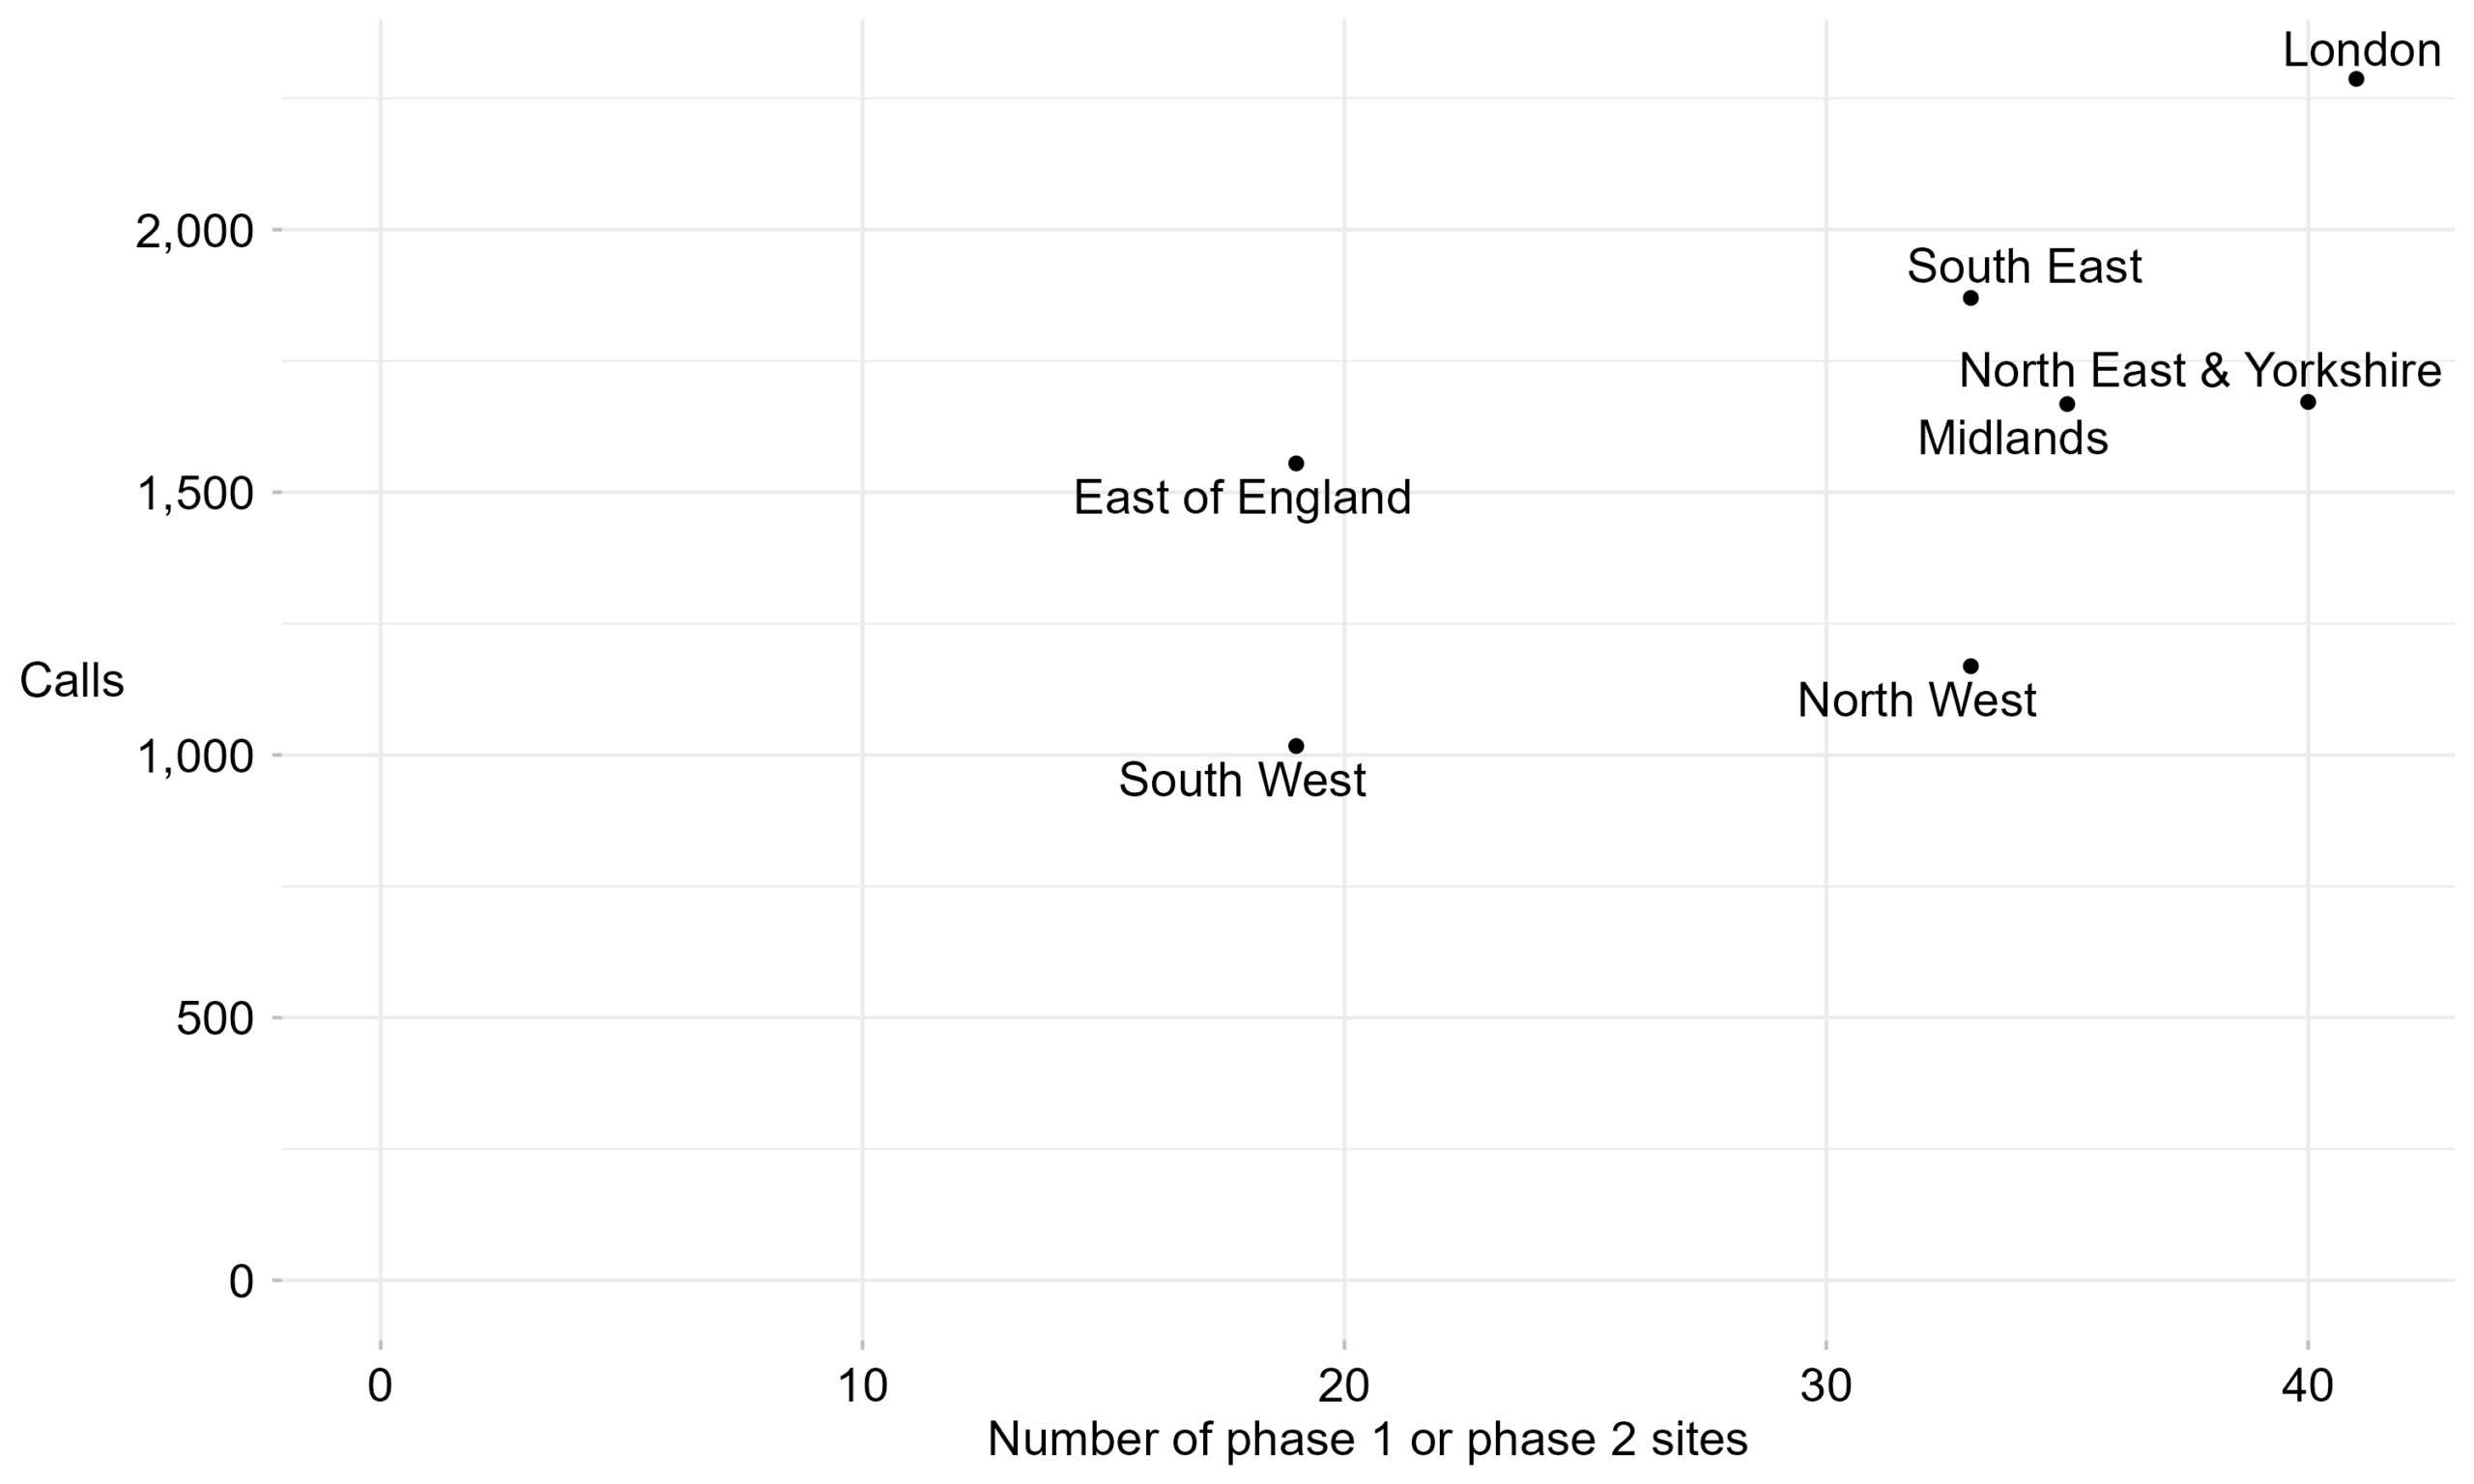
Table 3: Number of calls and number of sites per NHS England region. Phase 2 sites started reporting data from August 2025. Reporting period from September 2024 to January 2026.
| Region | Total calls | Number of phase 1 sites | Number of phase 2 sites | Number of phase 1 and phase 2 sites |
|---|---|---|---|---|
| East of England | 1,555 | 16 | 3 | 19 |
| London | 2,287 | 34 | 7 | 41 |
| Midlands | 1,668 | 20 | 15 | 35 |
| North East & Yorkshire | 1,672 | 22 | 18 | 40 |
| North West | 1,169 | 18 | 15 | 33 |
| South East | 1,870 | 21 | 12 | 33 |
| South West | 1,017 | 17 | 2 | 19 |
4.3 Martha’s Rule call flow analysis
Figure 3: Number of calls by escalation process and whether the call was related to acute deterioration. Reporting period from September 2024 to January 2026.
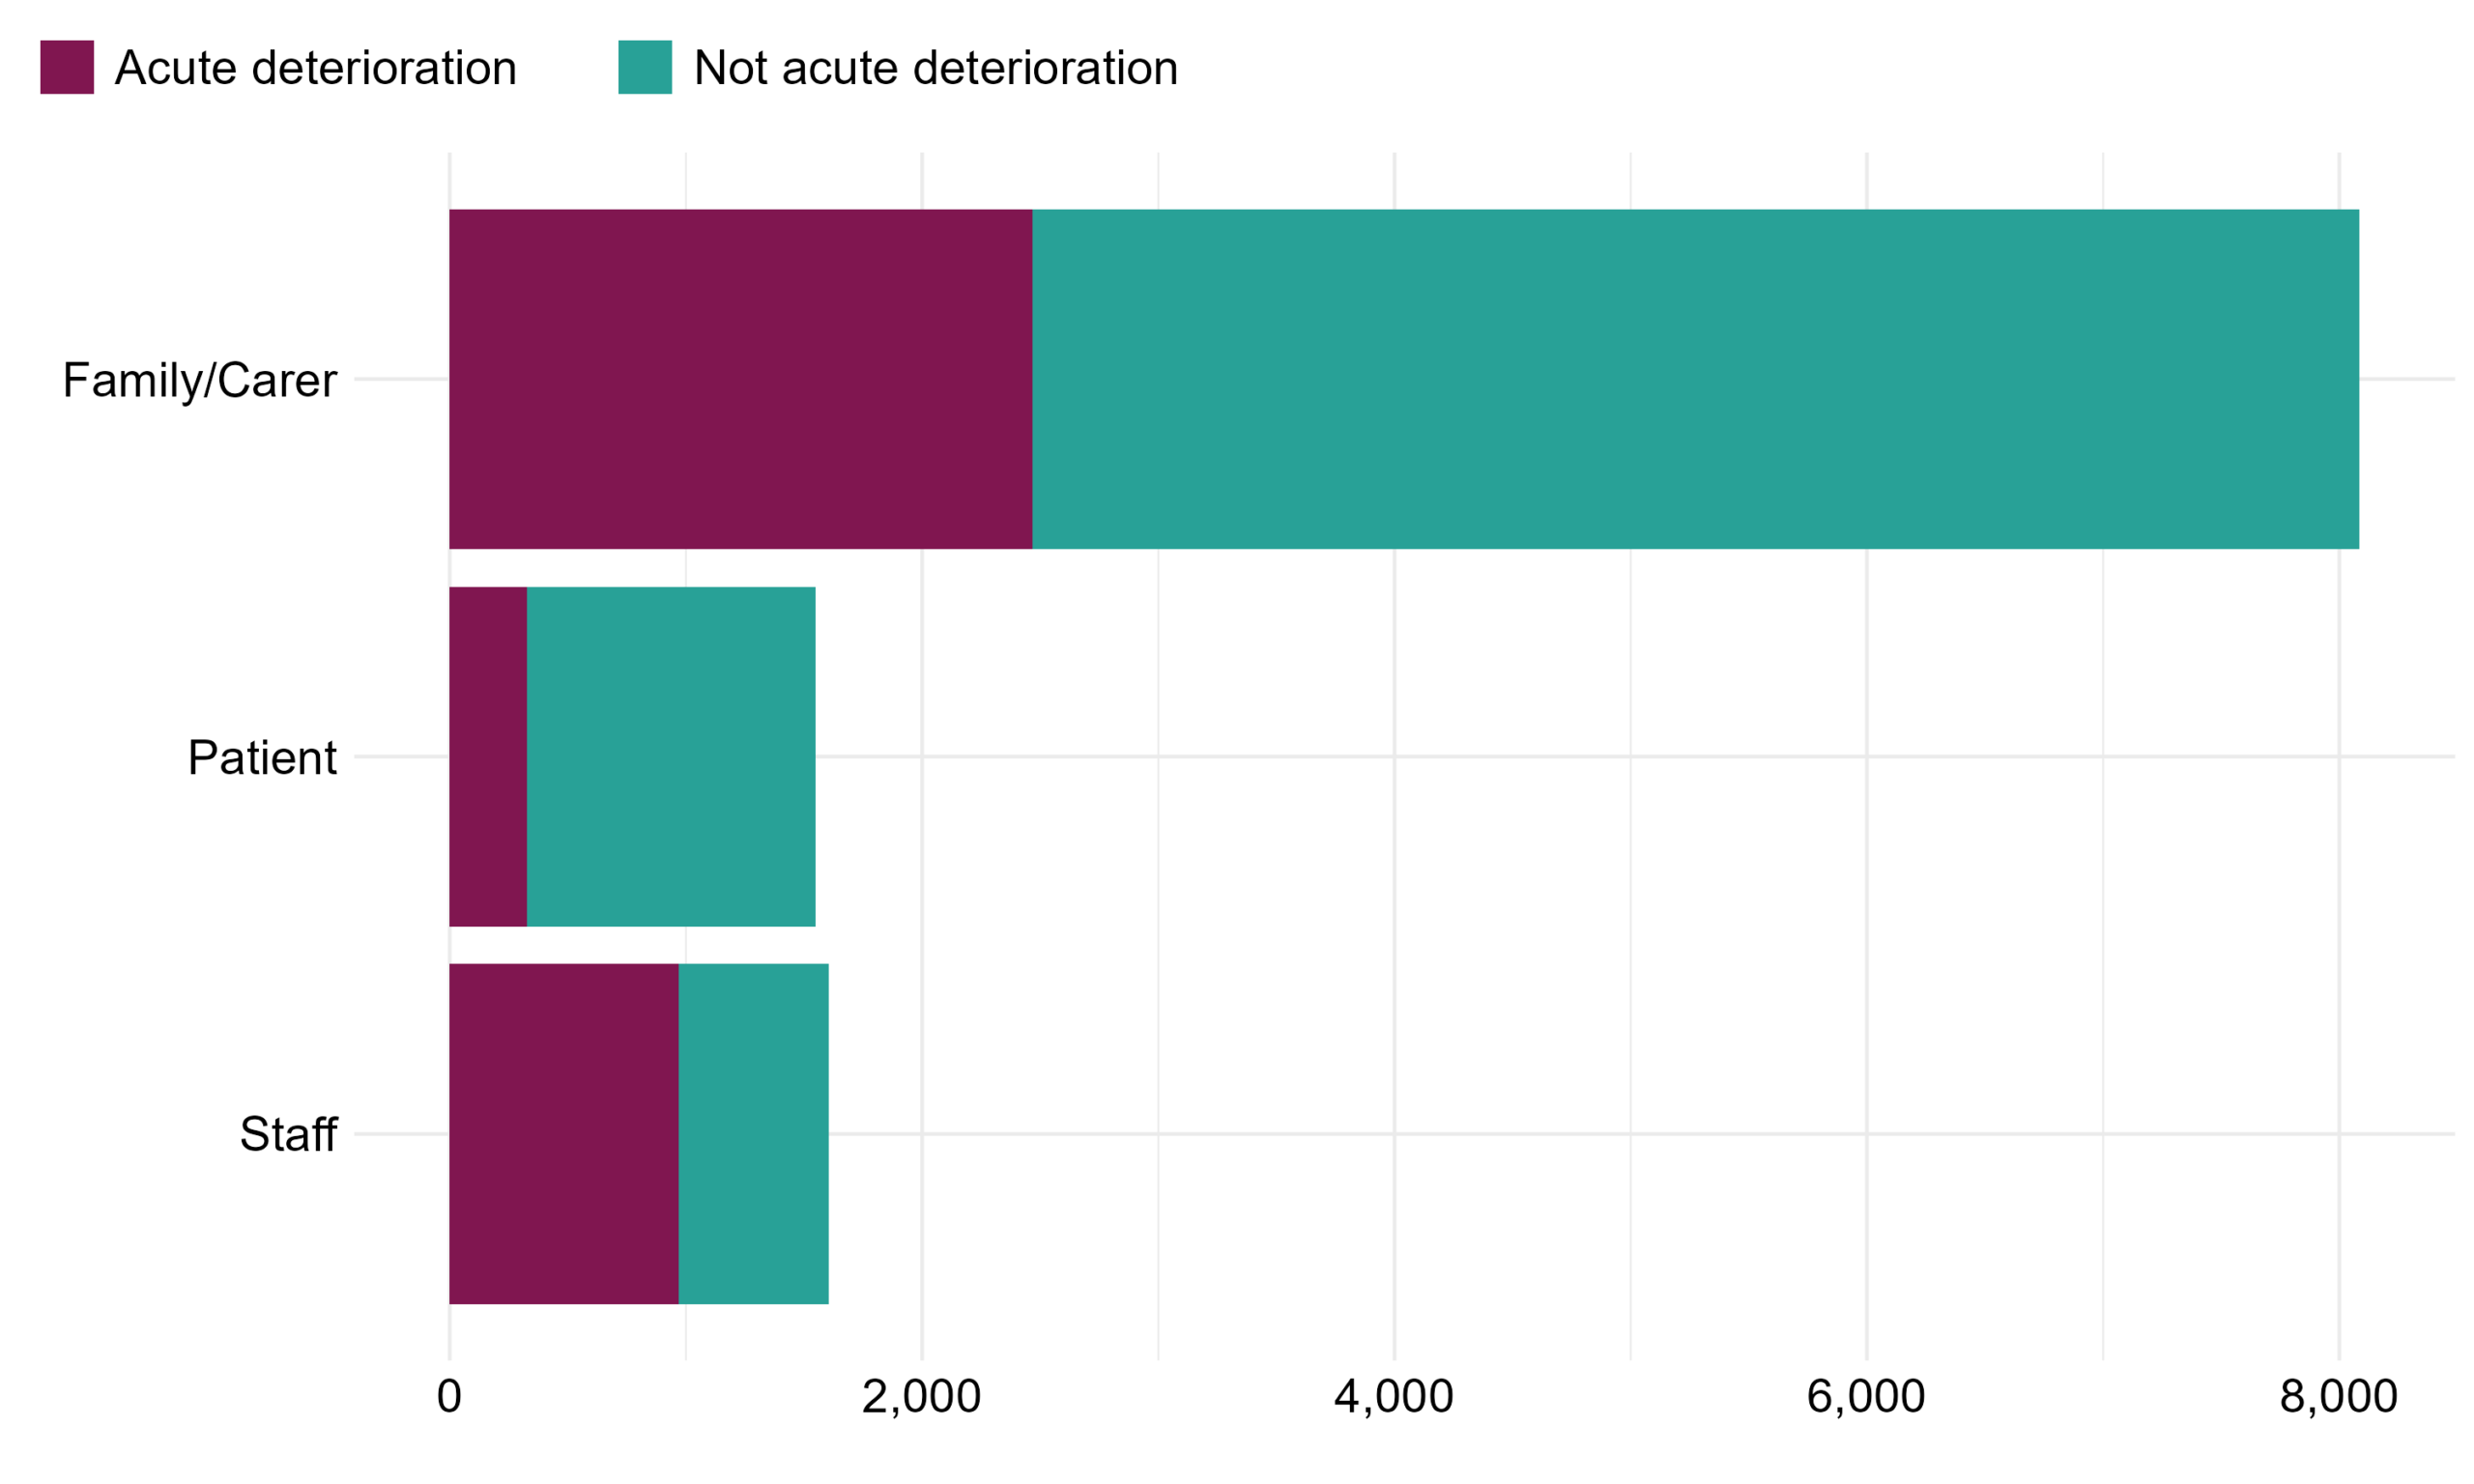
Table 4: Flow of calls by escalation process and whether the call was related to acute deterioration. Reporting period from September 2024 to January 2026.
| Escalation process | Acute deterioration | Not acute deterioration | Total calls | Percentage of calls that related to acute deterioration |
|---|---|---|---|---|
| Family/Carer | 2,466 | 5,620 | 8,086 | 30% |
| Patient | 327 | 1,221 | 1,548 | 21% |
| Staff | 970 | 634 | 1,604 | 60% |
| Total | 3,763 | 7,475 | 11,238 | 33% |
5 Outcomes of Martha’s Rule calls
5.1 Data consolidation
In addition to the number of calls, the Martha’s Rule Data Collection also collects high-level information on the outcomes of these calls. In June 2025, the outcomes collected were refined using insight from the pilot to strengthen learning. Additional response outcomes for those calls related to acute deterioration were also added in August 2025 to strengthen insights in relation to children and young people. For the purpose of this report, outcomes have been consolidated into groups where clinically similar.
For acute deterioration calls, the number of possible outcomes expanded from six to eleven, and are grouped into three as follows:
- Documented advice (no intervention), where following acute deterioration review, no further changes were made to patient care.
- Transfers of care, which includes transfers to adult ICU/HDU, paediatric HDU (paediatric critical care [PCC] 1 & 2), paediatric ICU (paediatric critical care [PCC] 3), enhanced levels of care, tertiary centres or referral/transfer to specialists or a specialist ward.
- Other change in treatment, which includes changes to nursing, surgical or medical management such as investigations or diagnostics, new medications including antibiotics or the commencement of IV fluids or oxygen. These changes in treatment do not require transfer of a patient from a ward in-patient setting.
For the calls not related to acute deterioration, the number of possible outcomes expanded from five to eight, and are grouped into five as follows:
- Clinical concern (including medication issues, management of long-term conditions and delayed investigations)
- Communication issue (including discharge planning)
- Non-clinical concern
- Signpost to another service/team
- Other
These groups are used for Figure 5 and tables 5a and 5b, with the full outcomes data provided in tables 5c and 5d.
5.2 Outcome flow analysis
- Of the 11,238 Martha’s Rule escalation calls, 3,763 (33%) related to acute deterioration.
- 486 calls (13% of acute deterioration calls) required transfers of care to adult and paediatric ICU/HDU, enhanced levels of care, tertiary centre or referral/transfer to specialists or a specialist ward.
- 1,624 (43% of acute deterioration calls) required other changes in treatment.
Figure 4: Flow of escalation calls from initial contact through to outcomes. Reporting period from September 2024 to January 2026. Note that from June 2025, sites could select up to three outcomes for each acute deterioration call. Only the primary outcome has been visualised here.
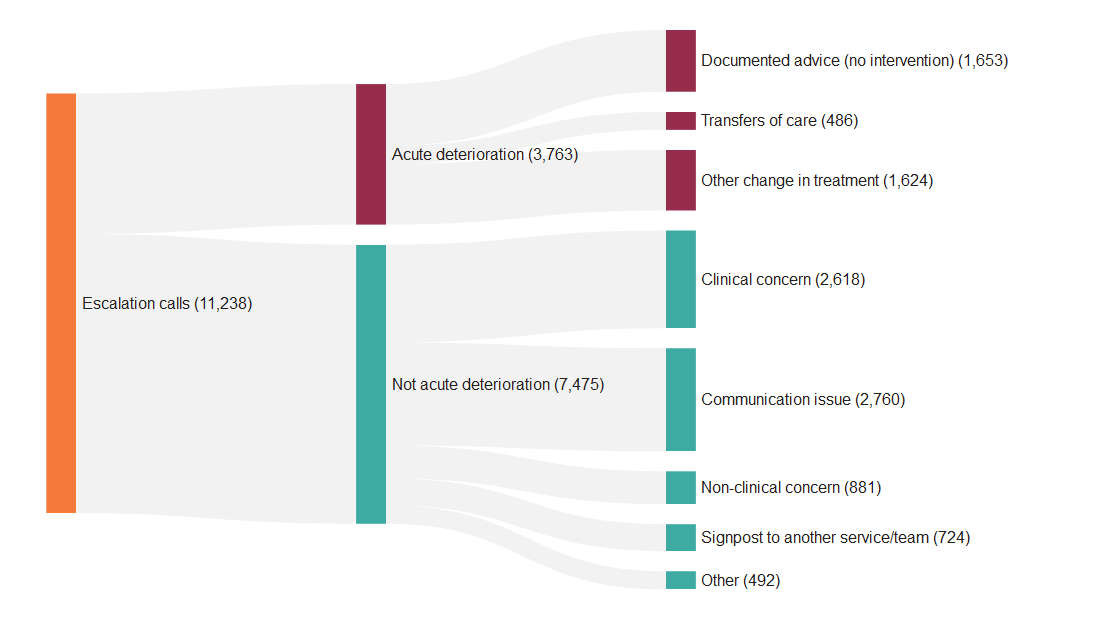
Table 5a: Table of outcomes for acute deterioration calls. Reporting period from September 2024 to January 2026.
| Outcome | Number of calls | Percentage of the acute deterioration calls |
|---|---|---|
| Documented advice (no intervention) | 1,653 | 44% |
| Transfers of care | 486 | 13% |
| Other change in treatment | 1,624 | 43% |
| Total | 3,763 | 100% |
Table 5b: Table of outcomes for calls not related to acute deterioration. Reporting period from September 2024 to January 2026.
| Outcome | Number of calls | Percentage of the not acute deterioration calls |
|---|---|---|
| Clinical concern | 2,618 | 35% |
| Communication issue | 2,760 | 37% |
| Non-clinical concern | 881 | 12% |
| Signpost to another service/team | 724 | 10% |
| Other | 492 | 7% |
| Total | 7,475 | 100% |
5.3 Ungrouped outcomes
Table 5c: Full table of outcomes for acute deterioration calls. Reporting period from September 2024 to January 2026. Note that these outcomes relate to all patient age groups.
| Outcome | Status | Grouping in report | Number of calls |
|---|---|---|---|
| Documented advice (no intervention). | Existing outcome | Documented advice (no intervention) | 1,653 |
| Referral to specialist input or transfer to specialist ward. | New outcome in June 2025 | Transfer of care | 145 |
| Transfer to adult HDU/ICU. | New outcome in August 2025 | Transfer of care | 71 |
| Transfer to enhanced level. | Existing outcome | Transfer of care | 34 |
| Transfer to HDU/ICU. | Removed in August 2025 | Transfer of care | 101 |
| Transfer to paediatric HDU (PCC 1 & 2) | New outcome in August 2025 | Transfer of care | 5 |
| Transfer to paediatric ICU (PCC3) | New outcome in August 2025 | Transfer of care | 3 |
| Transfer to tertiary centre (off or onsite). | Existing outcome | Transfer of care | 49 |
| Other | Removed in June 2025 | Transfer of care | 78 |
| Change in management/ intervention required | Removed in June 2025 | Other change in treatment | 627 |
| End of life pathway (not for critical care). | New outcome in June 2025 | Other change in treatment | 39 |
| Investigations / diagnostics including scans / blood tests | New outcome in June 2025 | Other change in treatment | 339 |
| IV fluids, oxygen, secretion management, pain or changes to nursing care | New outcome in June 2025 | Other change in treatment | 256 |
| New medications including antibiotics. | New outcome in June 2025 | Other change in treatment | 121 |
| Procedural interventions including going to theatre, drains. | New outcome in June 2025 | Other change in treatment | 29 |
| Other change in management / intervention required. | New outcome in June 2025 | Other change in treatment | 213 |
Table 5d: Full table of outcomes for the calls not related to acute deterioration. Reporting period from September 2024 to January 2026.
| Outcome | Status | Grouping in report | Number of calls |
|---|---|---|---|
| Clinical concern/management of a long term condition | Existing outcome | Clinical concern | 1,949 |
| Delayed investigations | New outcome in June 2025 | Clinical concern | 291 |
| Medication issue/delay | New outcome in June 2025 | Clinical concern | 378 |
| Communication issue | Existing outcome | Communication issue | 2,393 |
| Discharge planning | New outcome in June 2025 | Communication issue | 367 |
| Non-clinical concern | Existing outcome | Non-clinical concern | 881 |
| Signpost to another service/team | Existing outcome | Signpost to another service/team | 724 |
| Other | Existing outcome | Other | 492 |
6 Martha’s Rule’s role in increasing reliability of identifying and responding to deterioration
6.1 Acute deterioration calls where the Early Warning Score was recorded prior to the Martha’s Rule call
An early warning score is a standardised method of measuring physiological parameters in patients, such as heart rate and temperature, in order to identify and triage those who are acutely deteriorating. Between June 2025 and January 2026, an early warning score was recorded prior to 1,708 of 1,811 Martha’s Rule calls which related to acute deterioration (94%). For most of these calls, the early warning score recorded prior to the call would not otherwise have triggered escalation (81%), and of these, most led to a transfer of care or other change in treatment (14%; 55%). This indicates that Martha’s Rule is identifying patients in need of further clinical interventions where this need would not have been identified via an early warning score.
Figure 5: Sankey diagram showing number of acute deterioration calls where the early warning score was recorded prior to the Martha’s Rule call, if this would or would not have triggered a review via standard escalation processes, and the call outcome. Reporting period from June 2025 to January 2026. Note that this measure was not collected prior to June 2025.
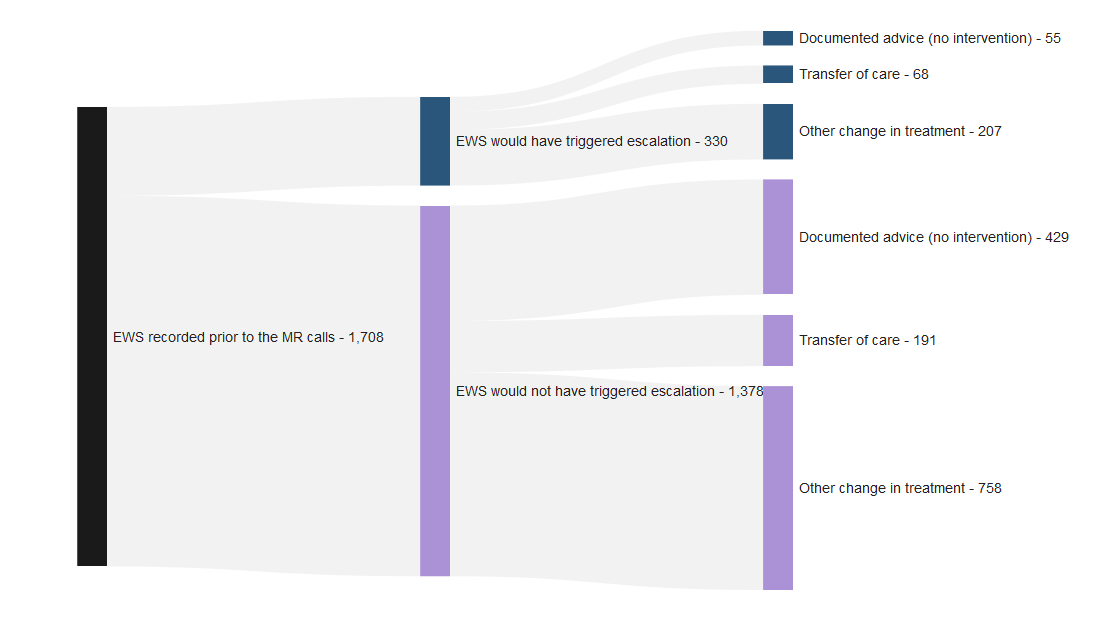
Table 6: Table showing outcomes for when the early warning score recorded prior the Martha’s Rule call would or would not have triggered a review via standard escalation processes, and the call outcome. Reporting period from June 2025 to January 2026. Note that this measure was not collected prior to June 2025.
| Outcome | EWS would have triggered escalation | EWS would not have triggered escalation |
|---|---|---|
| Documented advice (no intervention) | 55 (17%) | 429 (31%) |
| Transfer of care | 68 (21%) | 191 (14%) |
| Other change in treatment | 207 (63%) | 758 (55%) |
| Total | 330 (100%) | 1,378 (100%) |
6.2 Acute deterioration calls where the Early Warning Score was recorded at the time of the Martha’s Rule review
Data is also collected as above but where an early warning score was recorded at the time of the Martha’s rule review. The distribution of data is broadly similar at the two points in time.
Figure 6: Sankey diagram showing number of acute deterioration calls where the early warning score was recorded at the time of the Martha’s Rule review, if this would or would not have triggered a review via standard escalation processes, and the call outcome. Reporting period from June 2025 to January 2026. Note that this measure was not collected prior to June 2025.
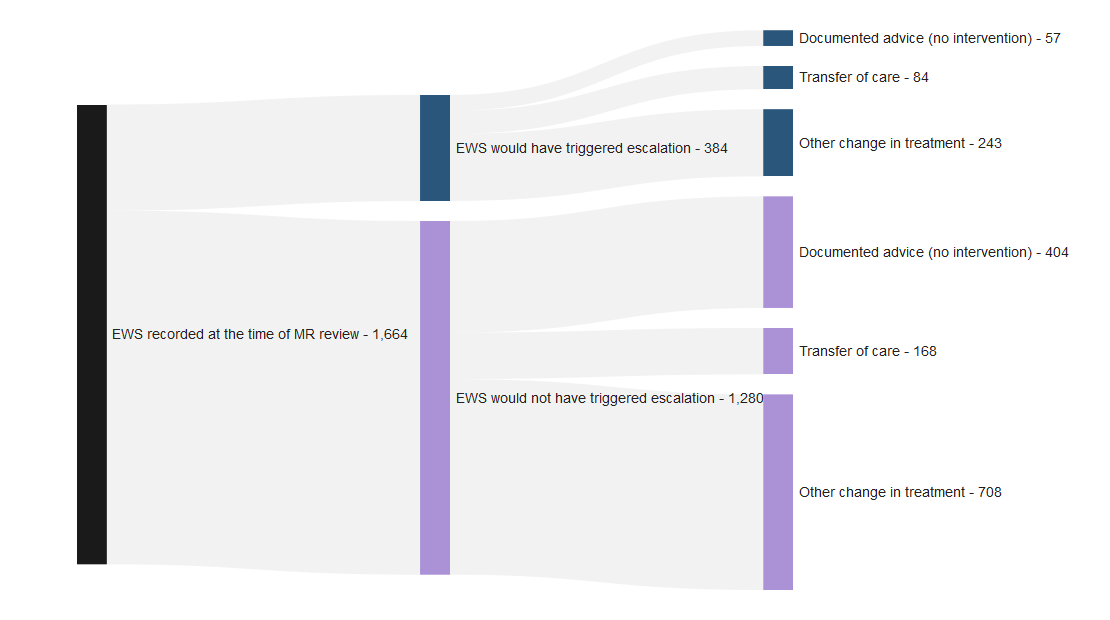
Table 7: Table showing outcomes for when the early warning score recorded at the time of the Martha’s Rule review would or would not have triggered a review via standard escalation processes, and the call outcome. Reporting period from June 2025 to January 2026. Note that this measure was not collected prior to June 2025.
| Outcome | EWS would have triggered escalation | EWS would not have triggered escalation |
|---|---|---|
| Documented advice (no intervention) | 57 (15%) | 404 (32%) |
| Transfer of care | 84 (22%) | 168 (13%) |
| Other change in treatment | 243 (63%) | 708 (55%) |
| Total | 384 (100%) | 1,280 (100%) |
6.3 Acute deterioration calls where the Patient Wellness Question was asked
The patient wellness question, one of the three components of Martha’s Rule, is a structured way of asking (at least daily) how the patient is feeling and if they are getting better or worse. Between June 2025 and January 2026, the patient wellness question was asked for 1,351 of 1,811 acute deterioration calls (75%). Where asked, the patient wellness question was not itself the reason for the call in most cases (76%), which is as expected since most calls currently originate via the family/carer escalation route. However, for those cases where the patient wellness question was the reason for the call (24%), this mostly led to a transfer of care or other change in treatment (15%; 67%). This indicates that the patient wellness question is identifying patients in need of further clinical interventions in addition to those patients identified via other means.
Figure 7: Sankey diagram showing number of acute deterioration calls where the Patient Wellness Question was asked, if this was or was not the reason for the Martha’s Rule escalation call, and the call outcome. Reporting period from June 2025 to January 2026. Note that this measure was not collected prior to June 2025.
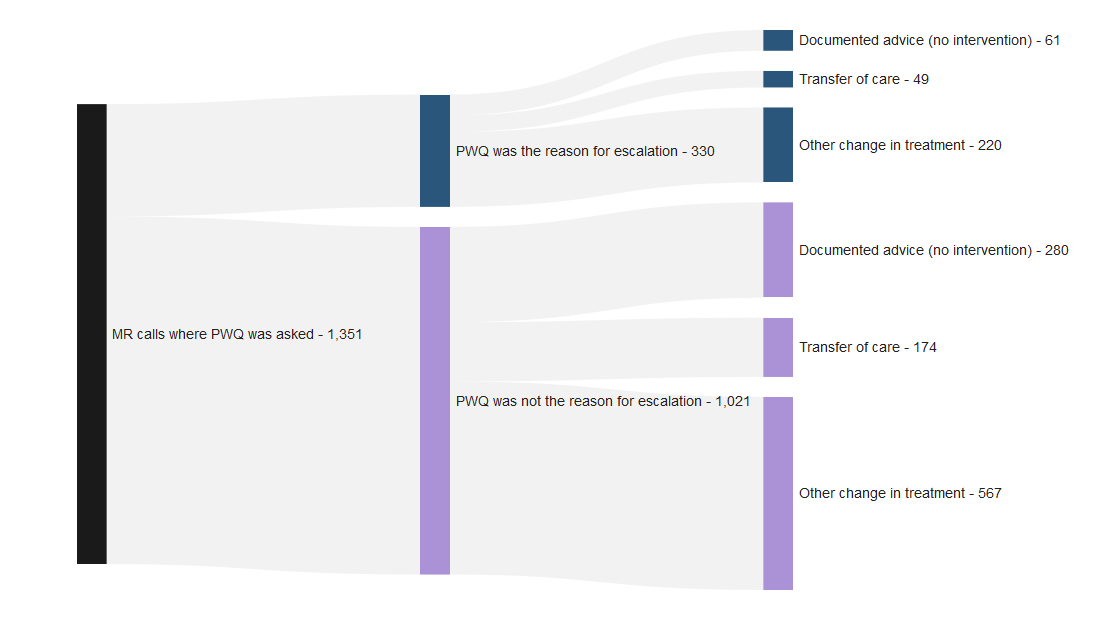
Table 8: Table showing outcomes for when the Patient Wellness Question was or was not the reason for Martha’s Rule escalation call. Reporting period from June 2025 to January 2026. Note that this measure was not collected prior to June 2025.
| Outcome | PWQ was the reason for escalation | PWQ was not the reason for escalation |
|---|---|---|
| Documented advice (no intervention) | 61 (18%) | 280 (27%) |
| Transfer of care | 49 (15%) | 174 (17%) |
| Other change in treatment | 220 (67%) | 567 (56%) |
| Total | 330 (100%) | 1,021 (100%) |
Measuring the balance of benefits and risks in relation to these interacting processes is complex and this data is released as management information rather than to conduct statistical comparisons of escalation tools, so caution should be taken when interpreting these figures.
7 Children and young people
This section specifically focuses on acute deterioration calls related to children and young people (0-18 years old). Further analysis of outcomes for patients 18 years or younger will be presented in future publications.
Table 9: Number of calls relating to deterioration in children and young people. Note: Age boundaries changed in the November 2024 data collection template so this only shows data from November 2024 to January 2026.
| Age group | Family/carer calls | Patient calls | Staff calls | Total |
|---|---|---|---|---|
| 0-4 years | 120 | 0 | 17 | 137 |
| 5-12 years | 65 | 0 | 8 | 73 |
| 13-15 years | 22 | 0 | 7 | 29 |
| 16-18 years | 37 | 0 | 9 | 46 |
| Total | 244 | 0 | 41 | 285 |
8 Demographic breakdown of acute deterioration calls compared to reference population
The graphs in this section show the breakdown of acute deterioration calls by patient demographics. This is compared with the demographic breakdown of a reference population.
Please note these important caveats when interpreting this data:
- Demographics data for Martha’s Rule is only collected for those calls identified as acute deterioration. It does not account for all Martha’s Rule calls, i.e. those identified as not relating to acute deterioration. Patient demographic data is not linked to call outcomes.
- The national data relates to calls made so one patient may have used Martha’s rule escalation multiple times.
- The populations served by sites which opted into Martha’s Rule in phase 1 may not be representative of the national population as a whole. While phase 2 sites are currently implementing Martha’s Rule, the majority of Martha’s Rule calls from September 2024 to January 2026 happened in phase 1 sites.
- The reference population is all finished consultant episodes, sourced from NHS England’s Hospital Admitted Patient Care Activity data from 2024-25. A finished consultant episode refers to a period of care for a patient under a single consultant at a single hospital. This was chosen as the reference population due to its availability as a published source.
- Finished consultant episodes data reflect all inpatients, whereas Martha’s Rule data relates only to those wards where testing and implementation has begun. Therefore, caution should be taken when interpreting these results.
- The error bars in the following charts represent 95% confidence intervals, which indicate the uncertainty around the estimates for each demographic group. This means that we are 95% confident that the true population value is contained within the range represented by the confidence interval. Wider intervals mean that there is more uncertainty around the estimate for a certain group whereas narrower intervals indicate a higher level of certainty. The confidence intervals can be used to conduct statistical testing, where confidence intervals for different estimates are compared to see if they overlap. If they do not overlap, the estimates are considered significantly different.
- By comparing the demographics of acute deterioration call patients to those of a reference population, we can understand where any differences may exist. In the charts below, the bars corresponding to finished consultant episodes do not contain error bars because, due to the large size of the population, the error bars would be very small.
- The distribution of Martha’s Rule acute deterioration calls by demographic group (age, gender, ethnicity, deprivation) is compared to the distribution of the reference population to assess proportionality of access across these groups. If the proportion accessing Martha’s Rule for a certain demographic group is higher compared to the reference population, then that group is overly represented in Martha’s Rule acute deterioration calls, or under-represented if the proportion is lower compared to the reference population.
8.1 Patient age
The percentage of Martha’s Rule acute deterioration calls is highest in patients aged 19-64 and lowest in patients aged 16-18. When comparing the percentage of acute deterioration calls to the reference population, we observe that the percentage of acute deterioration calls follows the same distribution as the percentage of finished consultant episodes for most age groups. This suggests that across most age groups, the proportion of patients using Martha’s Rule is broadly in line with the proportion of inpatients under consultant care. The statistically significant differences observed, as can be seen by the non-overlapping confidence intervals displayed in Table 15, are for the age groups 0-15 and 65-74. In the age group 0-15, the percentage of Martha’s Rules deterioration calls is lower than the percentage of finished consultant episodes for the same age group and for the age group 65-74, the opposite happens.
Figure 8: The percentage of Martha’s Rule acute deterioration calls and percentage of finished consultant episodes by patients in each age group. Reporting period from November 2024 to January 2026. Note age boundaries changed in November 2024 so September 2024 – October 2024 data not included.
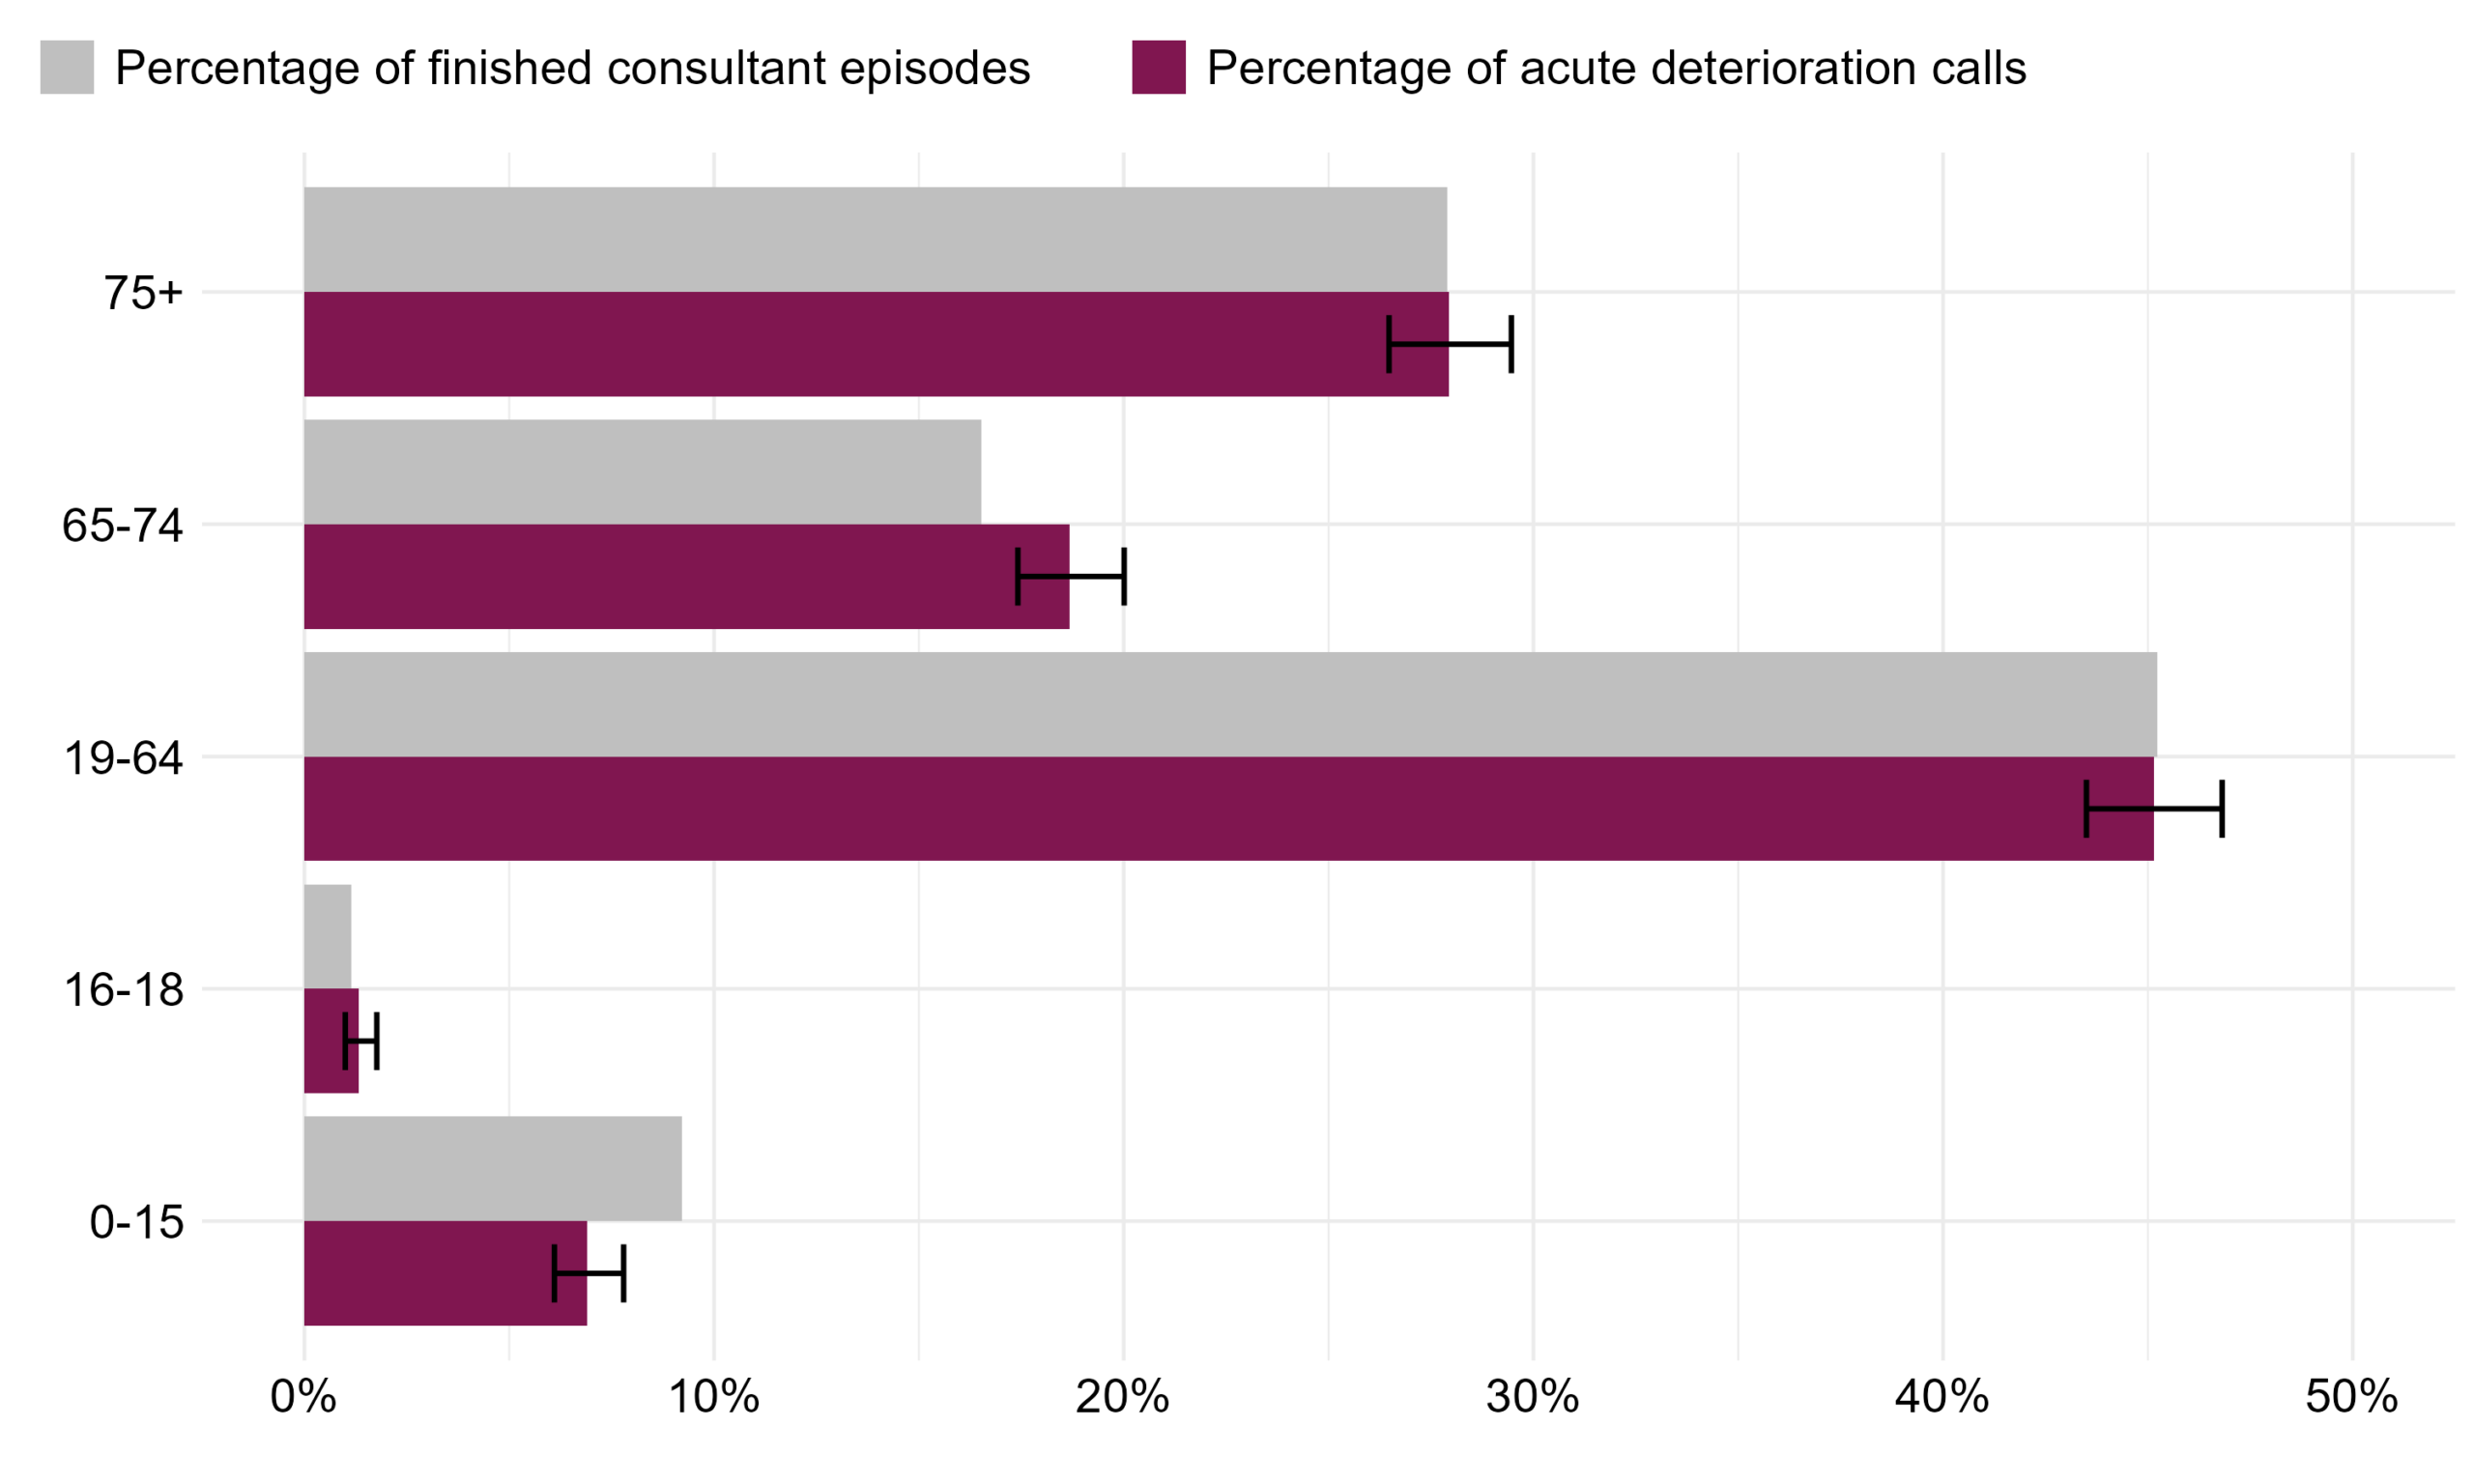
Table 10: The percentage of Martha’s Rule acute deterioration calls and percentage of finished consultant episodes by patients in each age group. Reporting period from November 2024 to January 2026. Note age boundaries changed in November 2024 so September 2024 – October 2024 data not included.
| Age group | Percentage of finished consultant episodes (95% CI) | Percentage of acute deterioration calls (95% CI) | Significant difference? |
|---|---|---|---|
| 0-15 | 9.2% (9.2%-9.2%) | 6.9% (6.1%-7.8%) | Yes |
| 16-18 | 1.1% (1.1%-1.2%) | 1.3% (1.0%-1.8%) | No |
| 19-64 | 45.2% (45.2%-45.2%) | 45.2% (43.5%-46.8%) | No |
| 65-74 | 16.5% (16.5%-16.5%) | 18.7% (17.4%-20.0%) | Yes |
| 75+ | 27.9% (27.9%-27.9%) | 27.9% (26.5%-29.5%) | No |
8.2 Patient gender
The percentage of Martha’s Rule acute deterioration calls is higher in female patients than their male counterparts and follows a similar distribution as the percentage of finished consultant episodes, meaning that use of Martha’s Rule is comparable to care for all inpatients by gender. The percentage of Martha’s Rules deterioration calls in the not stated, non-binary or other gender group is statistically significantly higher than the percentage of finished consultant episodes. The difference observed in the not stated, non-binary or other gender group may be a result of differences in how this group is defined in the reference population and in Martha’s Rule. In the reference population, this group accounts for people with indeterminate gender or gender not known (not recorded), whereas in Martha’s Rule, the group includes gender non-binary, other (not listed) gender or gender not stated.
Figure 9: The percentage of Martha’s Rule acute deterioration calls and percentage of finished consultant episodes by gender. Whether the gender identity matches the sex assigned at birth is reported as part of Martha’s Rule but does not exist in the comparator dataset. Reporting period from September 2024 to January 2026.
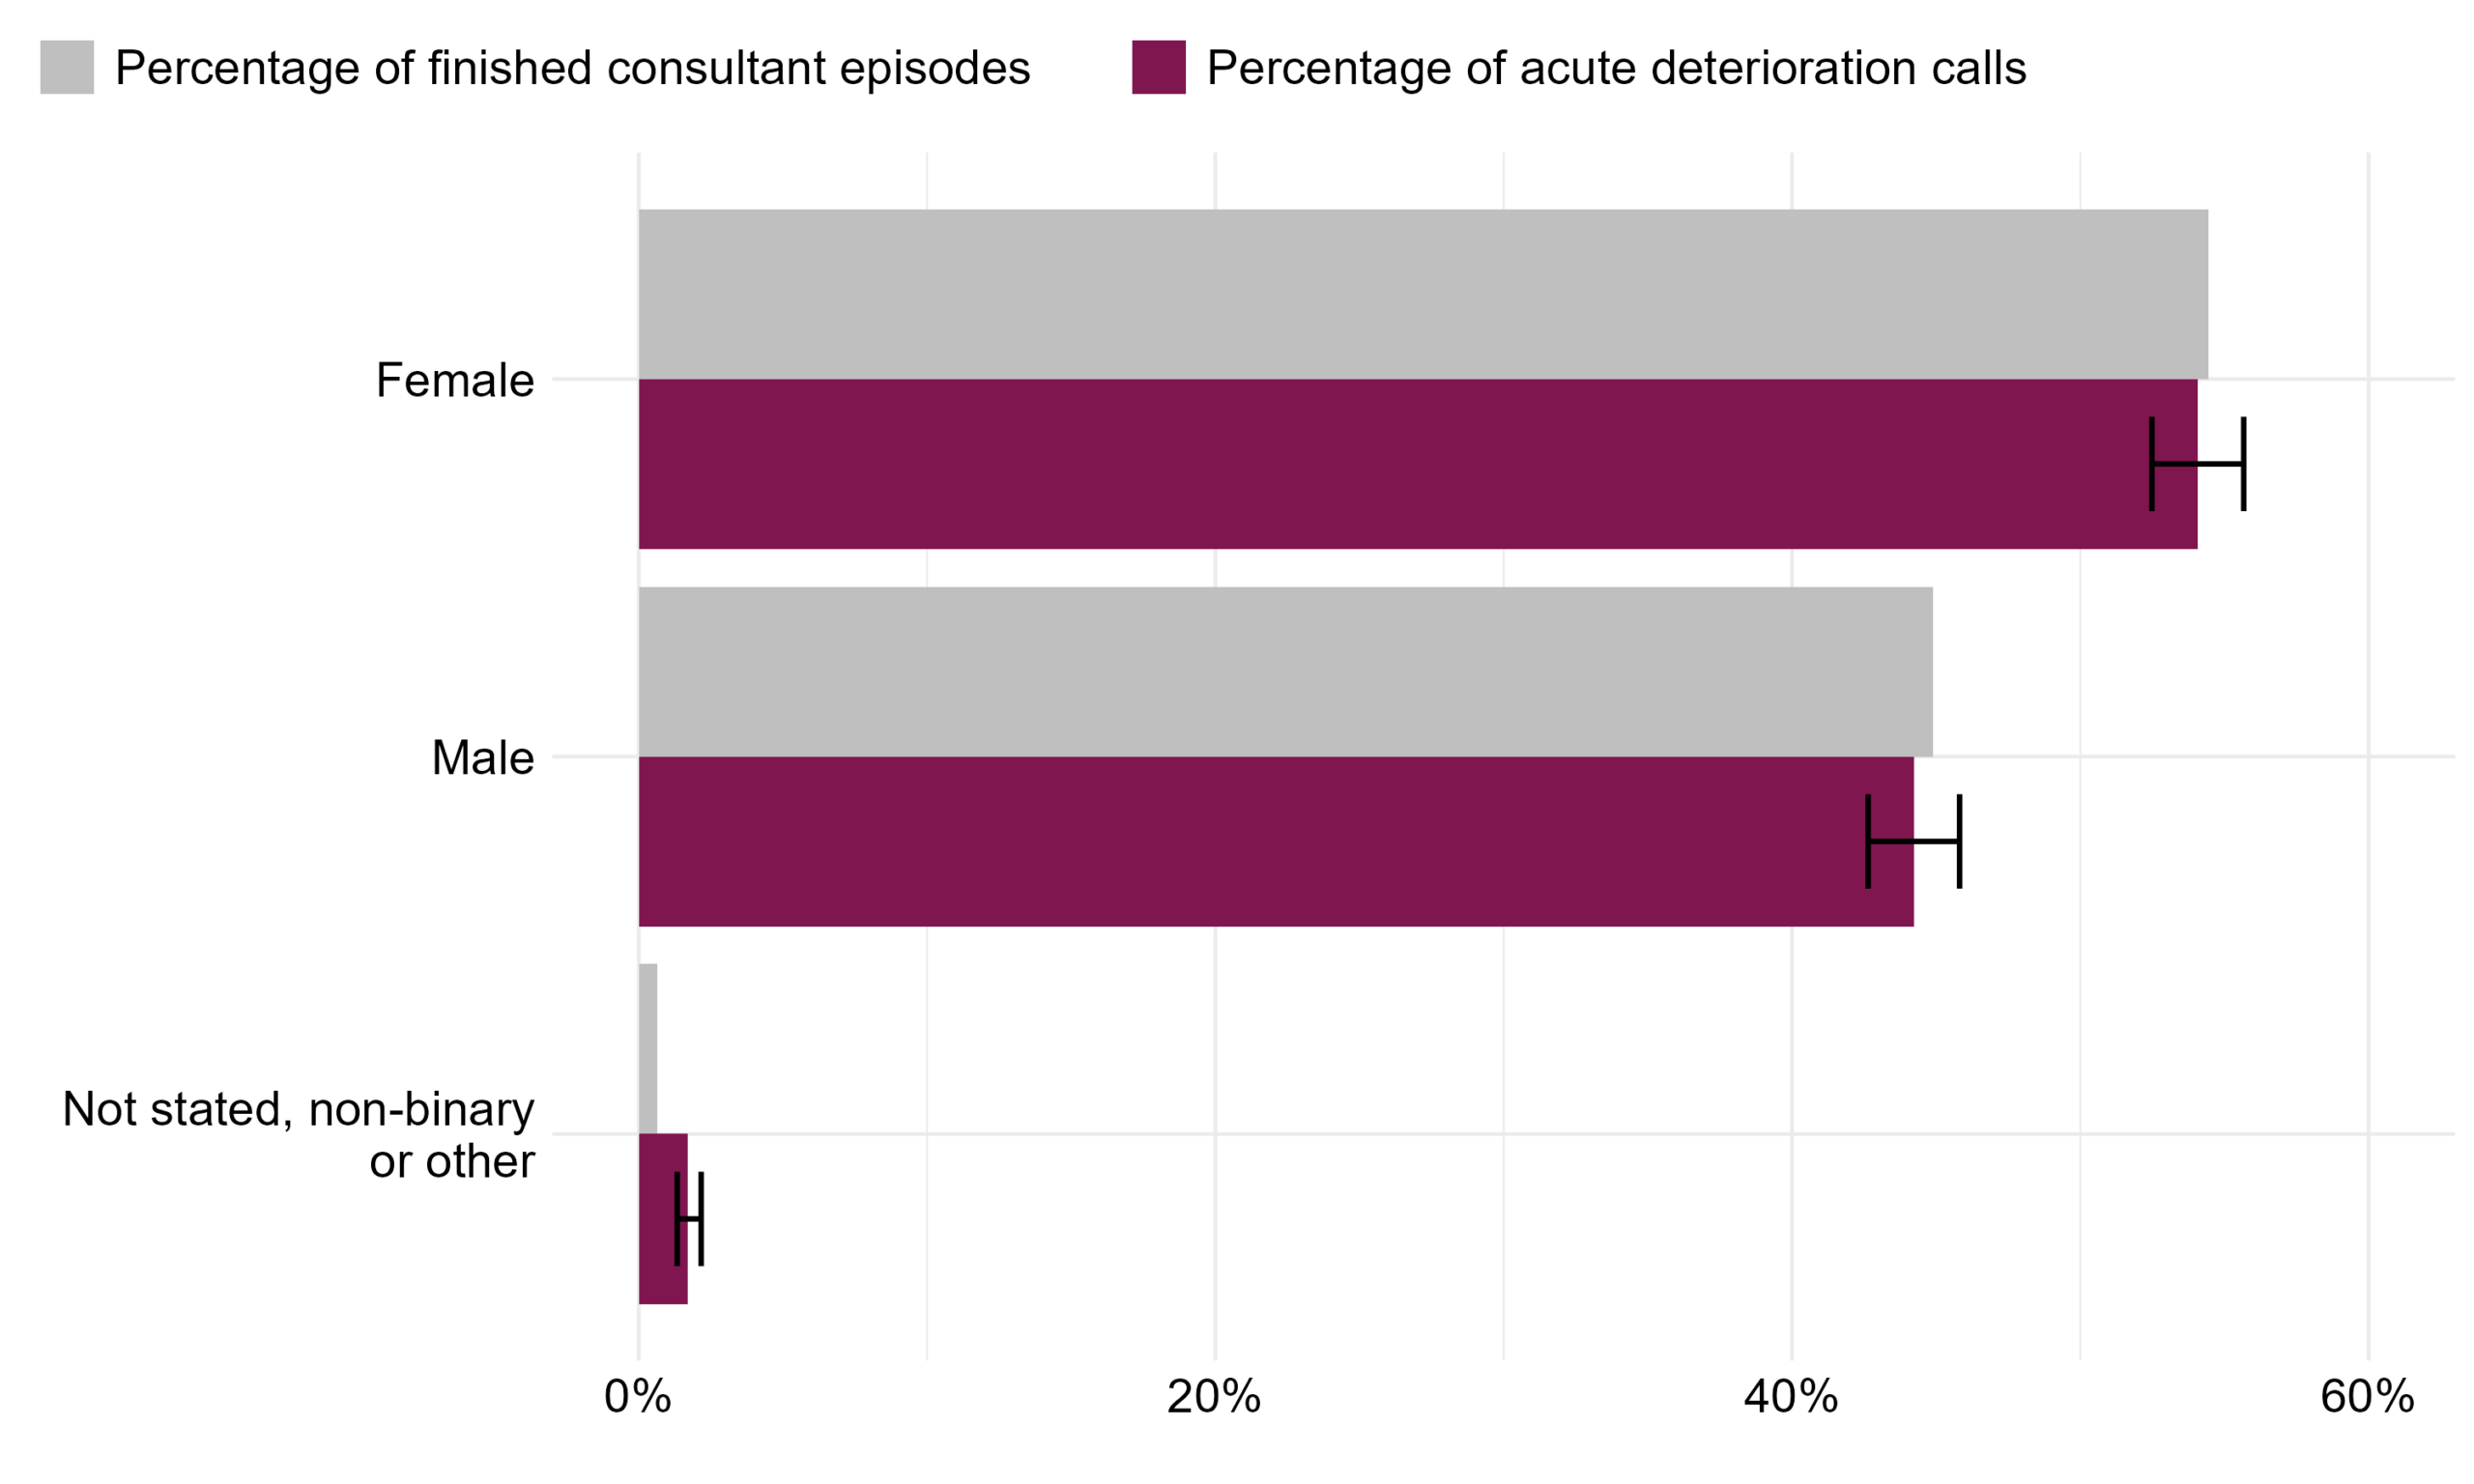
Table 11: The percentage of Martha’s Rule acute deterioration calls and percentage of finished consultant episodes by gender. Whether the gender identity matches the sex assigned at birth is reported as part of Martha’s Rule but does not exist in the comparator dataset. Reporting period from September 2024 to January 2026.
| Gender | Percentage of finished consultant episodes (95% CI) | Percentage of acute deterioration calls (95% CI) | Significant difference? |
|---|---|---|---|
| Male | 44.9% (44.9%-44.9%) | 44.2% (42.6%-45.8%) | No |
| Female | 54.5% (54.4%-54.5%) | 54.1% (52.5%-55.7%) | No |
| Not stated, non-binary or other | 0.7% (0.7%-0.7%) | 1.7% (1.3%-2.2%) | Yes |
8.3 Patient ethnicity
The percentage of Martha’s Rule acute deterioration calls is highest in patients from White ethnic groups and lowest in patients from Mixed ethnic groups, following a similar distribution as the percentage of finished consultant episodes. However, there is a statistically significant difference between the two populations for White ethnic groups and Other ethnic groups, which is shown by the non-overlapping confidence intervals in Table 17. There is a statistically significant lower percentage of Martha’s Rule acute deterioration calls made by patients of Other ethnic groups than the percentage of finished consultant episodes in the same ethnic groups.There is a statistically significant higher percentage of Martha’s Rule acute deterioration calls made by patients from White ethnic groups than the percentage of finished consultant episodes in that same ethnic group.
Figure 10: The percentage of Martha’s Rule acute deterioration calls and percentage of finished consultant episodes by ethnicity. Ethnic categories have been grouped for the purpose of this report; for the full list of ethnic categories please see the ethnic category entry in the NHS Data Dictionary. Reporting period from September 2024 to January 2026.
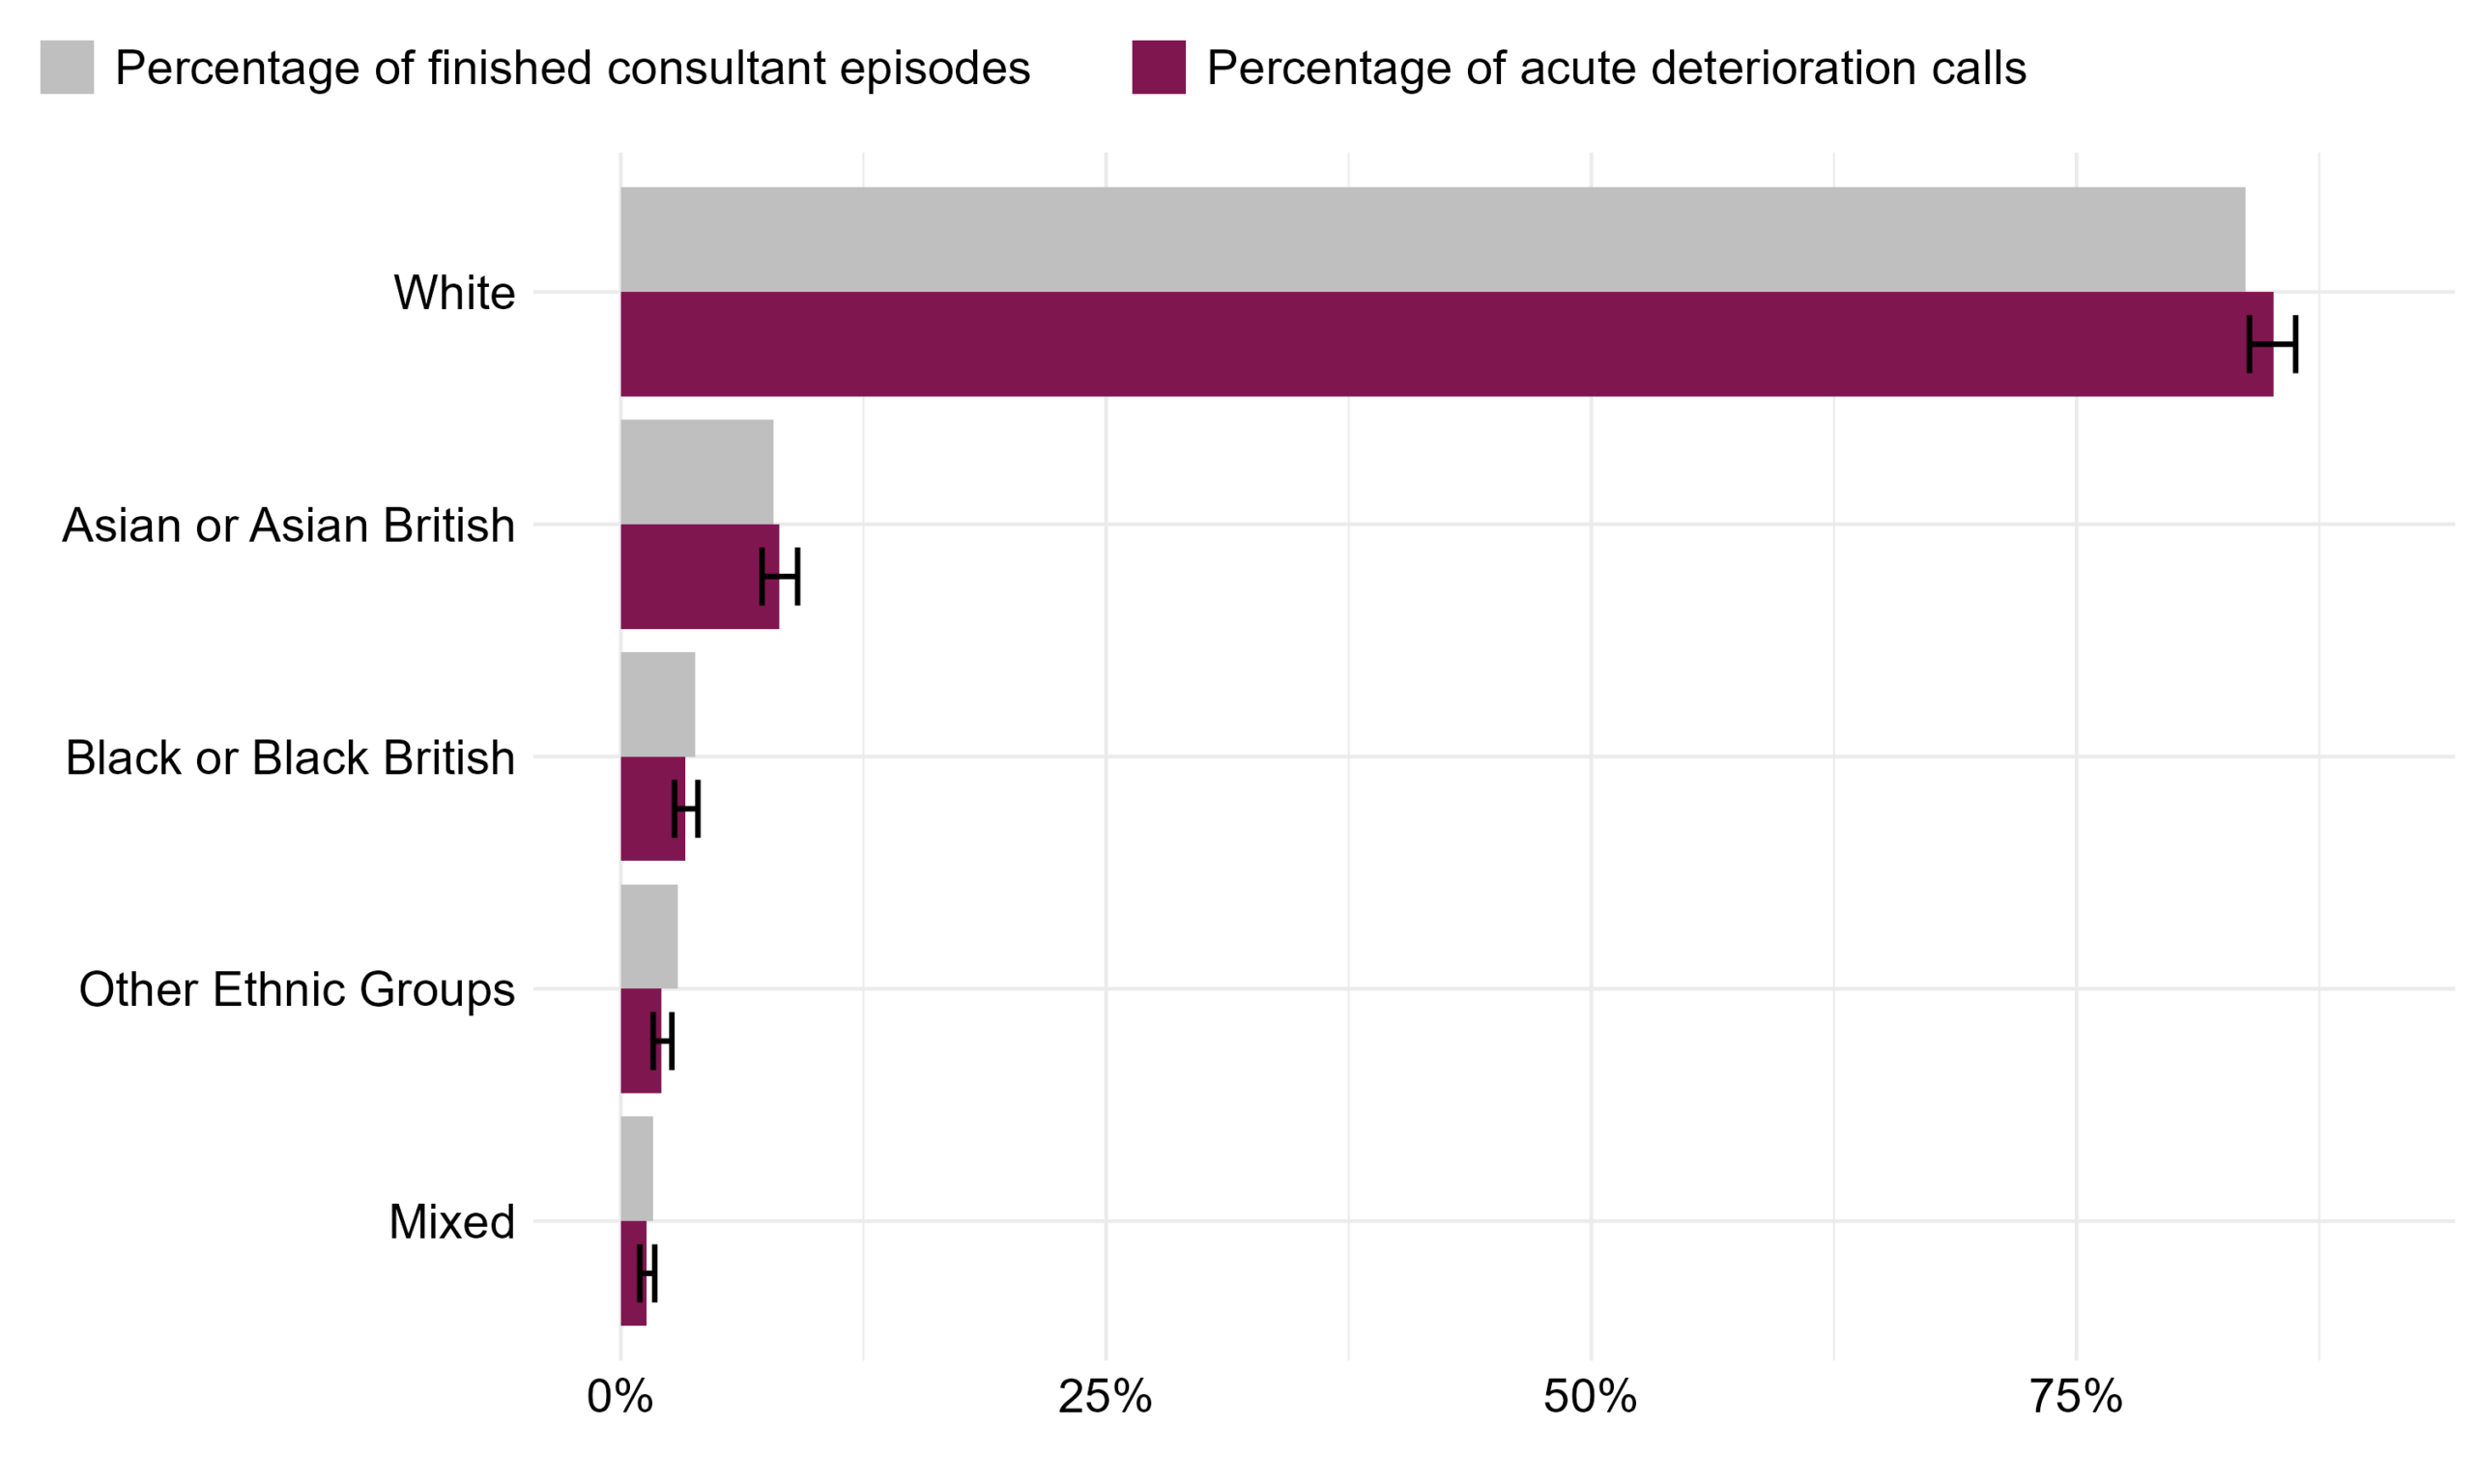
The not stated/ unknown group has been removed from Figure 15 and Table 17. This accounts for 13% of finished consultant episodes and 9% of acute deterioration calls.
Table 12: The percentage of Martha’s Rule acute deterioration calls and percentage of finished consultant episodes by ethnicity. Ethnic categories have been grouped for the purpose of this report; for the full list of ethnic categories please see the ethnic category entry in the NHS Data Dictionary. Reporting period from September 2024 to January 2026.
| Ethnicity | Percentage of finished consultant episodes (95% CI) | Percentage of acute deterioration calls (95% CI) | Significant difference? |
|---|---|---|---|
| White | 83.7% (83.7%-83.7%) | 85.1% (83.9%-86.3%) | Yes |
| Asian or Asian British | 7.9% (7.9%-7.9%) | 8.1% (7.3%-9.1%) | No |
| Black or Black British | 3.8% (3.8%-3.8%) | 3.3% (2.8%-4.0%) | No |
| Other Ethnic Groups | 2.9% (2.9%-2.9%) | 2.1% (1.7%-2.6%) | Yes |
| Mixed | 1.7% (1.7%-1.7%) | 1.3% (1.0%-1.7%) | No |
8.4 Patient deprivation
Deprivation is taken from the Index of Multiple Deprivation (IMD), published by the Office for National Statistics (ONS), which measures relative deprivation between small areas of England. These small areas are then ranked by deprivation and divided into five sections, or quintiles. A lower quintile represents that the patient is from an area with relatively more deprivation and a higher quintile represents that the patient is from an area with relatively less deprivation.
The percentage of Martha’s Rule acute deterioration calls is the highest in patients belonging to the most deprived IMD quintile (quintile 1) and lowest in patients belonging to the least deprived IMD quintile (quintile 5). When comparing to the percentage of finished consultant episodes, we can observe that the percentage of Martha’s Rule acute deterioration calls is significantly higher in the most deprived quintile vs those of the same quintile in the reference population. This indicates that patients in the most deprived quintile are using Martha’s Rule more than expected when comparing to those of the same quintile in the reference population. This difference is statistically significant as seen by the non-overlapping confidence intervals in Table 18. The same can be said for those belonging to quintile 2. The confidence intervals also show a statistically significant difference in quintiles 4 and 5, where there is a higher percentage of finished consultant episodes for patients belonging to these deprivation groups than Martha’s Rules acute deterioration calls in the corresponding groups.
Figure 11: The percentage of Martha’s Rule acute deterioration calls and percentage of finished consultant episodes by deprivation quintile. Reporting period from September 2024 to January 2026.
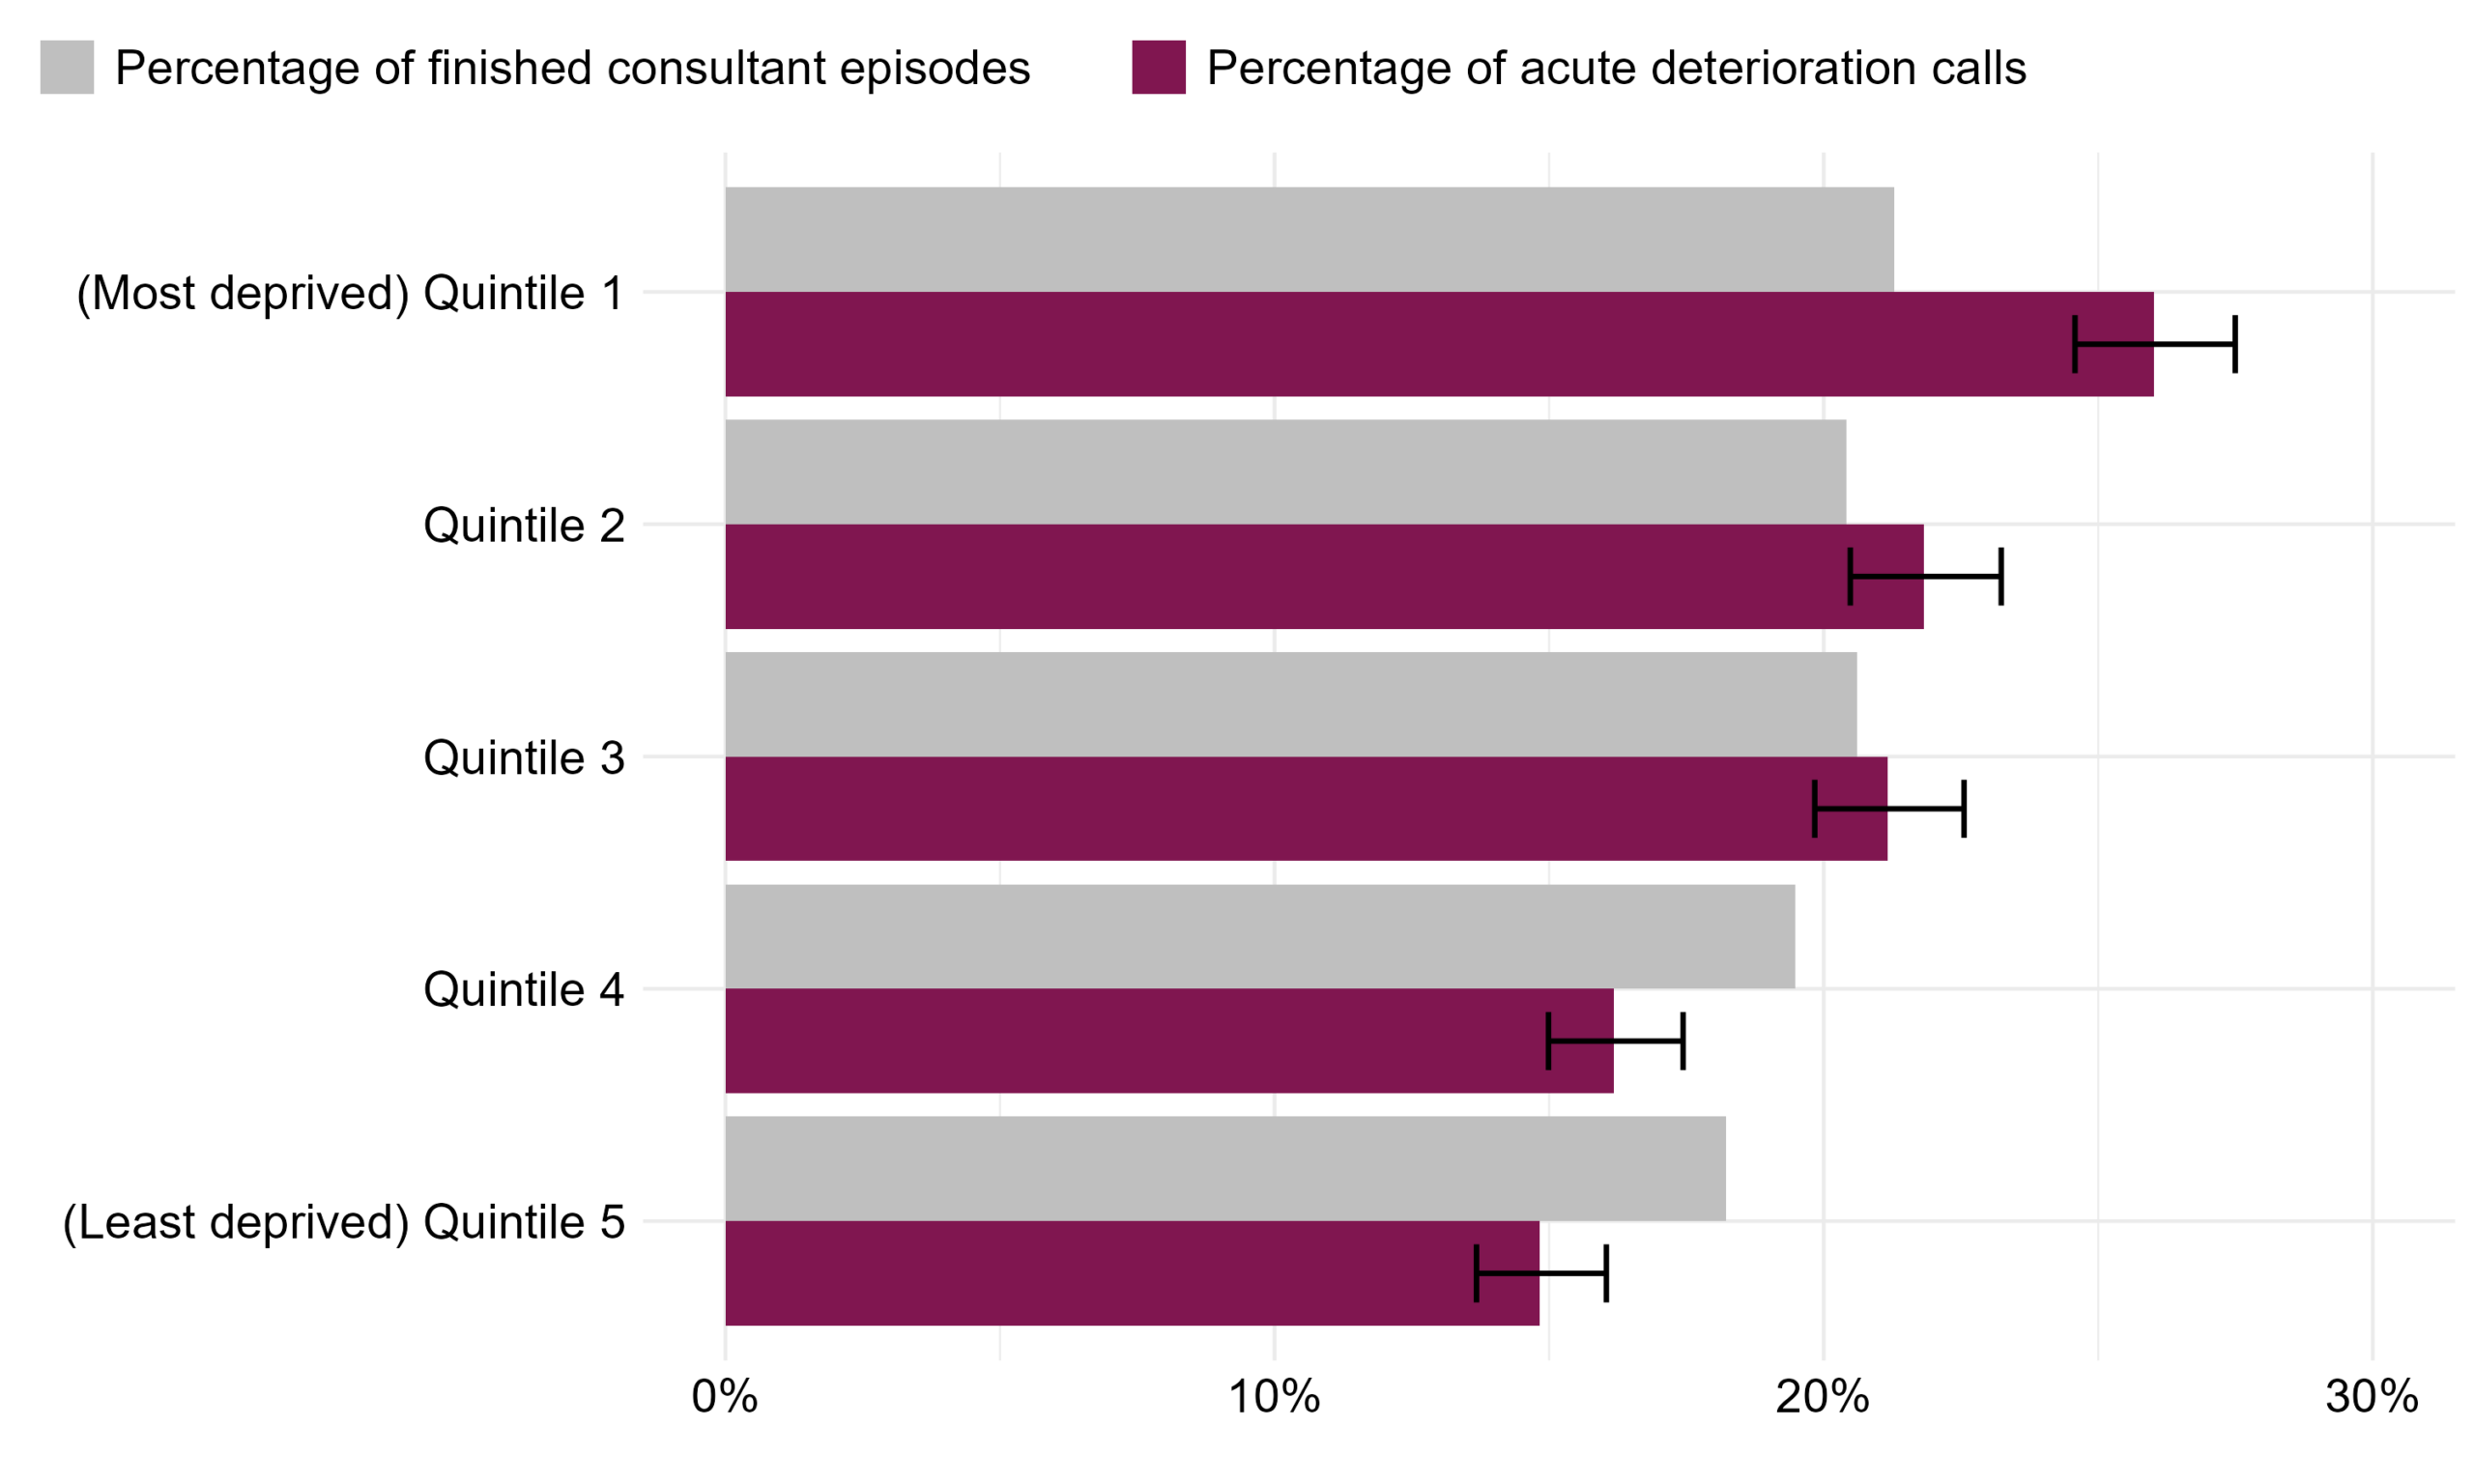
The not stated/ unknown group has been removed from Figure 16 and Table 18. This accounts for 3% of finished consultant episodes and 7% of acute deterioration calls.
Table 13: The percentage of Martha’s Rule acute deterioration calls and percentage of finished consultant episodes by deprivation quintile. Reporting period from September 2024 to January 2026.
| Quintile | Percentage of finished consultant episodes (95% CI) | Percentage of acute deterioration calls (95% CI) | Significant difference? |
|---|---|---|---|
| Quintile 1 (Most deprived) | 21.3% (21.3%-21.3%) | 26.0% (24.6%-27.5%) | Yes |
| Quintile 2 | 20.4% (20.4%-20.4%) | 21.8% (20.5%-23.2%) | Yes |
| Quintile 3 | 20.6% (20.6%-20.6%) | 21.2% (19.8%-22.6%) | No |
| Quintile 4 | 19.5% (19.5%-19.5%) | 16.2% (15.0%-17.4%) | Yes |
| Quintile 5 (Least deprived) | 18.2% (18.2%-18.2%) | 14.8% (13.7%-16.0%) | Yes |
8.5 Patient learning disability
From September 2024 to January 2026, 150 of 3,763 Martha’s Rule acute deterioration calls (4%) related to patients with a recorded learning disability. This information was not available in the reference population. Approximately 2% of the population are believed to have a learning disability, but research suggests these patients are more likely to be admitted to hospital and so we can expect inpatient rates to be higher than this (Sources section: 1, 2).
8.6 Patient language
From June 2025 to January 2026, 55 of 1,811 Martha’s Rule acute deterioration calls (3%) related to patients whose language was not recorded to be English. This information was not available in the reference population. Note: the definition of this question changed in June 2025 from asking the language of the caller to the language of the patient. Therefore, this metric could only be calculated from that month.
9 Data quality notes
- Not all sites respond each month and the data excludes the submissions that had to be removed due to data quality issues. Therefore, different sites may submit information each month.
- The national data relates to calls made and thus one patient may have used Martha’s rule escalation multiple times.
- This data is true as of the time it was extracted, some of these figures may change subject to sites re-submitting.
- Where data quality issues were identified, these submissions were removed. This impacted 7 different sites over 7 different months (8 submissions in total).
- One phase 2 site submitted data between Sep-24 and Jul-25; this early data was therefore excluded.
- 13 phase 2 sites submitted data in Jul-25; this early data was also therefore excluded.
10 Glossary
Table 14: Glossary of terms.
| Term | Definition |
|---|---|
| Martha’s Rule | Martha’s Rule is a patient safety initiative to support the early detection of deterioration by ensuring the concerns of patients, families, carers and staff are listened to and acted upon. |
| Escalation | The process of raising concerns about a patient’s deteriorating condition to ensure appropriate clinical review. |
| HDU/ICU | High Dependency Unit/Intensive Care Unit – a specialised setting within hospitals that manage patients who are critically ill and/or require additional support that cannot be provided in an in-patient ward setting. |
| Acute deterioration | Acute physical deterioration is the rapid worsening of health from a patient’s baseline. It can be identified from changes in physiology (such as respiratory rate, blood pressure or consciousness), or more subtle signs (such as not eating or a patient’s or family’s report of a change in sense of wellness, mental status or behaviour). |
| Acute deterioration call | A Martha’s Rule escalation call that has been reviewed and identified as relating to acute deterioration. |
| PCC | PCC refers to paediatric critical care. The PCC definitions for level 1, 2, and 3 can be found on the Paediatric Critical Care Society’s website. |
| Patient Wellness Question (PWQ) | Core component of the Martha’s Rule programme where patients will be asked, at least daily, about how they are feeling and if they are getting better or worse. This information will be acted on in a structured way. |
| Early Warning Score (EWS) | Standardised clinical tool for recording, scoring, and responding to changes in routine physiological measurements. Its purpose is to identify deterioration and ensure patients receive timely intervention. |
| Standard escalation process | Review by a critical or paediatric care outreach team or alternative, as defined by the hospital’s Standard Operating Procedures. |
11 Sources
- How Common Is Learning Disability In The UK? How Many People Have A Learning Disability? | Mencap
- Dunn, K., Hughes‐McCormack, L. and Cooper, S. (2017) ‘Hospital admissions for physical health conditions for people with intellectual disabilities: Systematic review’, Journal of Applied Research in Intellectual Disabilities, 31(S1), pp. 1–10. doi:10.1111/jar.12360.
12 Additional information
The Martha’s Rule Programme is led by the National Director of Patient Safety in NHS England. The implementation is being led and facilitated by the National Patient Safety team in partnership with the National Nursing Directorate.
Data source: the Martha’s Rule Data Collection.
13 Future publications
Your feedback is welcome on the format, frequency and utility of this document, so that we can provide reports that are of most benefit. Please contact patientsafety.analysis@nhs.net with any suggestions.