
Quarter 3 2024/25 (October to December 2024)
Patient Safety Event Data Quarterly Publication
Revised publication
- This is a planned revision which supersedes the Q3 2024/25 publication originally published on 10th April 2025
- Overall, the number of patient safety events decreased by 0.3% from the original publication. LFPSE is a live system and records can be added and deleted at any time.
- This revision adds patient safety event recording rates by NHS trust, using bed days as a proxy to standardise their overall activity.
- This revision includes formatting changes to improve accessibility and readability.
1 National Patient Safety Data Context
1.1 Transition of recording systems
NHS England previously published official statistics using National Reporting Learning Service (NRLS) patient safety incident data: the National Patient Safety Incident Reports (NaPSIR), and Organisation Patient Safety Incident Reports (OPSIR). In addition, we published monthly summary data which complemented our official statistics data reports.
However, due to its aging infrastructure, NRLS was withdrawn on 30th June 2024, and replaced by the Learn from Patient Safety Events (LFPSE) service, which has been operating since July 2021. You can read more about the new service here. Transition of all secondary care providers from the old system to the new was completed in 2024. This is the first experimental publication of statistics relating to LFPSE, and as a result there are some key differences between NRLS and LFPSE which should be considered when interpreting this data. The change contributes significantly to the alteration of data output in our new official publications.
NRLS submissions required manual extract and upload, whereas LFPSE submissions occur in real time, including any updates made to records after their initial submission as the provider works towards a full and accurate picture of the event over time.
NRLS used older definitions, and was primarily used by secondary care providers, due to its reliance on secondary-use data inputted to Local Risk Management System (LRMS) software, which varies from provider to provider.
LFPSE offers an interface for providers without LRMS software to use the same tools, making it more accessible to primary care and other settings, as well as supporting submissions from private healthcare providers.
This means that NRLS and LFPSE data are not comparable, and we expect to see differences in recording patterns and usage through the transition period and beyond. This is also true for the taxonomies (question set, and answer options), as the taxonomies used within LFPSE have been updated to capture more mechanistic details of how things go wrong, to allow us to develop targeted interventions to improve safety where they will be most effective.
Although connection to the LFPSE service is now a contractual obligation, LFPSE operates as NRLS did in terms of being a largely voluntary system. Decisions on which events to record are not mandatory, except where recording a death or instance of severe harm fulfills mandatory notification requirements. Providers are encouraged to record as much as they can, and particularly what is thought useful for national learning. The same caution should therefore be applied when interpreting data which represents the numbers of events recorded, and not the number of actual events that occurred. Data principles setting out how LFPSE data can and cannot be used are available here.
We publish quarterly official statistics in development on events recorded to the Learn from patient safety events (LFPSE) service. This quarterly publication is based on patient safety event records submitted between October 2024 and December 2024.
1.2 Patient Safety Incident Definition
The LFPSE service defines a patient safety incident as: ‘something unexpected or unintended has happened, or failed to happen, that could have or did lead to patient harm for one or more person(s) receiving healthcare’. Full details of the definitions and harm gradings are available here.
LFPSE also captures three other patient safety event types: outcomes of concern, risks to patient safety, and instances of good care. Throughout this report, with the exception of table 1, we will be using patient safety incidents only, which constitute the vast majority of patient safety events data recorded to LFPSE. Future versions of this publication will encompass other event types.
2 Data quality information
2.1 Interpreting the data
National data collected by LFPSE comes mainly as a secondary use from what is recorded by staff into local risk management systems (LRMSs). Currently NHS acute providers submit most records we receive. However, anyone can record a patient safety event on the service: they may be healthcare staff from any NHS or private provider, patients or members of the public. LFPSE data is submitted voluntarily to foster openness and encourage continual increases in recording This means LFPSE data does not, and cannot, provide the definitive number of patient safety events occurring in the NHS; it measures the number of safety events recorded. The number of recorded safety events has increased year on year, which likely reflects improved recording culture and cannot necessarily be interpreted as the NHS becoming less safe. A ‘low’ recording rate for an organisation should not necessarily be interpreted as a ‘safe’ environment; it may represent under-recording. Conversely a ‘high’ recording rate should not be interpreted as ‘unsafe’; it may represent a more open culture. With this in mind, the calculated rates should not be used for direct comparisons between trusts. This document was extracted on 4th June 2025 and serves as a quarterly snapshot of the data currently held in LFPSE. Any figures reported are subject to change as records get updated into the system.
2.2 Missing values
Missing values have been handled and removed from the tables and plots, so the total counts will vary across tables.
2.3 Cleansing
Records that have been submitted with patient identifiable information and are yet to be anonymised will not appear in these data. Records that have submitted and subsequently updated that contain patient identifiable information, and are yet to be re-anonymised, will be displayed as their previous version in these data until anonymised.
2.4 Event types
LFPSE brings the feature to record patient safety event types beyond incidents. Recorders can now also upload patient safety risks, outcomes, and instances of good care. This is to ensure the database contains more instances of care that the healthcare system can learn from instead of only detailing errors involving patients. In the current period, 814,560 events were recorded to LFPSE, the majority of which were recorded as patient safety incidents (96.46%).
Table 1: Count of the event types in LFPSE
Based on patient safety event records submitted between October 2024 and December 2024.
| Event type | Number of events | Percentage |
|---|---|---|
| Incident | 785,696 | 96.46% |
| Good care | 12,566 | 1.54% |
| Risk | 10,429 | 1.28% |
| Outcome | 5,869 | 0.72% |
| Total | 814,560 | – |
| Note: A further 105 records did not contain an event type category |
Figure 1: Total patient safety incidents recorded per month for the NRLS and LFPSE
This plot illustrates the recording transition of patient safety incidents from the NRLS to LFPSE. Based on patient safety incident records from January 2021 to September 2024.
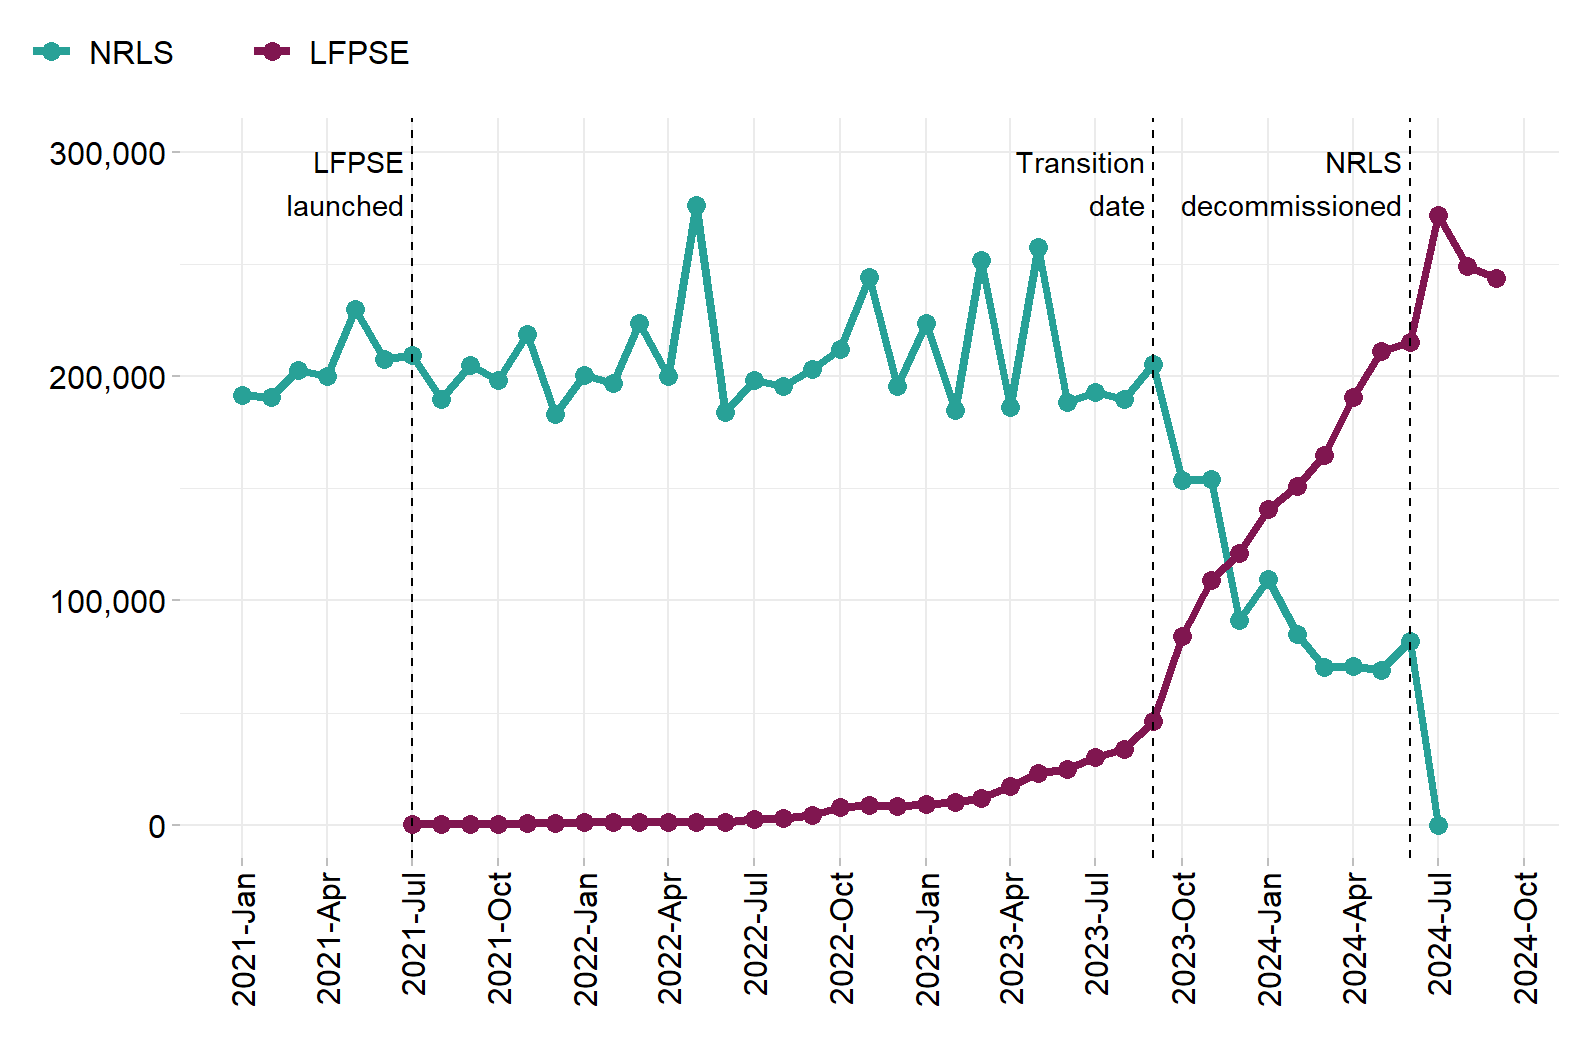
Table 2: Total patient safety incidents reported per month for the NRLS and LFPSE
This table illustrates the number of patient safety incidents per month recorded to the NRLS and LFPSE. Based on patient safety incident records from January 2021 to September 2024.
| Month of Reporting | Count of NRLS Incidents | Count of LFPSE Incidents |
|---|---|---|
| 2021-Jan | 191,701 | – |
| 2021-Feb | 190,761 | – |
| 2021-Mar | 202,676 | – |
| 2021-Apr | 199,960 | – |
| 2021-May | 229,785 | – |
| 2021-Jun | 207,684 | – |
| 2021-Jul | 209,125 | 159 |
| 2021-Aug | 189,866 | 524 |
| 2021-Sep | 204,842 | 548 |
| 2021-Oct | 198,414 | 565 |
| 2021-Nov | 218,778 | 957 |
| 2021-Dec | 183,078 | 865 |
| 2022-Jan | 200,231 | 1,128 |
| 2022-Feb | 196,875 | 1,241 |
| 2022-Mar | 223,588 | 1,307 |
| 2022-Apr | 200,089 | 1,178 |
| 2022-May | 276,300 | 1,393 |
| 2022-Jun | 183,903 | 1,417 |
| 2022-Jul | 198,032 | 2,592 |
| 2022-Aug | 195,557 | 3,016 |
| 2022-Sep | 203,216 | 4,220 |
| 2022-Oct | 211,897 | 7,864 |
| 2022-Nov | 244,274 | 8,952 |
| 2022-Dec | 195,360 | 8,483 |
| 2023-Jan | 223,640 | 9,321 |
| 2023-Feb | 185,053 | 10,023 |
| 2023-Mar | 251,566 | 11,717 |
| 2023-Apr | 186,301 | 17,382 |
| 2023-May | 257,594 | 22,863 |
| 2023-Jun | 188,598 | 24,690 |
| 2023-Jul | 192,892 | 30,383 |
| 2023-Aug | 189,666 | 33,594 |
| 2023-Sep | 205,523 | 46,134 |
| 2023-Oct | 153,529 | 84,060 |
| 2023-Nov | 153,983 | 109,194 |
| 2023-Dec | 91,312 | 120,963 |
| 2024-Jan | 109,311 | 140,736 |
| 2024-Feb | 85,024 | 150,752 |
| 2024-Mar | 70,199 | 164,940 |
| 2024-Apr | 70,541 | 190,795 |
| 2024-May | 68,889 | 210,975 |
| 2024-Jun | 81,858 | 214,950 |
| 2024-Jul | 110 | 271,801 |
| 2024-Aug | – | 248,944 |
| 2024-Sep | – | 243,788 |
3 Recording patterns by physical harm
3.1 Psychological harm
LFPSE has a new variable for grading of the psychological harm associated with the recorded patient safety incidents. This is an experimental field which seeks to explore if responses to safety incidents need to be different if psychological harm is considered separately from physical harm, rather than rolling them together into one measure, as was done in the National Reporting Learning Service (NRLS). Currently, there is low confidence in the grading of psychological harm, as users familiarise themselves with its use, and as such, it is excluded from this report.
3.2 Physical harm
Grading the degree of harm to a patient resulting from a patient safety incident can be a challenge for recorders, but by grading patient safety incidents according to the harm they cause patients, local organisations can ensure consistency and comparability of data. This consistent approach locally will enable LFPSE to compare, analyse and learn from data nationally. This grading can also be used to “triage” incidents for review both locally and nationally, ensuring the most serious events are looked at first.
3.3 Harm policy
For more information on harm grading please see the harm grading policy guidelines.
Sometimes a problem in care can affect more than one patient, or none at all. To capture this, as a new feature of LFPSE, recorders can submit information for multiple patients per incident, meaning there can be multiple degrees of harm per incident. For the following figure and table we have taken the highest harm level per incident. During this quarter, 725,044 incidents had recorded a degree of harm. The majority of these incidents (93.67%) recorded low or no physical harm to patients.
Figure 2: Count of patient safety incidents by maximum physical harm
Based on patient safety incidents records submitted between October 2024 and December 2024.
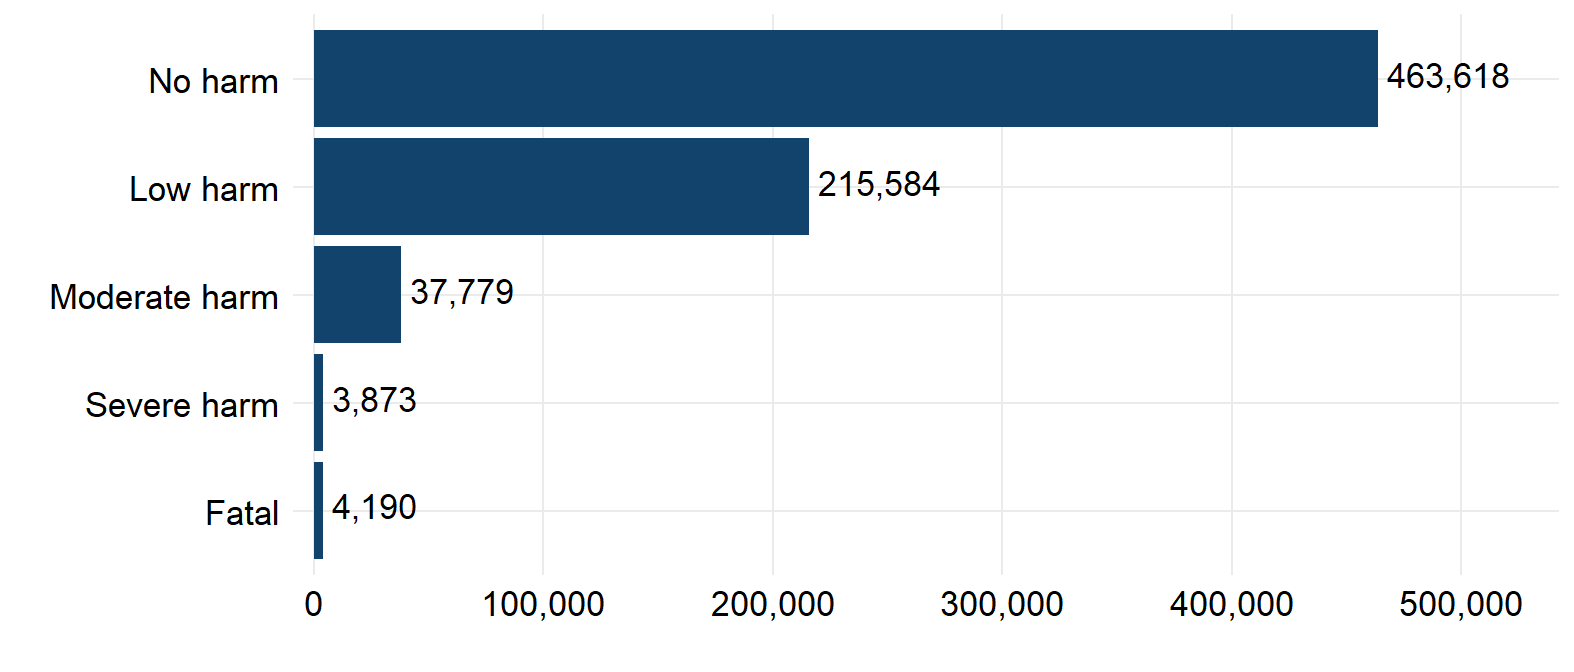
Table 3: Count of patient safety incidents by maximum physical harm
Based on patient safety incidents records submitted between October 2024 and December 2024.
| Maximum level of physical harm | Count of recorded incidents | Percentage |
|---|---|---|
| No harm | 463,618 | 63.94% |
| Low harm | 215,584 | 29.73% |
| Moderate harm | 37,779 | 5.21% |
| Severe harm | 3,873 | 0.53% |
| Fatal | 4,190 | 0.58% |
| Total | 725,044 | – |
| Note: A further 60,652 incidents did not contain a harm type category |
4 Recording by service area
LFPSE taxonomy is periodically updated based on the insight/value they provide as well as data capture and user experience. This means there will be some variability between the data captured under different versions. In the plot below, we have grouped some granular categories into broader service groups to account for differences in the recording of service areas between version 5 (used by the majority of the LRMS users) and version 6 (used in the online forms).
- ‘Maternity inpatient services’, ‘Maternity community services’ and ‘Maternity services (inpatient or community)’, have been coalesced to ‘Maternity Services (inpatient or community)’
- ‘Mental health community services’, ‘Mental health services (inpatient or community)’ and ‘Mental health inpatient services’, have been coalesced to ‘Mental Health Services (inpatient or community)’
- ‘GP including out-of-hours services and minor injury units’, ‘GP including out-of-hours services’ and ‘Minor injury unit (MIU) / Urgent treatment centre’, have been coalesced to ‘GP including out-of-hours services and minor injury units’
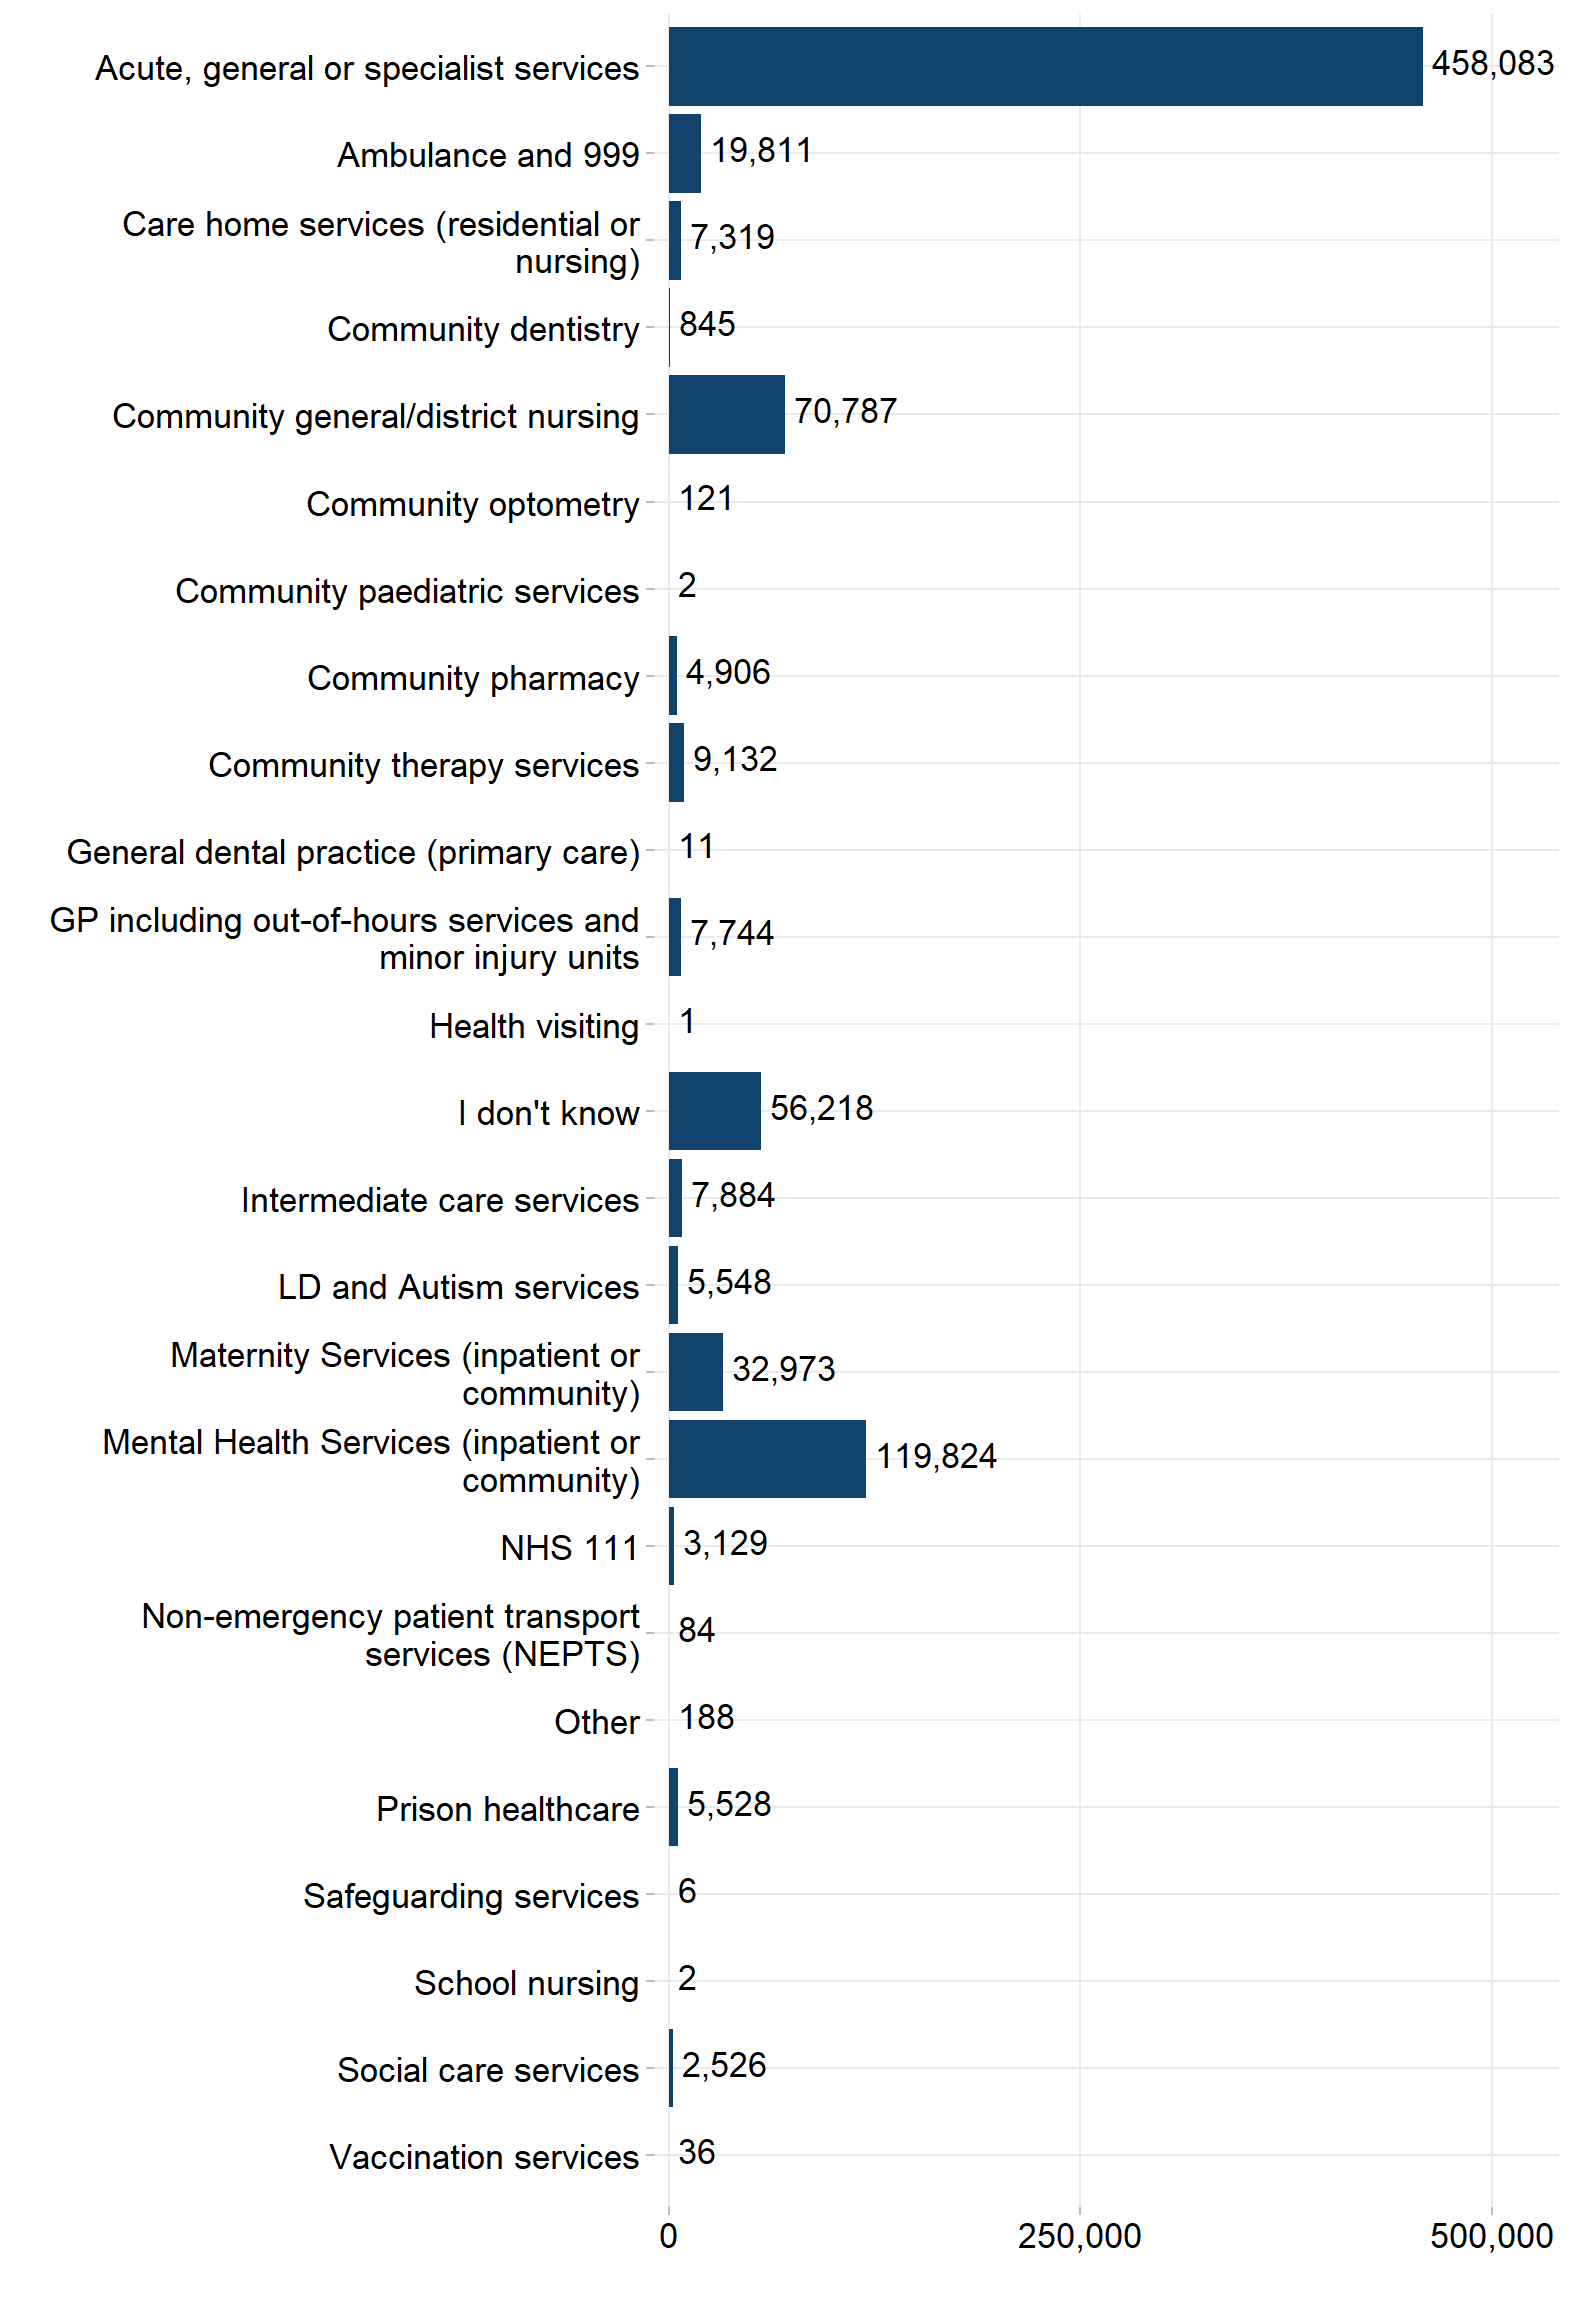
The service area variable can contain multiple responses if the incident occurred in more than one area. As a result, some incidents will be counted more than once, so the figures here cannot be totalled without double-counting records. 785,035 incidents recorded a service area this quarter. The majority of these (58.4%) were recorded under acute, general or specialist services. The remaining were spread primarily across mental health, community, and maternity services. A further 661 records did not contain a value for service area and are subsequently missing.
Figure 3: Count of incident records by service area
Based on patient safety incidents records submitted between October 2024 and December 2024.
The aggregate data displayed below can be downloaded as a CSV file.
5 Recording lag
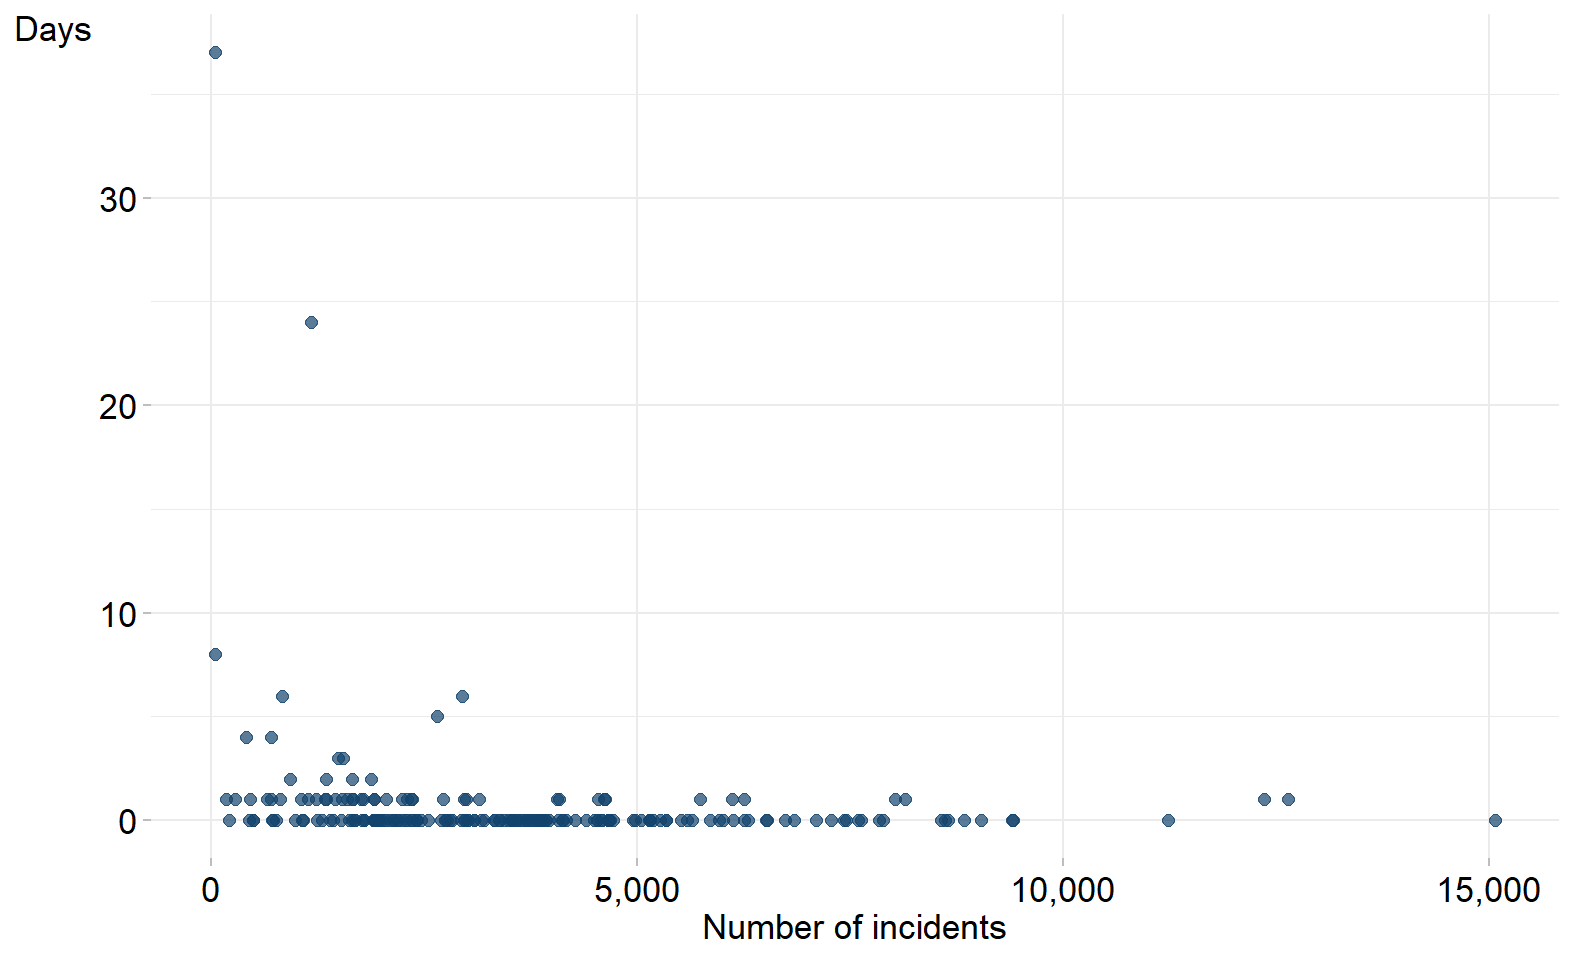
Recording lag for patient safety events is measured as the difference in the number of days between the date the patient safety incident occurred and the date that it was recorded to LFPSE. The median lag is then taken to minimise the effect of any outliers (such as events which only become apparent many years after occurring). In the current period there are 4,357 patient safety incidents without an incident occurring date and therefore a lag could not be calculated for these records.
In the financial year ending March 2022 (the latest period for which data is published), the median lag for recording into the NRLS was 20 days. In LFPSE for the current recording period, the equivalent figure was 0.0416667 days. This reduction is due to the live nature of LFPSE, replacing the requirement for providers to manually extract and upload data as was the case for NRLS. The majority of NHS Trusts (73.3%) recording to the LFPSE have a recording lag of 0 days. For the remainder of organisations, recording lag ranged from 1 to 37 days
Figure 4: Median recording lag (in days) by number of incidents, across NHS trusts
Based on patient safety incident records submitted between October 2024 and December 2024.
6 Recording rates
The recording rates for each NHS trust was calculated using the formula:

Bed days data is used as a measure to standardise activity across NHS trusts. Overnight bed occupancy figures were extracted from the KH03 mandatory data collection published by NHS England. The average daily number of occupied beds was multiplied by the number of days in the reporting period to obtain quarterly bed day figures for NHS organisations.
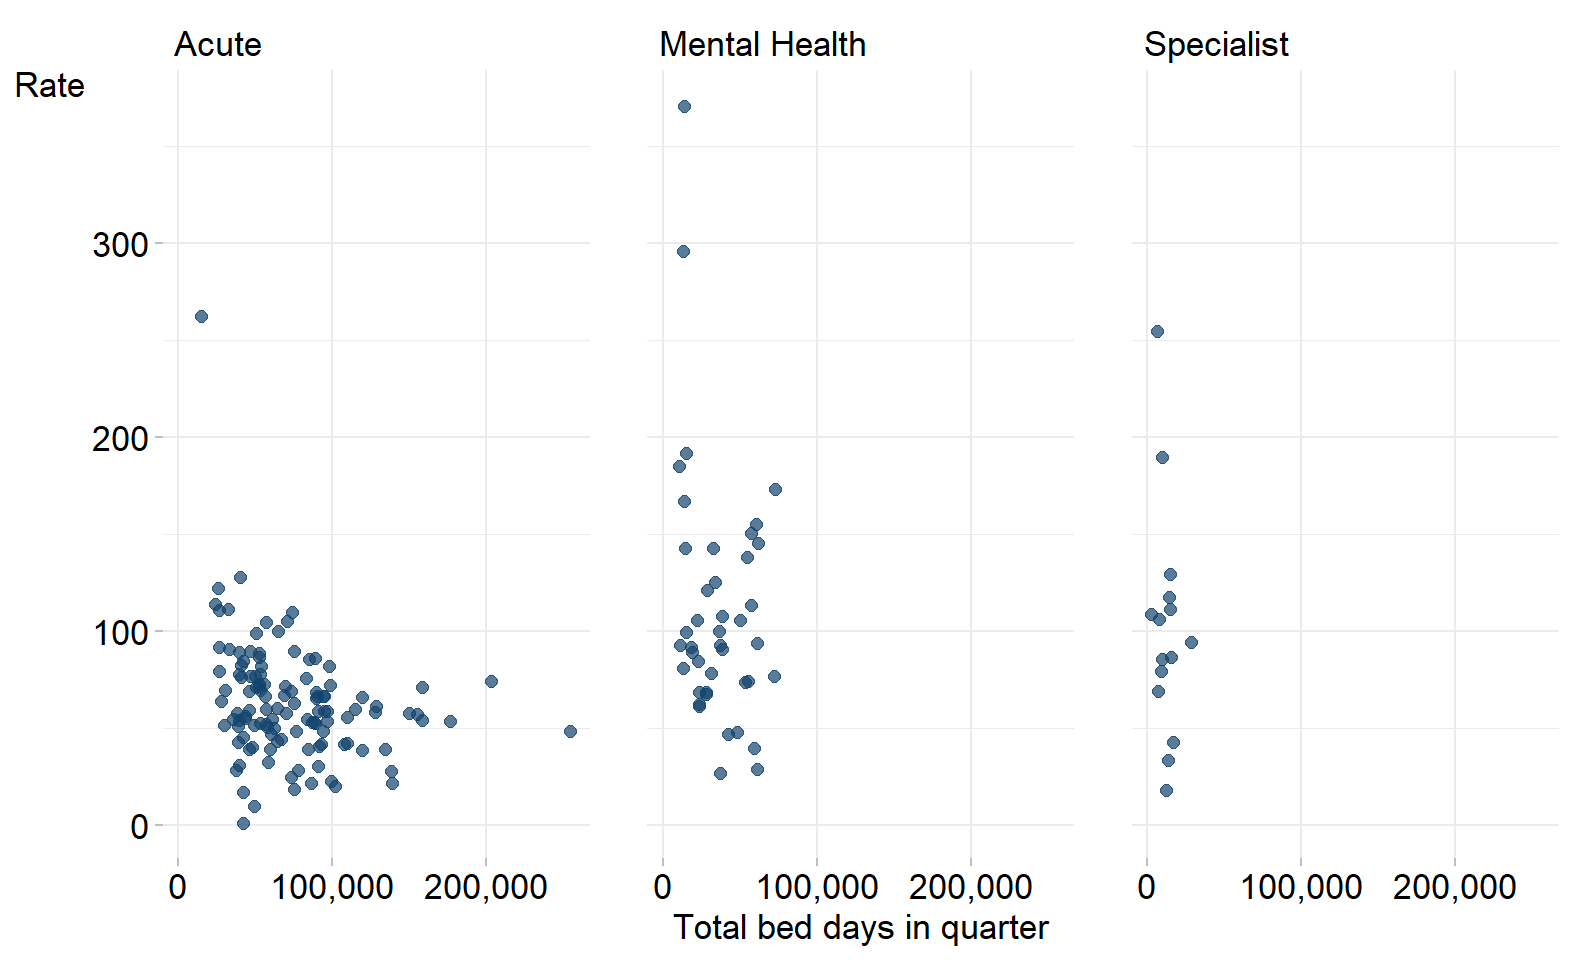
There was variation in recording rates across different types of NHS trusts. Recording rates (per 1,000 bed days) ranged from 1 to 263 incidents in acute trusts. In mental health trusts, the range observed was 27 to 371 incidents, whilst the range was 18 to 255 incidents across specialist trusts.
Rates were not calculated for community and ambulance trusts. In addition, the trusts below were excluded because they do not generally provide inpatient services:
- Moorfields Eye Hospital NHS Foundation Trust
- Tavistock and Portman NHS Foundation Trust
- South London and Maudsley NHS Foundation Trust
- Leicestershire Partnership NHS Foundation Trust
Isle of Wight NHS trust is both an acute and an ambulance trust but treated as an acute trust for the purposes of this analysis.
Figure 5: Recording rates (per 1,000 bed days) by total bed days this quarter, across NHS trusts
Based on patient safety incident records submitted between October 2024 and December 2024. It may be that a different denominator is more appropriate for non-acute trusts; we will explore alternatives as part of this publication in development.
7 Organisation level
This CSV contains the number of patient safety incidents recorded, the median lag for recording these incidents, the total bed days in this quarter and recording rate (per 1,000 bed days) for NHS Trusts by region and by trust type. Trust types were taken from the trust accounts consolidation (TAC) data publications. During the current period there were 18,763 incidents where an organisation code was not present and therefore an organisation could not be identified. These incidents are thus not included in these counts.
The organisation-level table can be downloaded as a CSV file.
8 Future publications
Your feedback is welcome on the format, frequency and utility of this document, so that we can provide reports that are of most benefit. Please contact patientsafety.analysis@nhs.net with any suggestions.