
Quarter 1 2025/26 (April to June 2025)
1 Background
Healthcare associated venous thromboembolism (VTE), commonly known as blood clots, is a significant international patient safety issue. The first step in preventing death and disability from VTE is to identify those at risk so that preventative treatments (prophylaxis) can be given. This data collection quantifies the numbers of hospital admissions (aged 16 and over at the time of admission) who are being risk assessed for VTE to identify those who should be given appropriate prophylaxis based on guidance from the National Institute for Health and Care Excellence (NICE). Such measures have the potential to save many lives each year.
This data collection is intended to embed VTE risk assessment across the NHS and will be critical in evaluating the impact of the National VTE Prevention Programme on improving health outcomes for patients. The VTE risk assessment is a former national CQUIN indicator and is a National Quality Requirement in the NHS Standard Contract for 2025/26. It sets an operational standard of 95% of patients aged 16 and over being risk assessed for VTE on admission each month. Prior to April 2019 the operational standard related to adult patients aged 18 and over.
The data collection asks for the following information:
- number of admitted patients (aged 16 and over at the time of admission) in the month who have been risk assessed for VTE within 14 hours of admission to hospital using the criteria in the NICE guidance.
- total number of admitted patients (aged 16 and over at the time of admission) in the month.
The percentage of admitted patients (aged 16 and over at the time of admission) in the month who have been risk assessed for VTE on admission is automatically calculated from items (1) and (2).
All providers of NHS-funded acute care (that is, NHS trusts and foundation trusts and independent sector providers of acute NHS services) must complete this data collection. Providers of non-acute health services only are not asked to complete this data collection, although they should be aware that all patients should be protected from unnecessary risk of VTE.
For the purposes of this collection, risk assessment should be completed on admitted patients within 14 hours of admission; NICE guidelines state that where required, pharmacological thromboprophylaxis should be started within 14 hours of admission, therefore risk assessment should be completed prior to this, unless otherwise stated in the population-specific recommendations.
This data collection is a census of all patients – it is not appropriate to use sampling methodologies to produce estimates.
2 Download data
Note the date of each month of collection is given as the first of the month in the CSV file.
3 Summary of the data collection
The key results for the data collected on the number and percentage of VTE risk assessments on admitted patients aged 16 and over to NHS-funded acute care (NHS trusts, NHS foundation trusts and independent sector providers) in quarter 1 (Q1) 2025/26 (April to June 2025) are:
- the percentage of admitted patients risk assessed for VTE in England was 91%. Of the 3.5 million admitted patients for whom data was reported in this collection, 3.2 million were risk assessed for VTE on admission.
- the percentage of admitted patients risk assessed for VTE was 91% for NHS acute care providers and 96% for independent sector providers. NHS acute care providers carry out 96% of all VTE risk assessments.
- the percentage of admitted patients risk assessed for VTE for each region was: East of England 92%, London 92%, Midlands 92%, North East and Yorkshire 88%, North West 89%, South East 94% and South West 87%.
- 21% of integrated care boards (ICBs) (9 of the 42 ICBs) carried out a VTE risk assessment for 95% or more of their admissions (the NHS Standard Contract operational standard).
4 Findings
4.1 Percentage of total admissions risk assessed for VTE in England
In Q1 2025/26 all providers of NHS-funded acute care (NHS trusts, foundation trusts and independent sector providers) reported 3.5 million eligible admissions. Of these, 3.2 million (91%) received a VTE risk assessment on admission. Comparison to previous collection figures can be seen in Figure 2.
Figure 1: Percentage of hospital admissions (aged 16 and over at the time of admission) risk assessed for VTE in England by month (Q1 2025/26)
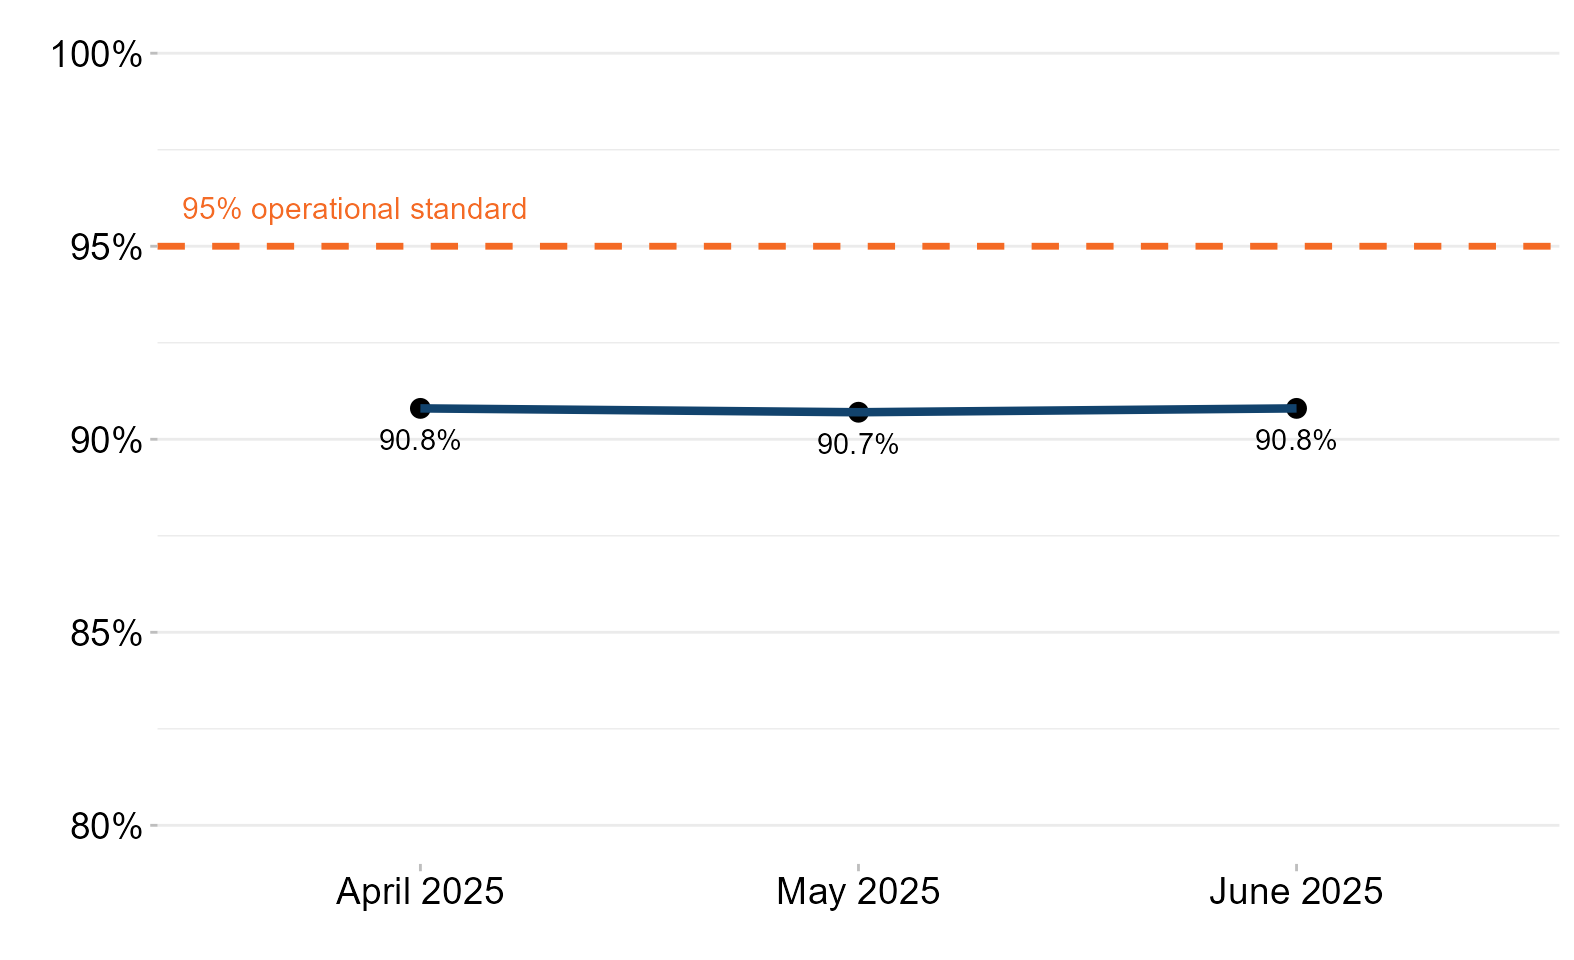
Table 1: Percentage of hospital admissions (aged 16 and over at the time of admission) risk assessed for VTE in England by month (Q1 2025/26)
| April 2025 | May 2025 | June 2025 | |
|---|---|---|---|
| All providers of NHS-funded acute care | 90.8% | 90.7% | 90.8% |
Figure 2: Percentage of hospital admissions (aged 16 and over at the time of admission) risk assessed for VTE in previous collections
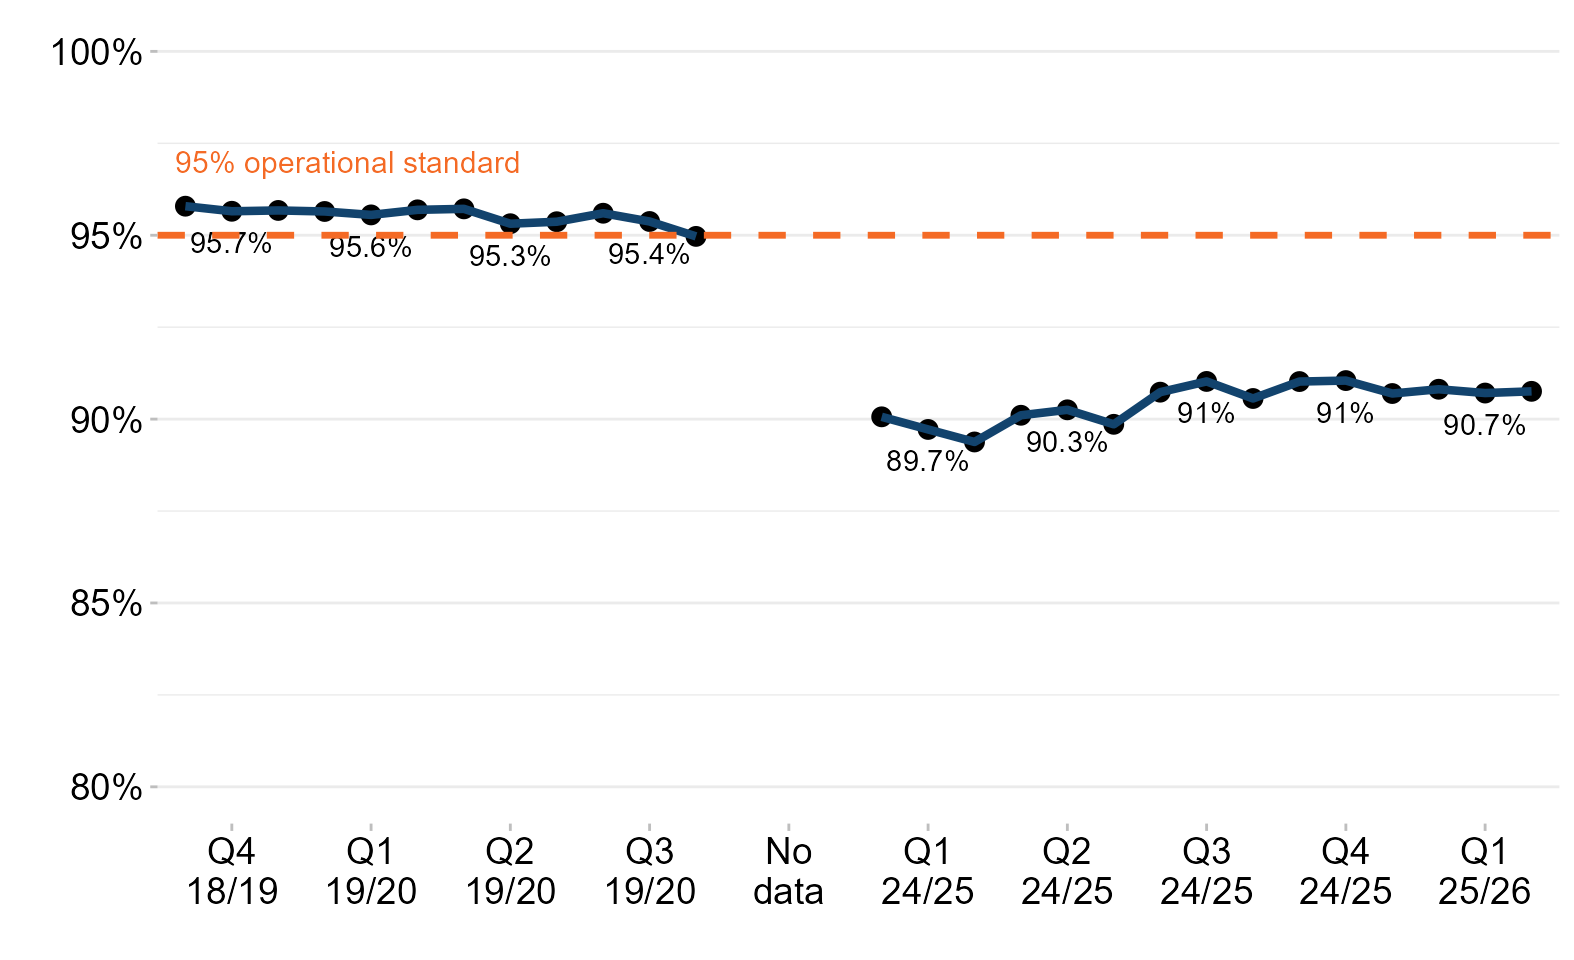
Table 2: The 5 NHS acute care providers with the highest percentage of admitted patients being risk assessed (Q1 2025/26)
| Code | Provider | Risk assessed for VTE | Total admissions | Percentage risk assessed for VTE |
|---|---|---|---|---|
| RL1 | The Robert Jones and Agnes Hunt Orthopaedic Hospital NHS Foundation Trust | 3,747 | 3,758 | 99.7% |
| RFF | Barnsley Hospital NHS Foundation Trust | 17,162 | 17,270 | 99.4% |
| RM1 | Norfolk and Norwich University Hospitals NHS Foundation Trust | 49,532 | 49,947 | 99.2% |
| RR7 | Gateshead Health NHS Foundation Trust | 15,177 | 15,307 | 99.2% |
| RRJ | The Royal Orthopaedic Hospital NHS Foundation Trust | 3,372 | 3,402 | 99.1% |
Table 3: The 5 NHS acute care providers with the lowest percentage of admitted patients being risk assessed (Q1 2025/26)
| Code | Provider | Risk assessed for VTE | Total admissions | Percentage risk assessed for VTE |
|---|---|---|---|---|
| RCB | York and Scarborough Teaching Hospitals NHS Foundation Trust | 6,243 | 43,188 | 14.5% |
| RNZ | Salisbury NHS Foundation Trust | 1,960 | 4,988 | 39.3% |
| RQW | The Princess Alexandra Hospital NHS Trust | 4,485 | 9,399 | 47.7% |
| RQ3 | Birmingham Women’s and Children’s NHS Foundation Trust | 1,520 | 3,044 | 49.9% |
| RJ7 | St George’s University Hospitals NHS Foundation Trust | 8,643 | 13,315 | 64.9% |
4.2 Percentage of total admissions risk assessed for VTE in England by organisation type
In Q1 2025/26, the percentage of admitted patients (aged 16 and over at the time of admission) receiving a VTE risk assessment was 91% for NHS acute care providers and 96% for independent sector providers. NHS acute care providers carry out 96% of all VTE risk assessments and independent sector providers carry out 4%.
Figure 3: Percentage of hospital admissions (aged 16 and over at the time of admission) risk assessed for VTE in England by organisation type and by month (Q1 2025/26)
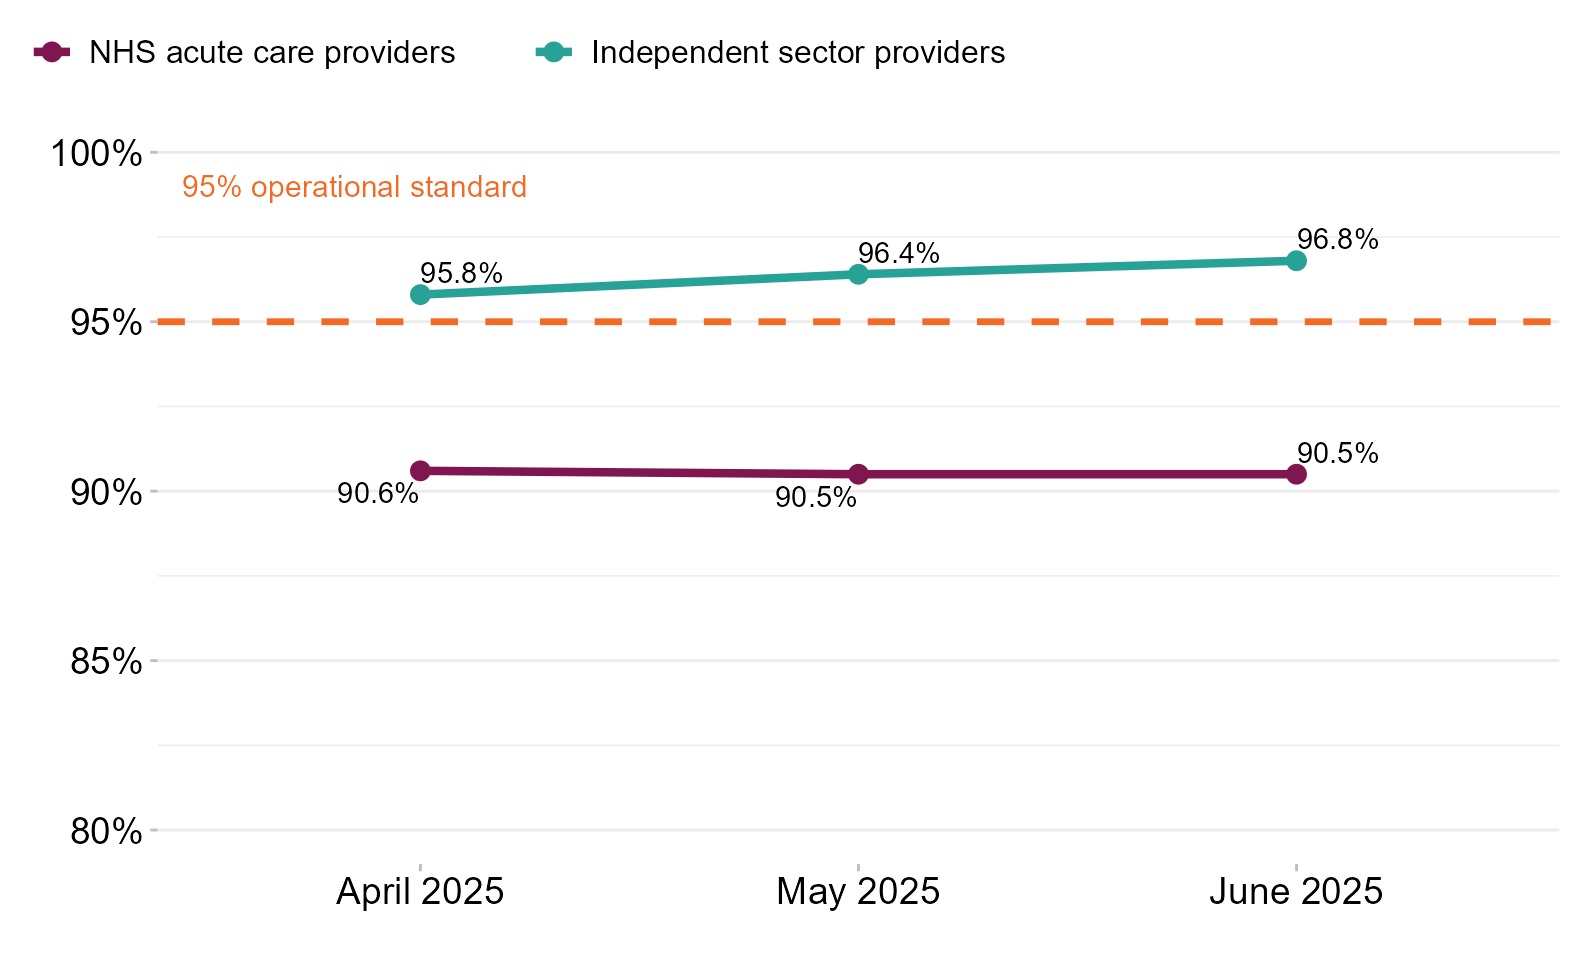
Table 4: Percentage of hospital admissions (aged 16 and over at the time of admission) risk assessed for VTE in England by organisation type by month (Q1 2025/26)
| April 2025 | May 2025 | June 2025 | |
|---|---|---|---|
| NHS acute care providers | 90.6% | 90.5% | 90.5% |
| Independent sector providers | 95.8% | 96.4% | 96.8% |
4.3 Percentage of total admissions risk assessed for VTE in England by region
No regions achieved the 95% NHS Standard Contract operational standard in Q1 2025/26.
Figure 4: Percentage of hospital admissions (aged 16 and over at the time of admission) risk assessed for VTE in England by region (Q1 2025/26)
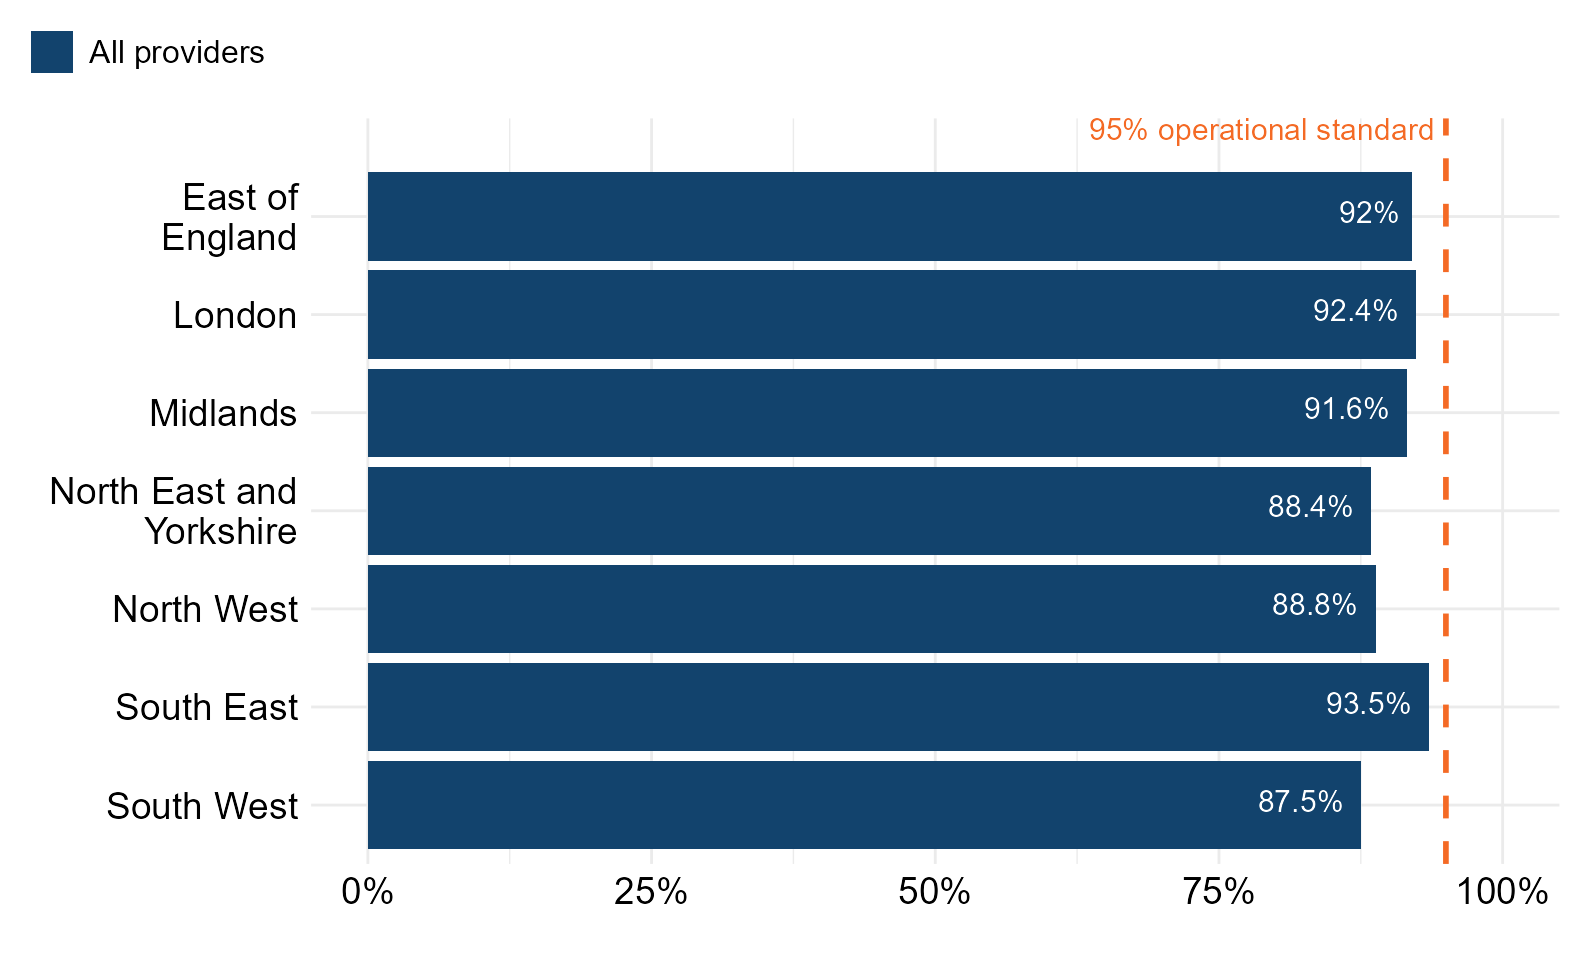
Table 5: Percentage of hospital admissions (aged 16 and over at the time of admission) risk assessed for VTE in England by region (Q1 2025/26)
| NHS region | All providers |
|---|---|
| East of England | 92.0% |
| London | 92.4% |
| Midlands | 91.6% |
| North East and Yorkshire | 88.4% |
| North West | 88.8% |
| South East | 93.5% |
| South West | 87.5% |
4.4 Percentage of total admissions risk assessed for VTE in England by region and organisation type
Figure 5: Percentage of hospital admissions (aged 16 and over at the time of admission) risk assessed for VTE in England by region and organisation type (Q1 2025/26)
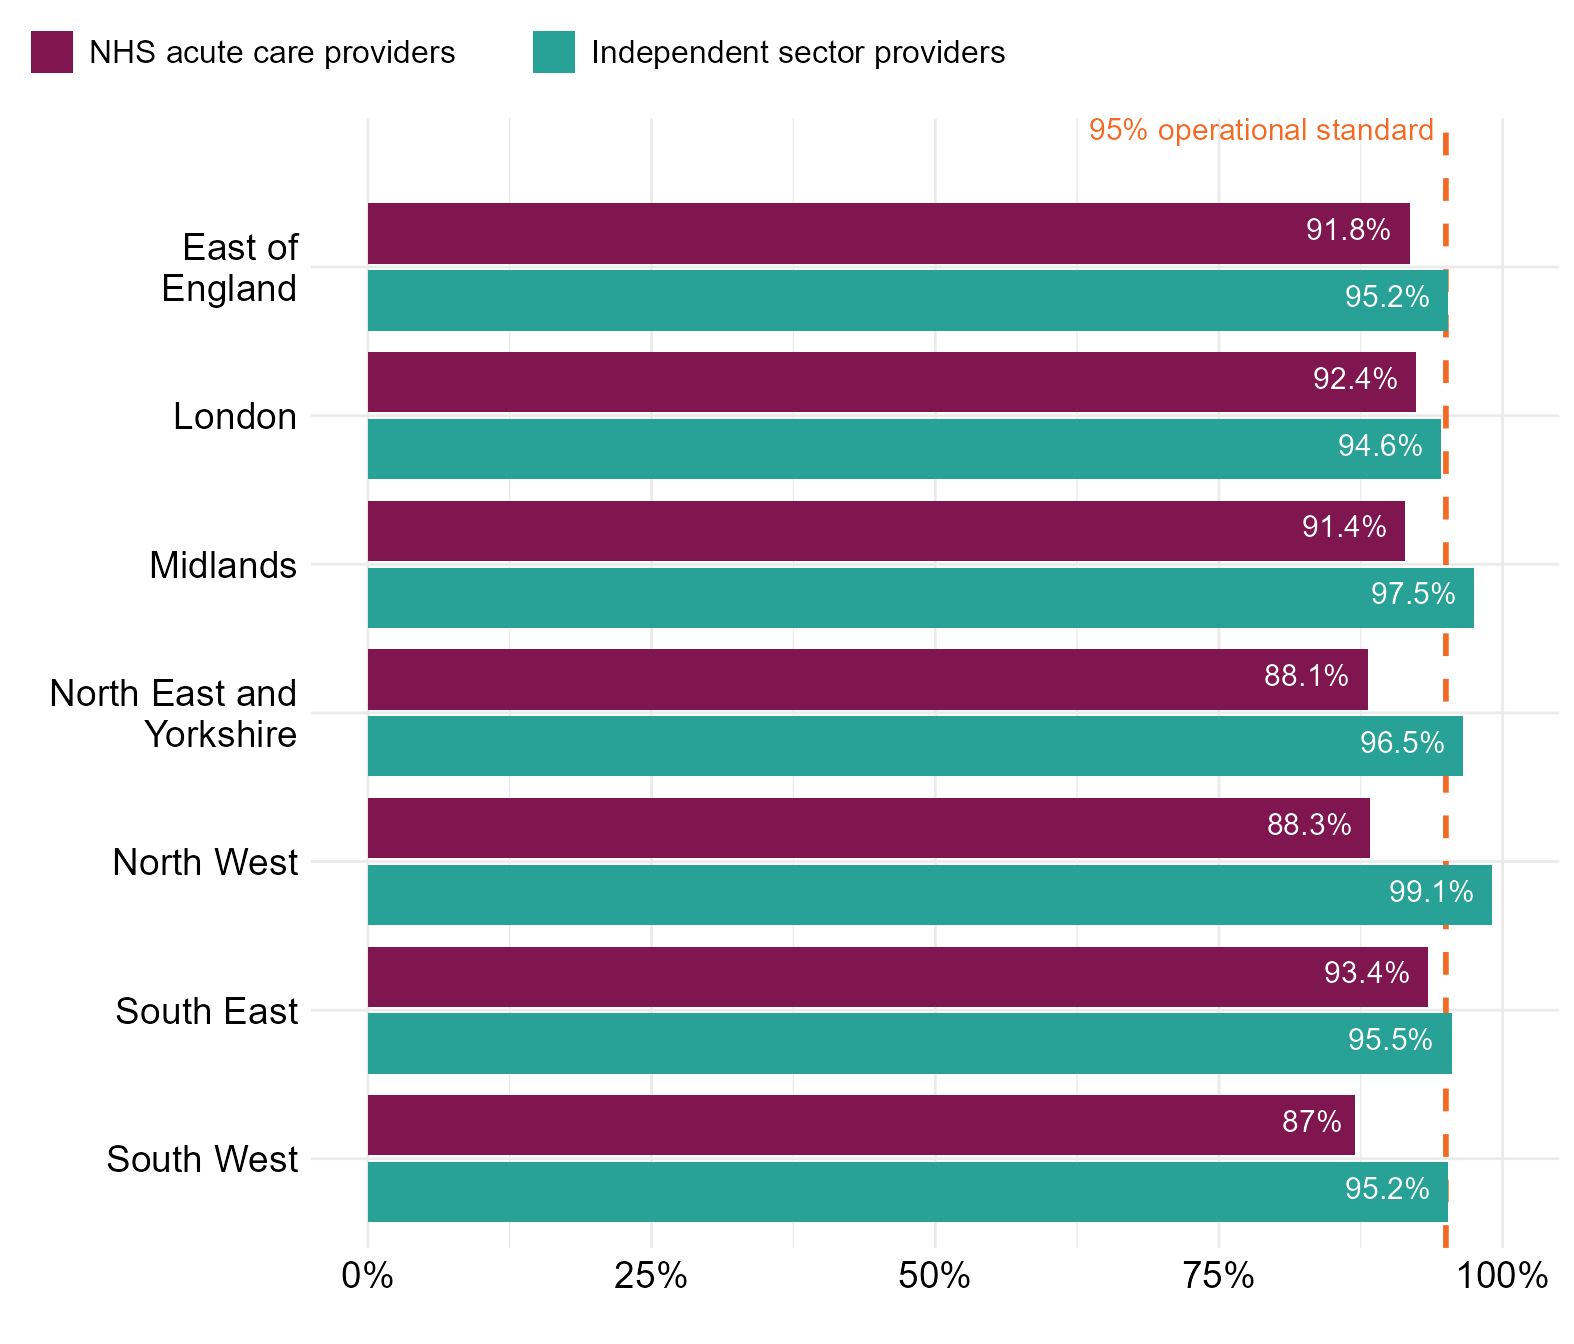
Table 6: Percentage of hospital admissions (aged 16 and over at the time of admission) risk assessed for VTE in England by region and organisation type (Q1 2025/26)
| NHS region | NHS acute care providers | Independent sector providers |
|---|---|---|
| East of England | 91.8% | 95.2% |
| London | 92.4% | 94.6% |
| Midlands | 91.4% | 97.5% |
| North East and Yorkshire | 88.1% | 96.5% |
| North West | 88.3% | 99.1% |
| South East | 93.4% | 95.5% |
| South West | 87.0% | 95.2% |
4.5 Percentage of total admissions risk assessed for VTE in England by integrated care board (ICB).
In Q1 2025/26, 21% of ICBs (9 of the 42 ICBs) carried out a VTE risk assessment for 95% or more of their admissions (the NHS Standard Contract operational standard).
Figure 6: Percentage of hospital admissions (aged 16 and over at the time of admission) risk assessed for VTE in England by integrated care board (ICB) (Q1 2025/26).
* denotes where an ICB has met the 95% operational standard.
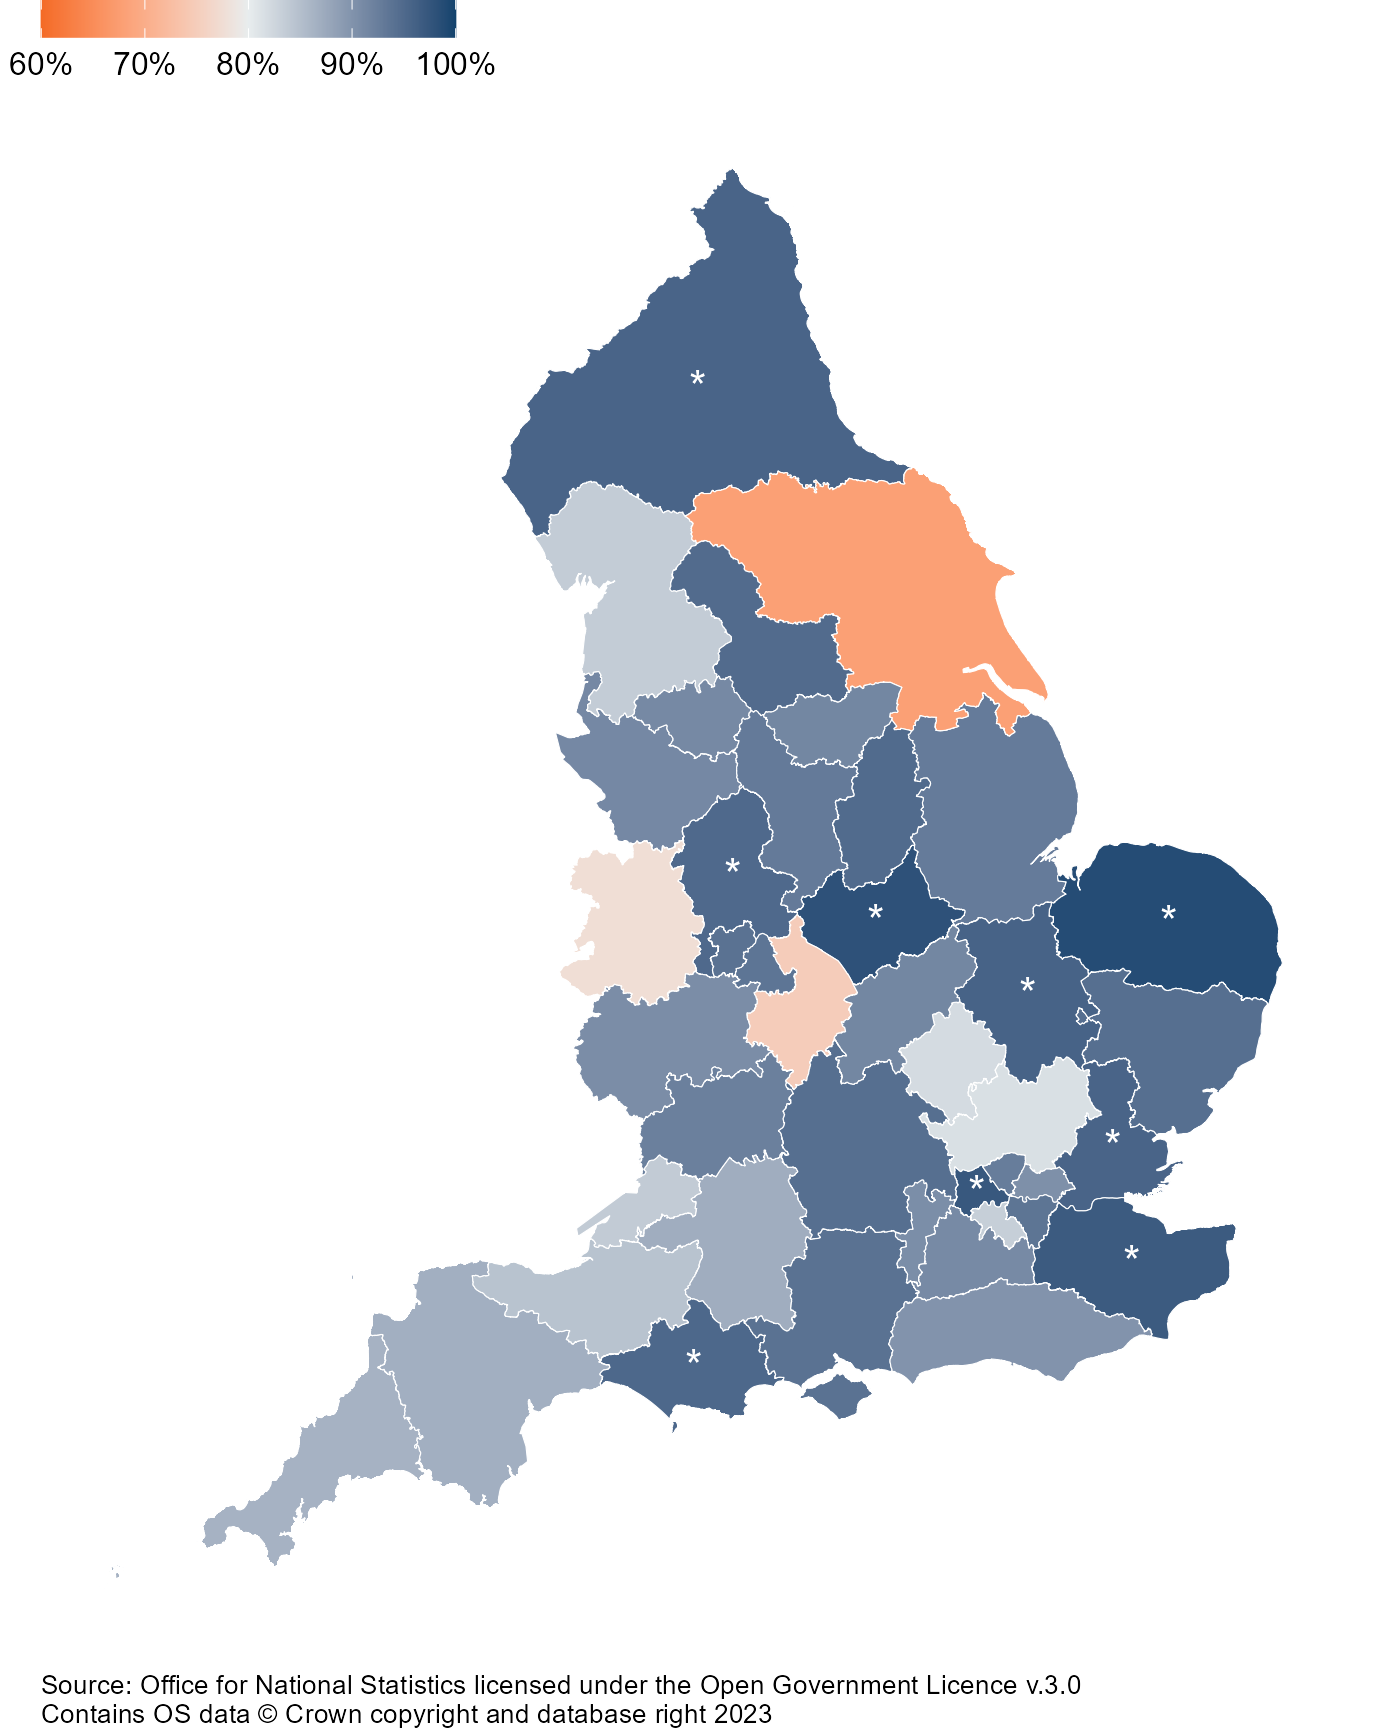
Table 7: Percentage of hospital admissions (aged 16 and over at the time of admission) risk assessed for VTE in England by integrated care board (ICB) (Q1 2025/26)
| ICB name | Percentage | Operational standard met |
|---|---|---|
| NHS Norfolk and Waveney ICB | 98.8% | Yes |
| NHS Leicester, Leicestershire and Rutland ICB | 98.1% | Yes |
| NHS North West London ICB | 97.2% | Yes |
| NHS Kent and Medway ICB | 96.9% | Yes |
| NHS Cambridgeshire and Peterborough ICB | 95.8% | Yes |
| NHS Mid and South Essex ICB | 95.7% | Yes |
| NHS North East and North Cumbria ICB | 95.6% | Yes |
| NHS Dorset ICB | 95.2% | Yes |
| NHS Staffordshire and Stoke-On-Trent ICB | 95% | Yes |
| NHS Nottingham and Nottinghamshire ICB | 94.8% | No |
| NHS West Yorkshire ICB | 94.8% | No |
| NHS Suffolk and North East Essex ICB | 94.4% | No |
| NHS Buckinghamshire, Oxfordshire and Berkshire West ICB | 94.4% | No |
| NHS Hampshire and Isle Of Wight ICB | 94% | No |
| NHS Black Country ICB | 94% | No |
| NHS South East London ICB | 93.6% | No |
| NHS Birmingham and Solihull ICB | 93.6% | No |
| NHS Derby and Derbyshire ICB | 92.9% | No |
| NHS Lincolnshire ICB | 92.8% | No |
| NHS North Central London ICB | 92.6% | No |
| NHS Gloucestershire ICB | 92.3% | No |
| NHS South Yorkshire ICB | 91.5% | No |
| NHS Northamptonshire ICB | 91.5% | No |
| NHS Cheshire and Merseyside ICB | 91.3% | No |
| NHS Greater Manchester ICB | 91.2% | No |
| NHS Surrey Heartlands ICB | 91% | No |
| NHS Herefordshire and Worcestershire ICB | 90.7% | No |
| NHS Frimley ICB | 90.6% | No |
| NHS North East London ICB | 90.4% | No |
| NHS Sussex ICB | 90% | No |
| NHS Bath and North East Somerset, Swindon and Wiltshire ICB | 87% | No |
| NHS Devon ICB | 86.8% | No |
| NHS Cornwall and The Isles Of Scilly ICB | 86.4% | No |
| NHS Somerset ICB | 84.6% | No |
| NHS Bristol, North Somerset and South Gloucestershire ICB | 83.7% | No |
| NHS Lancashire and South Cumbria ICB | 83.6% | No |
| NHS South West London ICB | 83.3% | No |
| NHS Bedfordshire, Luton and Milton Keynes ICB | 81.9% | No |
| NHS Hertfordshire and West Essex ICB | 81.4% | No |
| NHS Shropshire, Telford and Wrekin ICB | 77.6% | No |
| NHS Coventry and Warwickshire ICB | 74.9% | No |
| NHS Humber and North Yorkshire ICB | 67.9% | No |
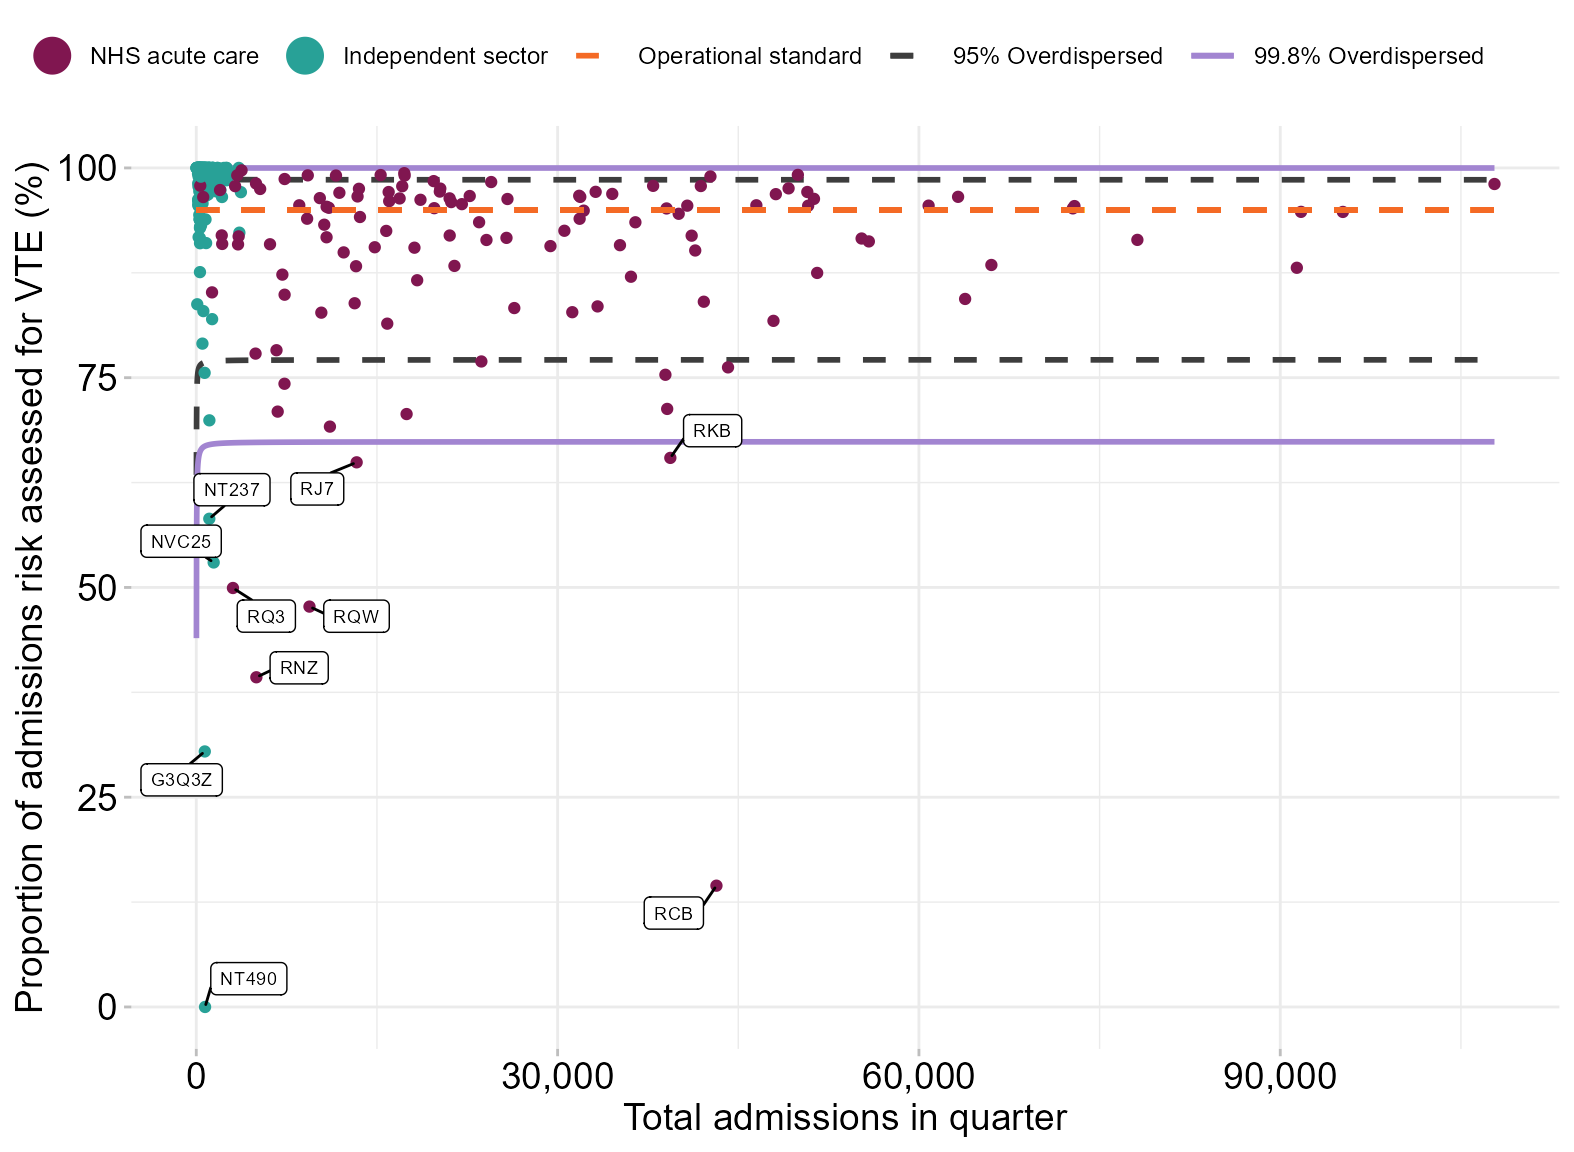
4.6 Percentage of total admissions risk assessed for VTE in England by total admissions
Figure 7 is a funnel plot of the total admissions for each provider in the quarter against the percentage of total admissions risk assessed for VTE. The funnel plot limits have been adjusted for overdispersion. Providers that fall below the 99.8% overdispersed lower limit have been labelled.
Figure 7: Percentage of total admissions risk assessed for VTE in England by total admissions for provider in quarter (Q1 2025/26).
4.7 Number of valid data returns
- the total number of valid data returns submitted by all providers of NHS-funded acute care in each month of Quarter 1 2025/26 (April to June 2025) was 285.
- the number of valid NHS acute care providers submitting a data return in each month of Quarter 1 2025/26 (April to June 2025) was 123.
- for independent sector providers, it was 162 in each month of Quarter 1 2025/26 (April to June 2025).
5 Data quality
5.1 General
- The data collection is mandatory and risk assessments should be completed on admitted patients within 14 hours of admission. It is a requirement to report on admitted patients aged 16 and over and providers are required to submit information based on a census of patients. The following are excluded from the data:
- providers that submit data with risk assessments completed after 14 hours of admission.
- providers that use different age criteria.
- providers that submit data based on a sample or audit of patients.
- providers that did not have any admissions in a particular month.
- children’s hospitals: Alder Hey Children’s NHS foundation trust (RBS), Great Ormond Street Hospital for Children NHS foundation trust (RP4) and Sheffield Children’s NHS foundation trust (RCU).
5.2 Organisation changes
- Fairfield Independent Hospital previously submitted under code NVG before being acquired by Circle Health group. They will now submit under code Y9S1N.
5.3 Non-acute NHS trusts
The following non-acute NHS trusts are not in included in the figures:
- Hampshire and Isle of Wight Healthcare NHS Foundation Trust (RW1) is a community trust that submitted to this collection. The percentage of admitted patients risk-assessed for VTE for this data was 98%.
5.4 Sample, audit or partially submitted data
The following providers that submit data based on sample or audit of patients are not included in the figures:
- Kettering General Hospital NHS Foundation Trust (RNQ) VTE risk assessment process is currently paper based so is submitting data based on a sample of patients. The sample percentage of admitted patients risk-assessed for VTE was 79%. The provider is working towards providing data for all patients admitted once their process is digital.
- Northampton General Hospital NHS Trust (RNS) submission is calculated from a VTE sample audit. The sample percentage of admitted patients risk-assessed for VTE was 79%. The provider is working towards providing data for all patients admitted once they have implemented an EPMA system later this year.
- East Suffolk and North Essex NHS Foundation Trust (RDE) VTE risk assessment process is currently paper based so is unable to provide risk assessed admission data on all their admissions. The provider is working towards providing data for all patients admitted once they have implemented a new EPR in October 2025.
- East Cheshire NHS Trust (RJN) changed system and reported problems with data collection this quarter and are only reporting on a proportion of patients. They are missing data from June. The percentage of admitted patients risk-assessed for VTE for this data was 90%.
5.5 Providers preparing to submit
The following providers are in the process of preparing to submit:
- Nuffield Health, Hereford Hospital (NT219) VTE risk assessment process is currently paper based and will begin submitting in Q2 2025/26 once they have implemented an EPR system later this year.
- Mid Cheshire Hospitals NHS Foundation Trust (RBT) have recently implemented an EPR system and will submit Q1 2025/26 data as part of the revised publication.
- HMT Hospitals (NTE) will begin submitting in Q2 2025/26.
- North Cumbria Integrated Care NHS Foundation Trust (RNN) are working towards providing data for all patients admitted once they have implemented a new EPR in early 2026.
- The McIndoe Centre (NXM04). Date to be confirmed.
- Northern Care Alliance NHS Foundation Trust (RM3). Date to be confirmed.
5.6 Zero admissions
- Edgbaston Hospital (NT445) submitted zero admissions for each month in the submitting period.
5.7 No submissions received
The following providers did not submit data for this publication:
- Buckinghamshire Healthcare NHS Trust (RXQ) were unable to submit VTE data whilst they address a data quality issue following a change in system.
5.8 Quality assurance
Data quality assurance focuses on identifying missing data, data errors (for example the numerator should not be greater than the denominator) and data consistency over time. Any issues identified are discussed with providers and they are given the opportunity to clarify or resubmit their data within the quality assurance period.
6 Timings and publication
Providers must collect data and submit it to the Strategic Data Collection Service run by NHS England. The deadline is the last working day of the month following the quarter end.
Data are submitted and published according to the timings below:
| Timing | Process |
|---|---|
| Month A (for example June) | Data are collected from patients in each provider for the quarter |
| Month B (for example July) | Providers submit their data quarterly for the previous quarter with a deadline of the last working day of the month following the end of that quarter (for example Q1 data is submitted towards the end of July) |
| Month C (for example August) | Data is quality assured |
| Month D (for example September) | Data for the quarter is published on the NHS England website at the beginning of month D (for example Q1 data in early September) |
7 Guidance
Guidance on the data collection is given in the 2025/26 NHS Standard Contract and can be found at: https://www.england.nhs.uk/publication/nhs-standard-contract-2025-26-technical-guidance/
8 Additional information
Please email press enquiries to NHS England Press Office at: nhsengland.media@nhs.net or call 0113 825 0958.
Your feedback is welcomed on the format, frequency and utility of this document, so that we can provide reports that are of most benefit, Please contact patientsafety.analysis@nhs.net with any suggestions.
The analysts with overall responsibility for this report are:
Joshua Mutio
Lead Analyst
Patient Safety, Medical Directorate Programmes
Data & Analytics
NHS England
David Hardy
Senior Analyst
Patient Safety, Medical Directorate Programmes
Data & Analytics
NHS England