
Quarter 4 2025/26 (January, February, March 2026)
Patient Safety Event Data Quarterly Publication
1 Background
We publish quarterly official statistics in development on events recorded to the Learn from Patient Safety Events (LFPSE) service. This quarterly publication is based on patient safety event records submitted between January 2026 and March 2026.
The LFPSE service defines a patient safety incident as: ‘something unexpected or unintended has happened, or failed to happen, that could have or did lead to patient harm for one or more person(s) receiving healthcare’. Full details of the definitions and harm gradings are available here.
LFPSE also captures three other patient safety event types: outcomes of concern, risks to patient safety, and instances of good care. Throughout this report, with the exception of table 1, we will be using patient safety incidents only, which constitute the vast majority of patient safety events data recorded to LFPSE. Future versions of this publication will encompass other event types.
2 Data quality information
2.1 Interpreting the data
National data collected by LFPSE comes mainly as a secondary use from what is recorded by staff into local risk management systems (LRMSs). Currently NHS acute providers submit most records we receive. However, anyone can record a patient safety event on the service: they may be healthcare staff from any NHS or private provider, patients or members of the public. LFPSE data is submitted voluntarily to foster openness and encourage continual increases in recording. This means LFPSE data does not, and cannot, provide the definitive number of patient safety events occurring in the NHS; it measures the number of safety events recorded. The number of recorded safety events has increased year on year, which likely reflects improved recording culture and cannot necessarily be interpreted as the NHS becoming less safe. A ‘low’ recording rate for an organisation should not necessarily be interpreted as a ‘safe’ environment; it may represent under-recording. Conversely a ‘high’ recording rate should not be interpreted as ‘unsafe’; it may represent a more open culture. The data presented in this publication was extracted on 01 Jun 2026 and serves as a quarterly snapshot of records currently held in LFPSE. Any figures reported are subject to change as records get updated into the system.
2.2 Missing values
Missing values have been handled and removed from the tables and plots, so the total counts will vary across tables.
2.3 Cleansing
Records that have been submitted with patient identifiable information and are yet to be anonymised will not appear in these data. Records that have been submitted and subsequently updated that contain patient identifiable information, and are yet to be re-anonymised, will be displayed as their previous version in the data until re-anonymised.
3 Event types
LFPSE brings the feature to record patient safety event types beyond incidents. Recorders can now also upload patient safety risks, outcomes, and instances of good care. This is to ensure the database contains more instances of care that the healthcare system can learn from instead of only detailing errors involving patients. In the current period, 829,300 events were recorded to LFPSE, the majority of which were recorded as patient safety incidents (96.96%).
Table 1: Number of the event types in LFPSE
Based on patient safety event records submitted between January 2026 and March 2026.
| Event type | Number of events | Percentage |
|---|---|---|
| Incident | 804,069 | 96.96% |
| Good care | 11,381 | 1.37% |
| Risk | 9,230 | 1.11% |
| Outcome | 4,620 | 0.56% |
| Total | 829,300 | – |
4 Taxonomy version uptake
The LFPSE taxonomy has been regularly updated since its inception to reflect the nature of the healthcare system better, and to help organisations record patient safety events accurately. LFPSE-compliant LRMS suppliers and healthcare organisations are currently working towards full adoption of version 6 of the taxonomy. The adoption timeline of the latest taxonomy is expected to occur at different points across healthcare organisations. We observed 75 organisations reporting on both version 5 and version 6 of the LFPSE taxonomy between January 2026 and March 2026. The data we present below focuses on submissions by NHS trusts and primary care providers.
Details of taxonomy changes are publicly available through vendor summaries, and a list of compliant vendors can be found here.
Figure 1: Number of recorded patient safety incidents by taxonomy version
Based on patient safety incidents records submitted between January 2026 and March 2026.
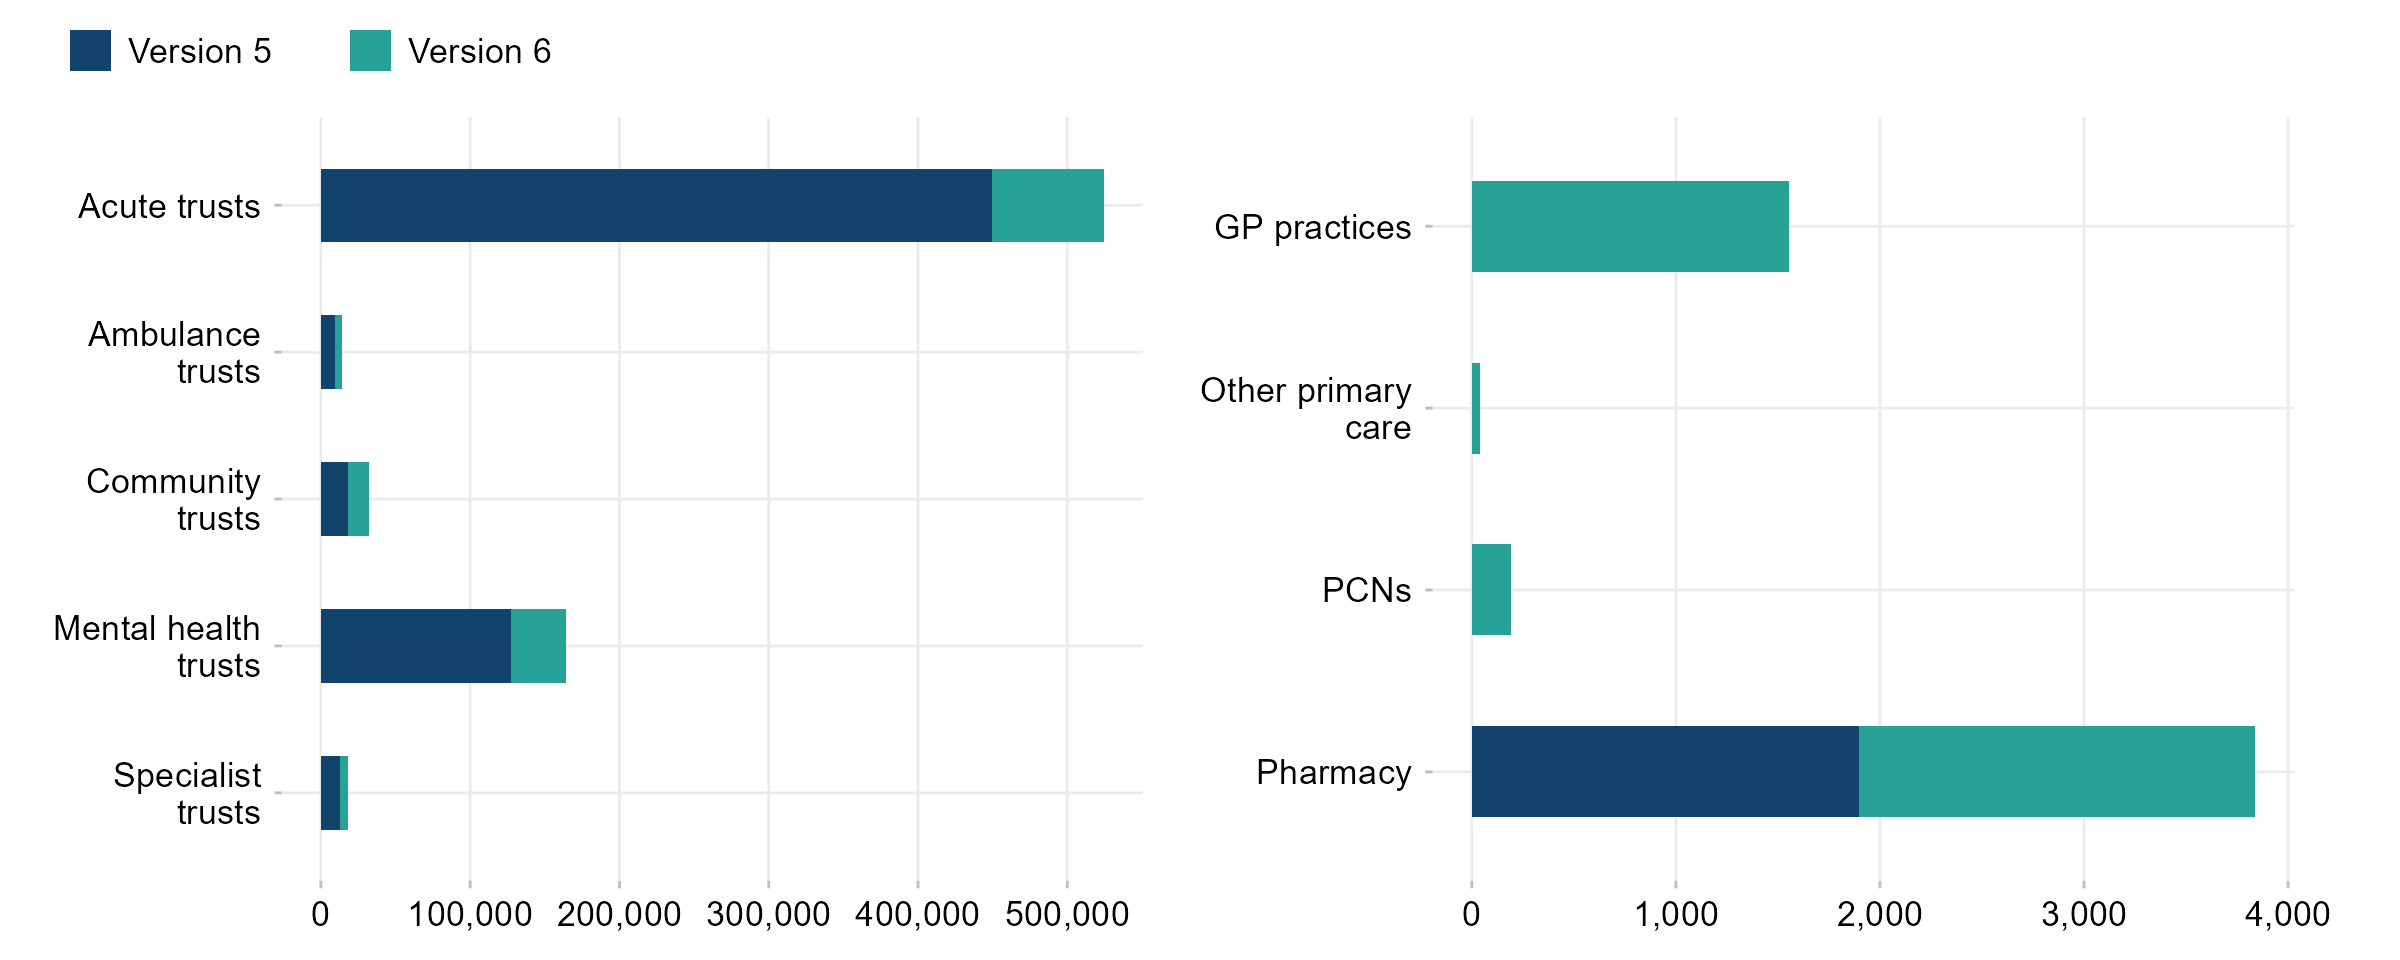
Note: Other primary care is a category assigned to an organisation by LFPSE and its broad nature requires further validation. We will likely break down this category in the future, after checking organisation codes in this group using ODS.
Table 2: Number of recorded patient safety incidents by taxonomy version
Based on patient safety incidents records submitted between January 2026 and March 2026.
| Organisation type | Incidents recorded | Version 5 | Version 6 | Percent on Version 6 |
|---|---|---|---|---|
| Acute trusts | 524,310 | 449,622 | 74,688 | 14.2% |
| Ambulance trusts | 14,239 | 9,614 | 4,625 | 32.5% |
| Community trusts | 32,000 | 18,241 | 13,759 | 43% |
| Mental health trusts | 164,156 | 127,407 | 36,749 | 22.4% |
| Specialist trusts | 17,865 | 12,573 | 5,292 | 29.6% |
| Pharmacy | 3,836 | 1,899 | 1,937 | 50.5% |
| GP practices | 1,554 | 0 | 1,554 | 100% |
| PCNs | 191 | 0 | 191 | 100% |
| Other primary care | 39 | 0 | 39 | 100% |
| Total | 758,190 | 619,356 | 138,834 | 18.3% |
5 Recording patterns by physical harm
5.1 Psychological harm
LFPSE has a new variable for grading of the psychological harm associated with the recorded patient safety incidents. This is an experimental field which seeks to explore if responses to safety incidents need to be different if psychological harm is considered separately from physical harm, rather than rolling them together into one measure, as was done in the National Reporting Learning Service (NRLS). Currently, there is low confidence in the grading of psychological harm, as users familiarise themselves with its use, and as such, it is excluded from this report.
5.2 Physical harm
Grading the degree of harm to a patient resulting from a patient safety incident can be a challenge for recorders, but by grading patient safety incidents according to the harm they cause patients, local organisations can ensure consistency and comparability of data. This consistent approach locally will enable LFPSE to compare, analyse and learn from data nationally. This grading can also be used to “triage” incidents for review both locally and nationally, ensuring the most serious events are looked at first.
5.3 Harm policy
For more information on harm grading please see the harm grading policy guidelines.
Sometimes a problem in care can affect more than one patient, or none at all. To capture this, as a new feature of LFPSE, recorders can submit information for multiple patients per incident, meaning there can be multiple degrees of harm per incident. For the following figure and table we have taken the highest harm level per incident. We identified and removed 64,223 incidents where the number of patients affected was unknown. Preliminary analysis suggests that these records likely represent incidents with no patients involved. We will continue further data quality checks to validate these figures. During this quarter, 739,846 incidents had recorded a degree of harm. The majority of these incidents (94.2%) recorded low or no physical harm to patients.
Figure 2: Number of patient safety incidents by maximum physical harm
Based on patient safety incidents records submitted between January 2026 and March 2026.
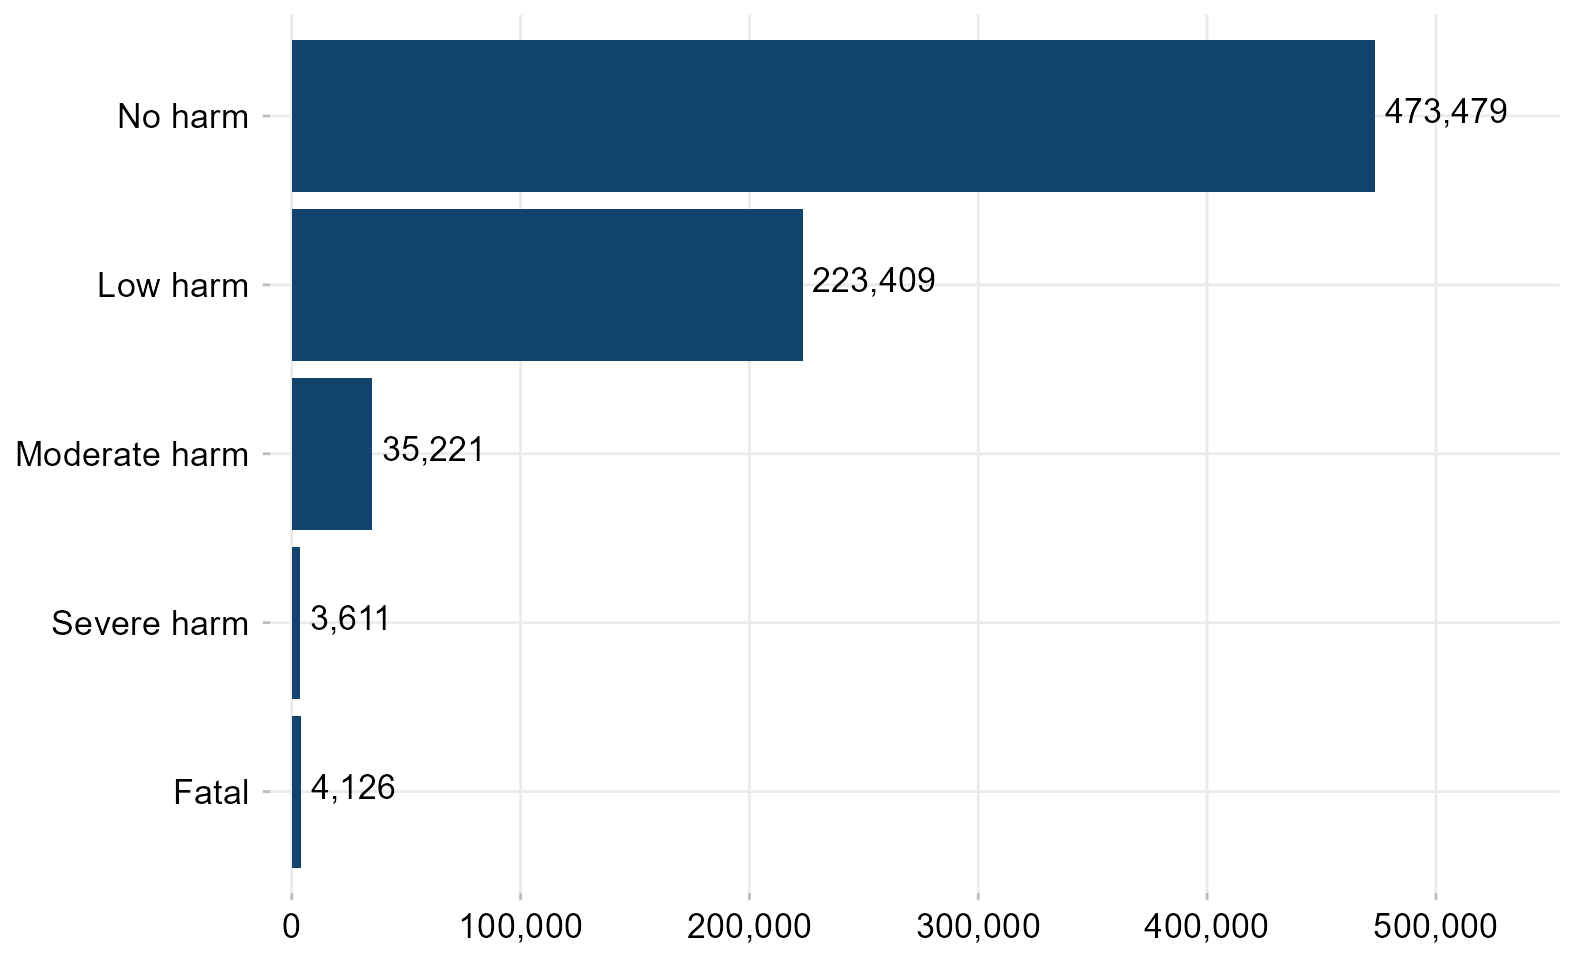
Table 3: Number of patient safety incidents by maximum physical harm
Based on patient safety incidents records submitted between January 2026 and March 2026.
| Maximum level of physical harm | Count of recorded incidents | Percentage |
|---|---|---|
| No harm | 473,479 | 64% |
| Low harm | 223,409 | 30.2% |
| Moderate harm | 35,221 | 4.76% |
| Severe harm | 3,611 | 0.49% |
| Fatal | 4,126 | 0.56% |
| Total | 739,846 | – |
| Note: 64,223 incidents were excluded as they are presumed not to have involved any patients |
6 Recording by service area
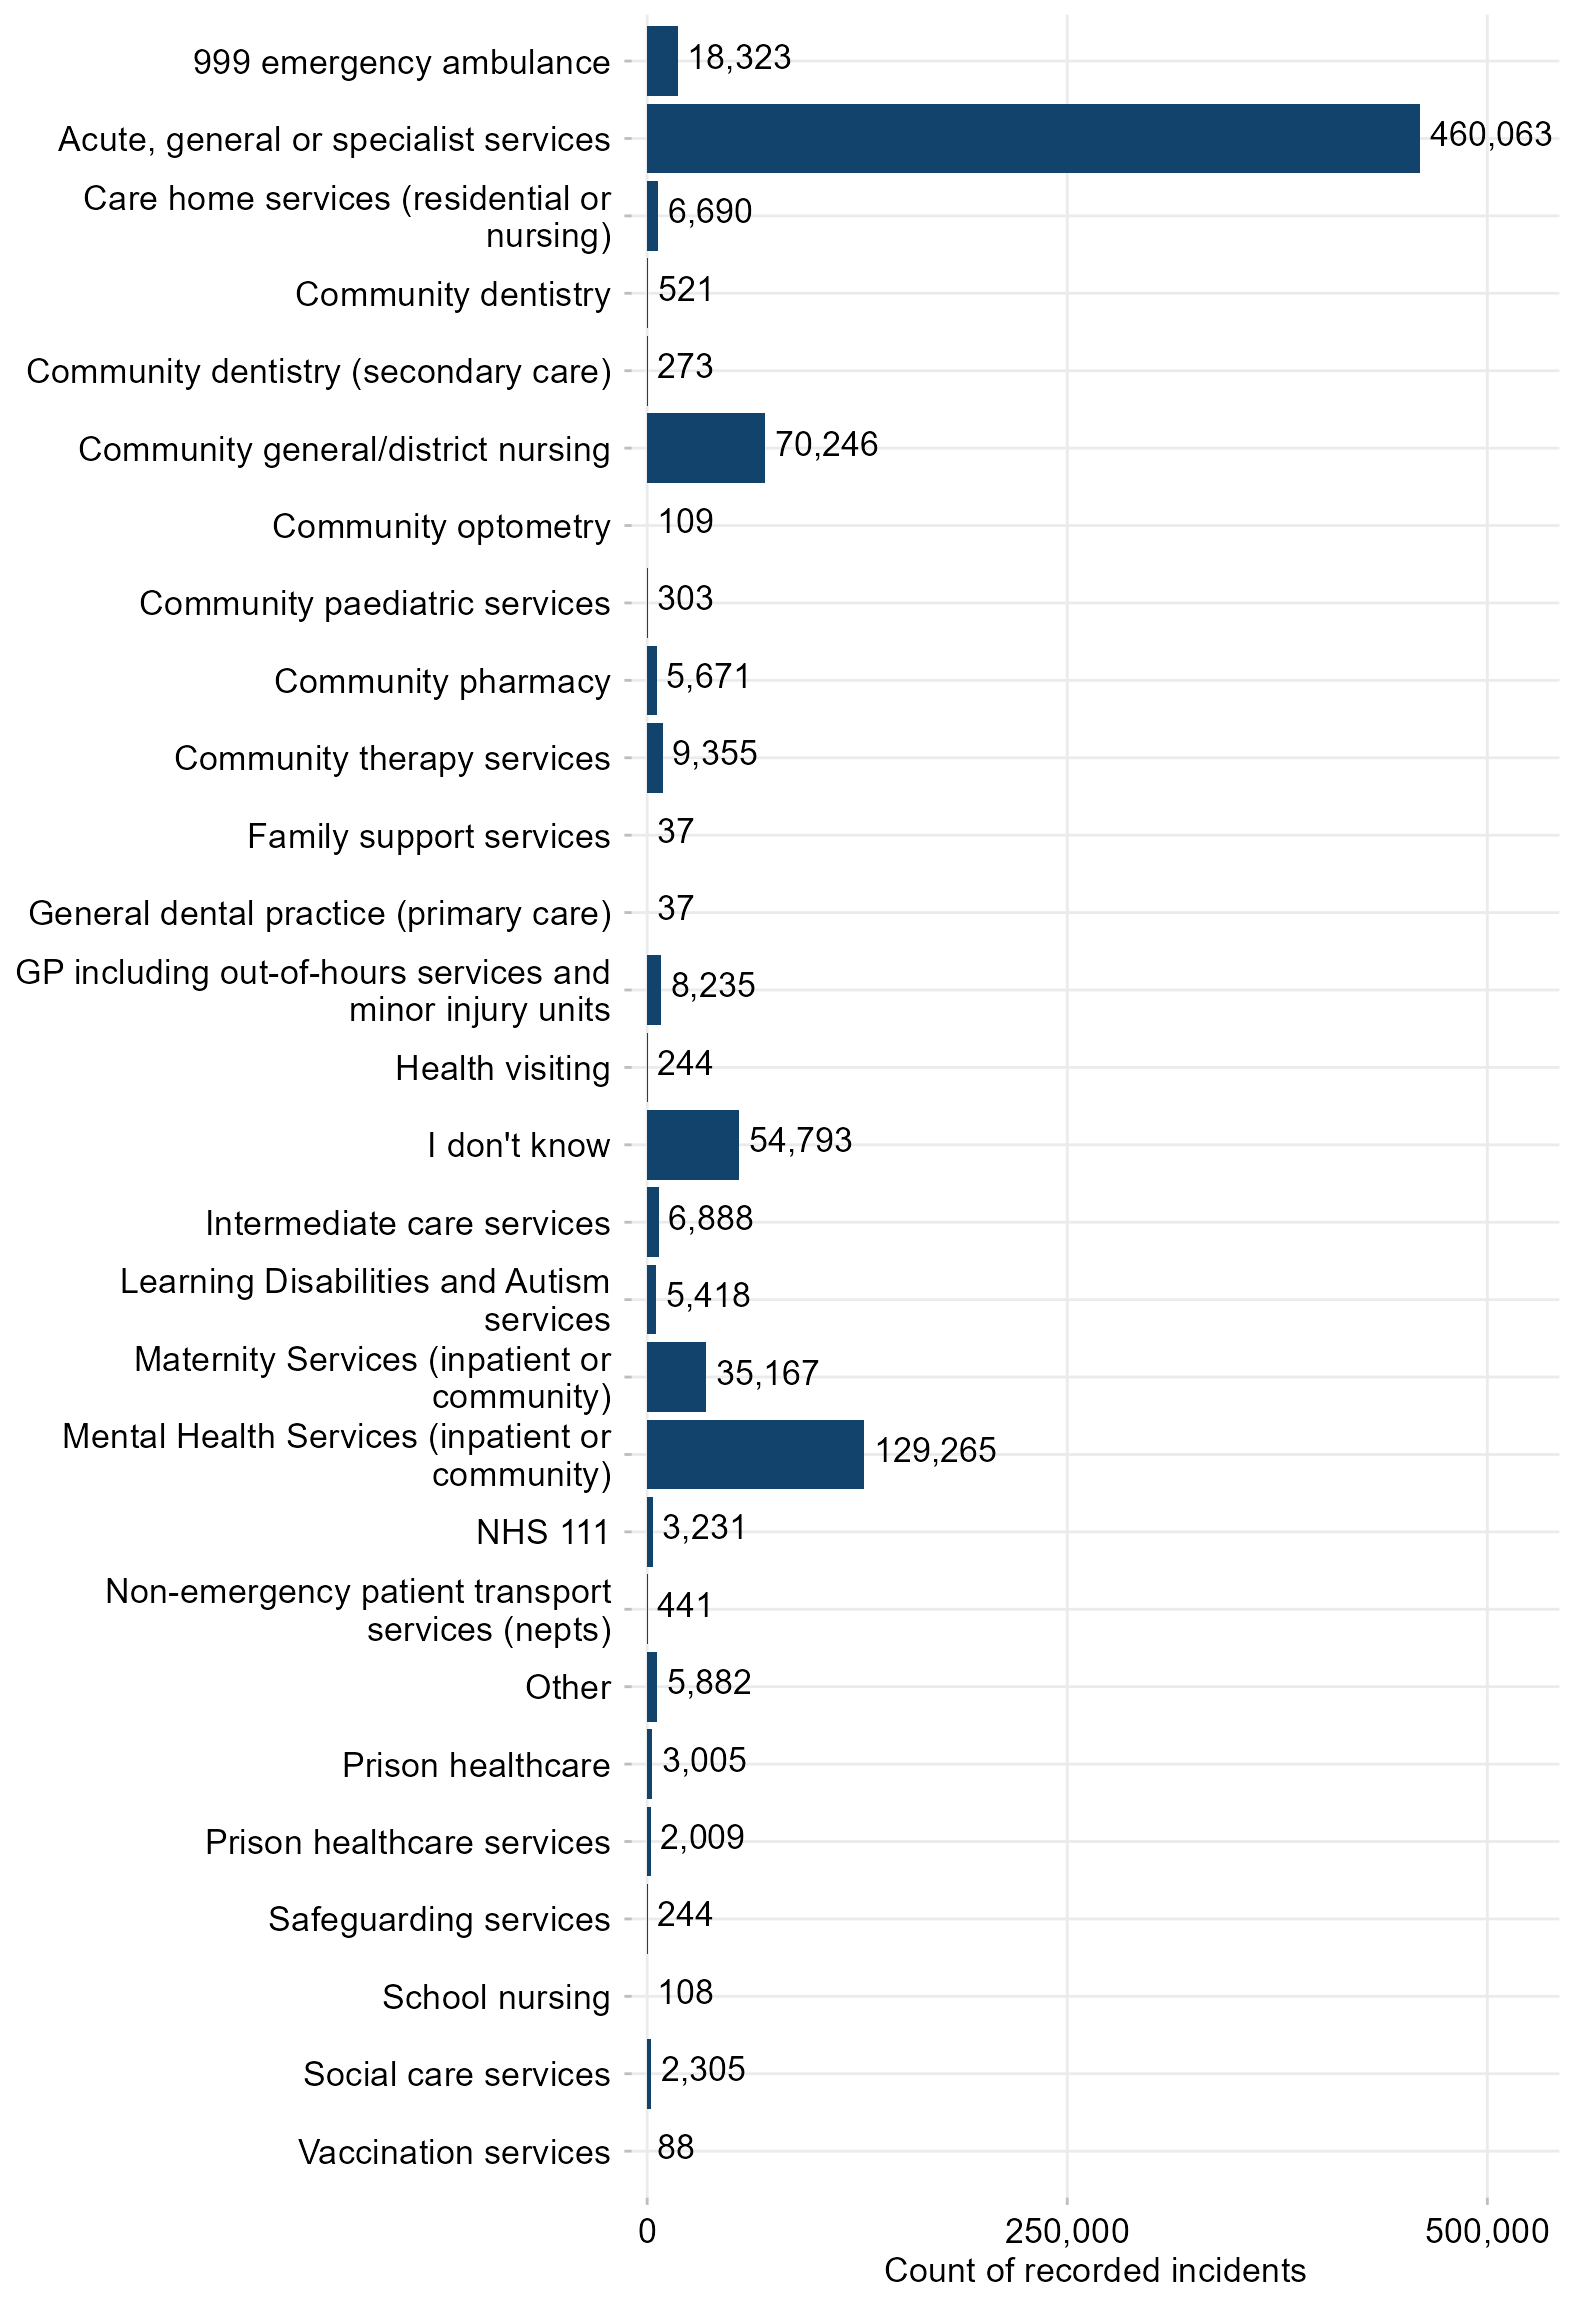
The LFPSE taxonomy (set of questions and answers) is periodically updated based on the insight/value they provide as well as data capture and user experience. This means there will be some variability between the data captured under different versions. In the plot below, we have grouped some granular categories into broader service groups to account for differences in the recording of service areas between version 5 (used by the majority of the LRMS users) and version 6 (used in the online forms).
- ‘Maternity inpatient services’, ‘Maternity community services’ and ‘Maternity services (inpatient or community)’, have been coalesced to ‘Maternity Services (inpatient or community)’
- ‘Mental health community services’, ‘Mental health services (inpatient or community)’ and ‘Mental health inpatient services’, have been coalesced to ‘Mental Health Services (inpatient or community)’
- ‘GP including out-of-hours services and minor injury units’, ‘GP including out-of-hours services’ and ‘Minor injury unit (MIU) / Urgent treatment centre’, have been coalesced to ‘GP including out-of-hours services and minor injury units’
- ‘999 emergency ambulance’, ‘Ambulance and 999’, have been coalesced to ‘999 emergency ambulance’
- ‘LD and Autism services’, ‘Learning Disabilities and Autism services’, have been coalesced to ‘Learning Disabilities and Autism services’
The service area variable can contain multiple responses if the incident occurred in more than one area. As a result, some incidents will be counted more than once, so the figures here cannot be totalled without double-counting records. 799,000 incidents recorded a service area this quarter. The majority of these (57.6%) were recorded under acute, general or specialist services. The remaining were spread primarily across mental health, community, and maternity services. A further 5069 records did not contain a value for service area and are subsequently missing.
Figure 3: Number of incident records by service area
Based on patient safety incidents records submitted between January 2026 and March 2026.
The aggregate data displayed below can be downloaded as a CSV file.
7 Recording by involved agents
The purpose of this variable is to help categorise patient safety events at a general level before reporters add more detail. Involved agents is not a field designed to capture granular incident types, as previously done in the NRLS. The categories in this field are a bespoke list of options used to segment records that are most relevant for NHS England’s data sharing partners (e.g., CQC, MHRA). These categories also serve navigational purposes as users will see specialised questions triggered based on the options they record.
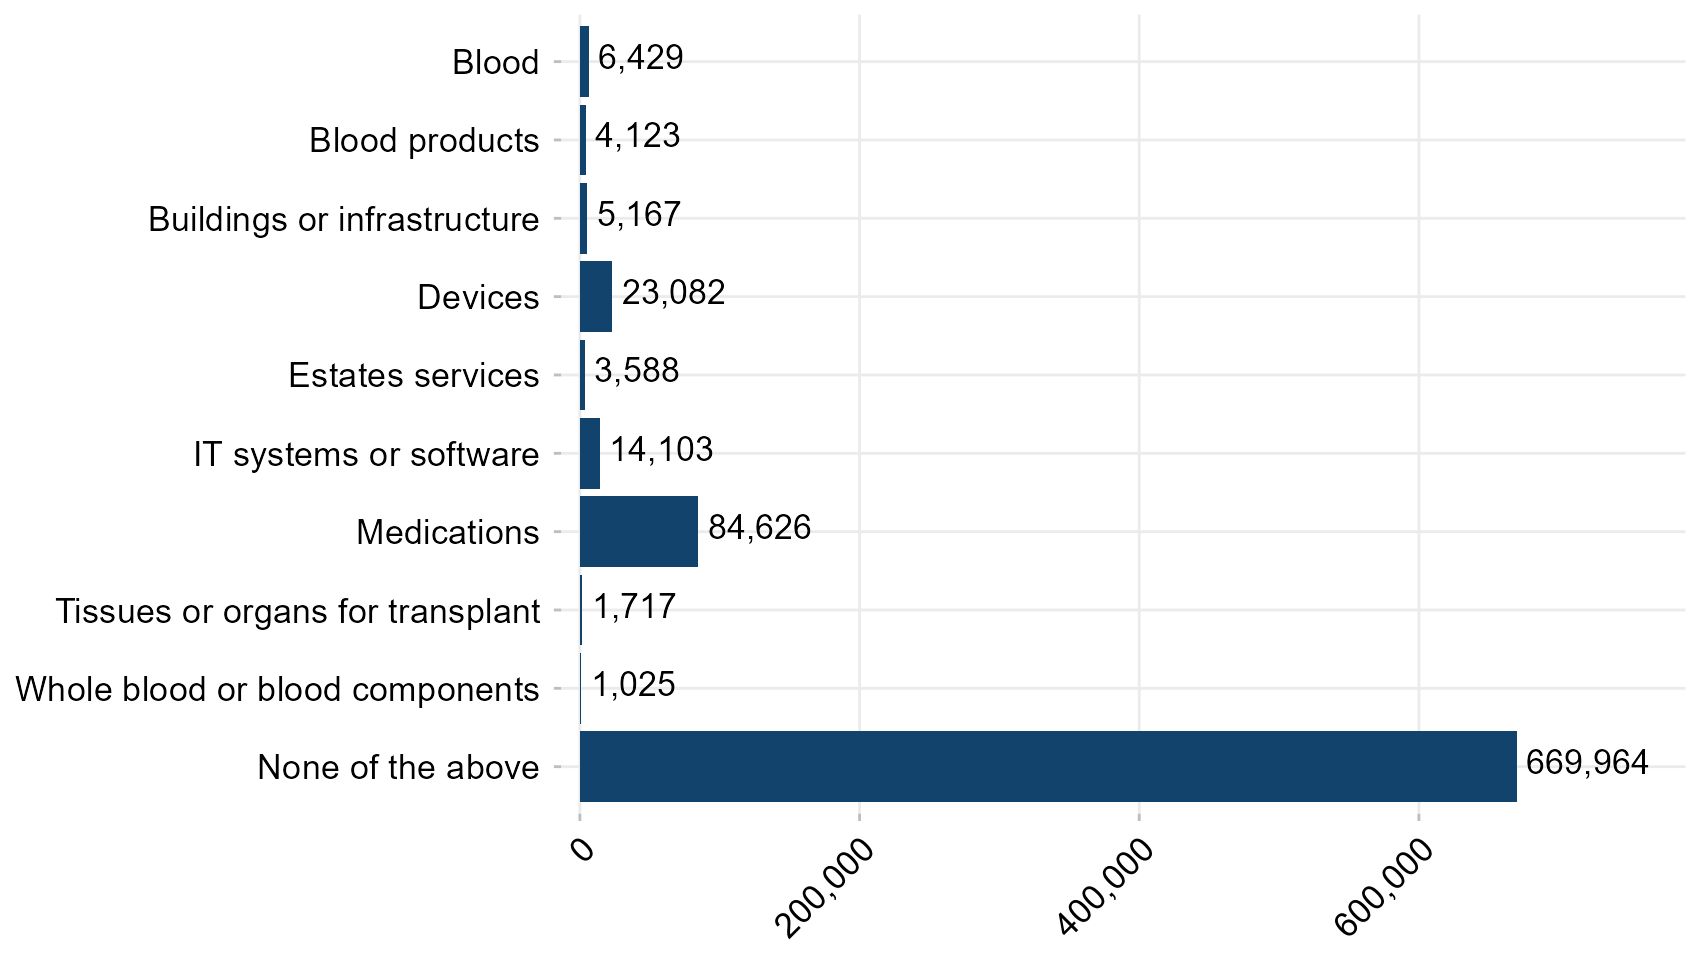
Nonetheless, the breakdowns below can provide an insight of common factors involved in patient safety incidents. There were 804,066 incidents in which a response for this field was recorded, the majority being “none of the above”. This large volume of responses is an expected trend based on the design of the LFPSE. Setting these incidents aside, the most common involved agents recorded this quarter were medications, devices, and IT systems or software (figure 4).
Similar to the service area field, users can select multiple responses in the involved agents field. As a result, some incidents will be counted more than once, so the figures here cannot be totalled without double-counting records. We excluded 3 incidents, as they did not have a response recorded for this field.
Figure 4: Number of incident records by involved agents
Based on patient safety incidents records submitted between January 2026 and March 2026.
The aggregate data displayed below can be downloaded as a CSV file.
8 Recording by safety challenges
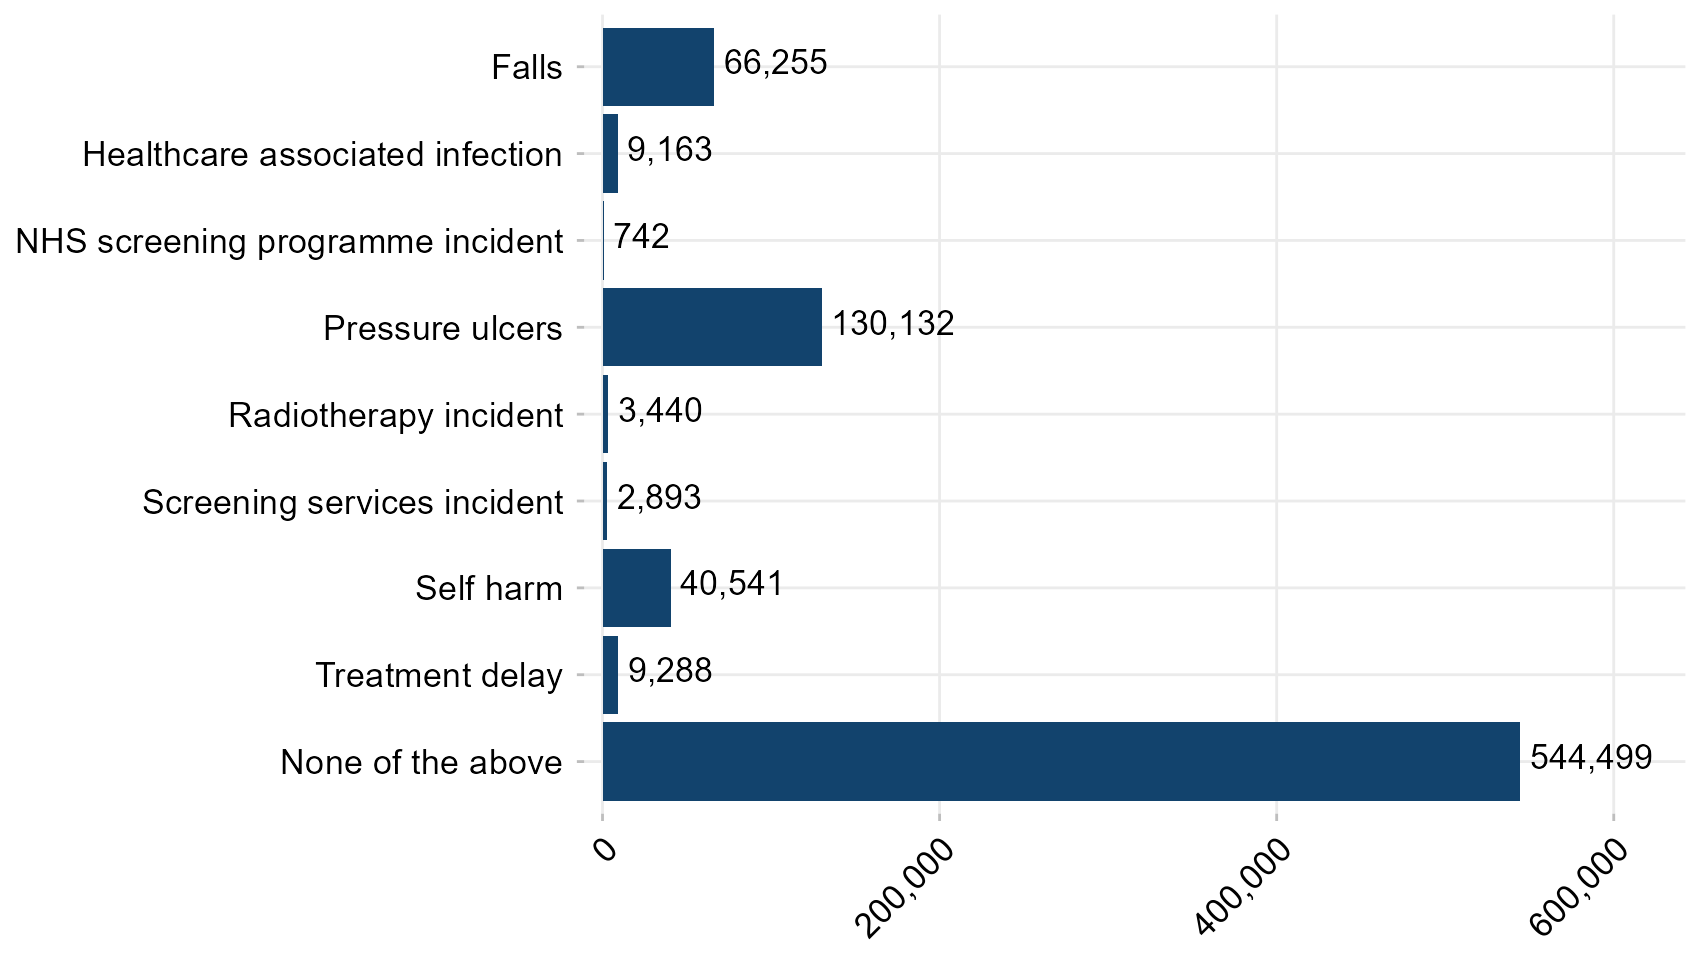
Similar to involved agents, the safety challenges categories within LFPSE acts as a flag for when records relate to pre-existing large or national programmes of work on common safety issues, in order to help segment data for the relevant teams where necessary. If the event does not relate directly to any of these programmes, users would select “none of the above”. During this quarter, 803,123 incidents recorded a response under safety challenges, the majority being “none of the above”. Barring this category, the most common safety challenges recorded were pressure ulcers, falls, and self harm (figure 5).
Similar to the service area field, users can select multiple responses when recording safety challenges. As a result, some incidents will be counted more than once, so the figures here cannot be totalled without double-counting records. We excluded 946 incidents, as they did not have a response recorded for this field.
Figure 5: Number of incident records by safety challenges
Based on patient safety incidents records submitted between January 2026 and March 2026.
The aggregate data displayed below can be downloaded as a CSV file.
9 LFPSE uptake rates
LFPSE operates as a largely voluntary recording system to which some healthcare organisations are contractually obliged to be connected. Connection to the LFPSE allows healthcare providers to share their data with NHS England and other regulatory bodies. Decisions on which events to record are not mandatory, except where recording a death or instance of severe harm fulfils mandatory notification requirements. Providers are encouraged to record as much useful information as possible for national learning. Contractual arrangements to be connected to LFPSE apply to NHS trusts, pharmacies and GP practices.
An organisation is able to record to LFPSE once it is connected (i.e., registered) to the service. The list of NHS trusts and primary care organisations registered with LFPSE in England, as at the end of this quarter, can be downloaded from this CSV file. This is part of our work to describe and investigate trends in incident recording across the entirety of the NHS. This work is experimental but aims to analyse incident recording from organisations in areas such as NHS primary care and, eventually, independent sector NHS-funded care.
Aggregate figures of registered organisations, as well as uptake rates, are shown in table 4. We currently define LFPSE uptake rates as the percentage of organisations recording incidents to LFPSE, out of the total number of organisations open in England for the respective organisation type. The definition of this measure may be subject to change in future reports.
NHS England received 804,069 patient safety incidents in LFPSE between January 2026 and March 2026 (table 1). Most of these incidents (93.6%) were recorded by NHS trusts, totalling 752,570 incidents during this quarter. During the current period, incidents from primary care comprised 5,620 incidents, or 0.7% of all incidents recorded. Primary care incidents were spread across pharmacy (68.3%), general practitioner (GP) practices (27.7%), primary care networks (PCNs, 3.4%), and other primary care providers (0.7%).
Table 4: Participation in LFPSE by NHS trust and primary care providers
Based on patient safety incident records submitted between January 2026 and March 2026.
| Organisation type | All providers in England | No. registered in LFPSE | No. of submitters | Uptake rate | No. of incidents recorded |
|---|---|---|---|---|---|
| NHS trusts | 205 | 205 | 205 | 100.0% | 752,570 |
| Pharmacy | 10,457 | 4,468 | 1,277 | 12.2% | 3,836 |
| GP practices | 6,235 | 3,997 | 573 | 9.2% | 1,554 |
| PCNs | 1,298 | 848 | 80 | 6.2% | 191 |
| Other primary care | – | 230 | 15 | – | 39 |
Notes:
- All providers in England figures are based on NHS England’s Organisation Data Service (ODS) records of open organisations. We have accounted for organisational changes in the NHS trusts category.
- Uptake rate shows the proportion of all active organisations that are currently recording to LFPSE.
- Other primary care is a category assigned to an organisation by LFPSE and its broad nature requires further validation. We will likely break down this category in the future, after checking organisation codes in this group using ODS. We will provide England-wide figures at that point.
10 Organisation level
This CSV contains the number of patient safety incidents recorded, the median lag for recording these incidents, and recording rates for NHS trusts by region and trust type, as taken from the trust accounts consolidation (TAC) data publications. Different measures of provider activity have been used to standardise recording rates across different sectors. Quarterly bed days data was used for acute, mental health, and specialist trusts; whilst care contacts data was used across community trusts, and ambulance contacts for ambulance trusts. We explain the calculation of recording lag and rates for each Trust type below.
During the current period there were 12,396 incidents where an organisation code was not present and therefore an organisation could not be identified – these incidents are thus not included in these counts. There were also 4,151 incidents where the reporting organisation was different to the organisation that the incident actually occurred in, accounting for 0.55% of the incidents reported during this period.
The organisation-level table can be downloaded as a CSV file.
11 Recording lag
Recording lag for patient safety events is measured as the difference in the number of days between the date the patient safety incident occurred and the date that it was recorded to LFPSE. The median lag is then taken to minimise the effect of any outliers (such as events which only become apparent many years after occurring). In the current period there are 39,054 patient safety incidents without an incident occurring date and therefore a lag could not be calculated for these records.
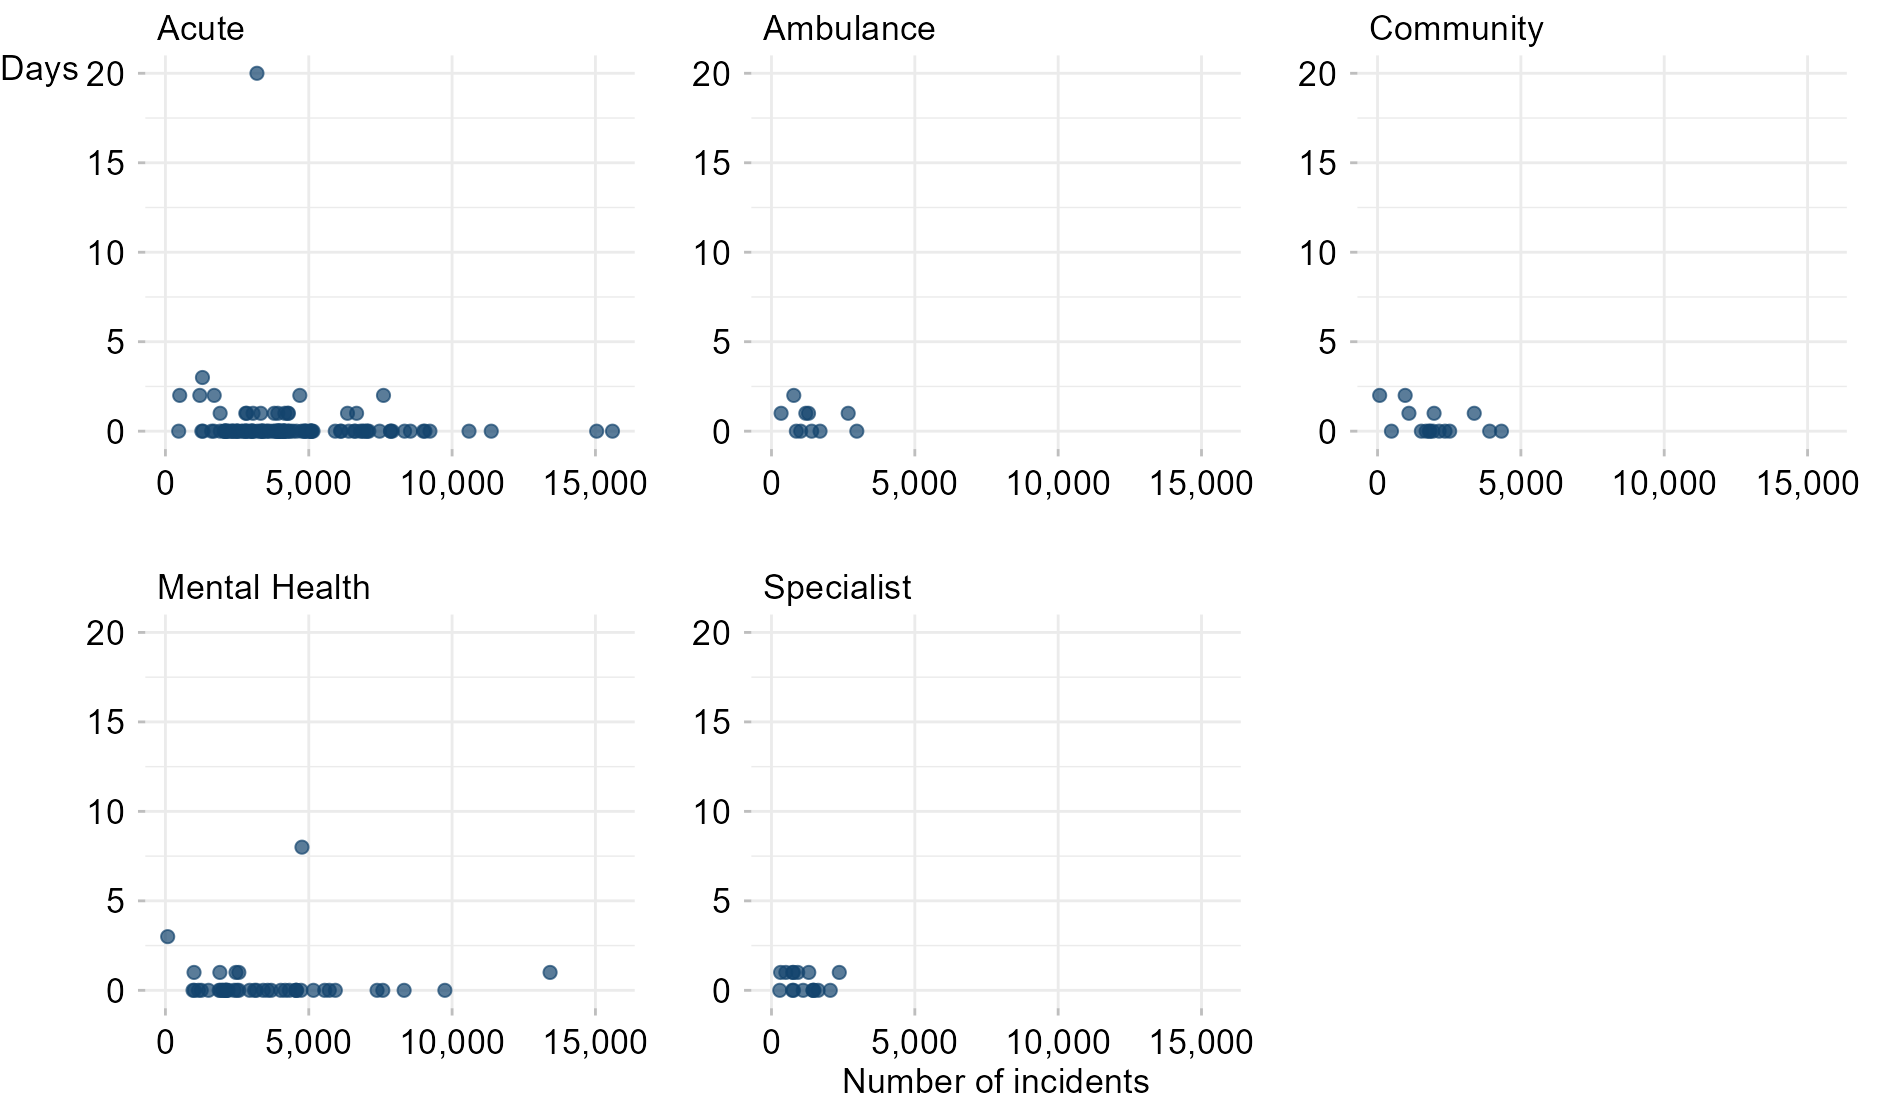
In LFPSE for the current reporting period, the median recording lag was 0 days, with 58.3% of incidents being recorded on the same calendar day that they occurred. For NRLS in the financial year ending March 2022 (the latest period for which data is published), the median recording lag was 20 days. This reduction in lag in LFPSE is due to its live nature, replacing the requirement for providers to manually extract and upload data as was the case for NRLS. The majority of NHS trusts (79%) recording to the LFPSE have a median recording lag of 0 days. For the remainder of organisations, median recording lag ranged from 1 to 20 days.
Figure 6: Median recording lag (in days) versus total number of incidents recorded, per NHS trust
Based on patient safety incident records submitted between January 2026 and March 2026.
12 Recording rates
12.1 Acute, mental health, and specialist trust recording rates
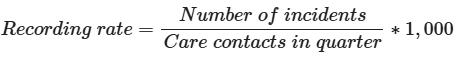
The recording rates for these trust types were calculated using the formula:

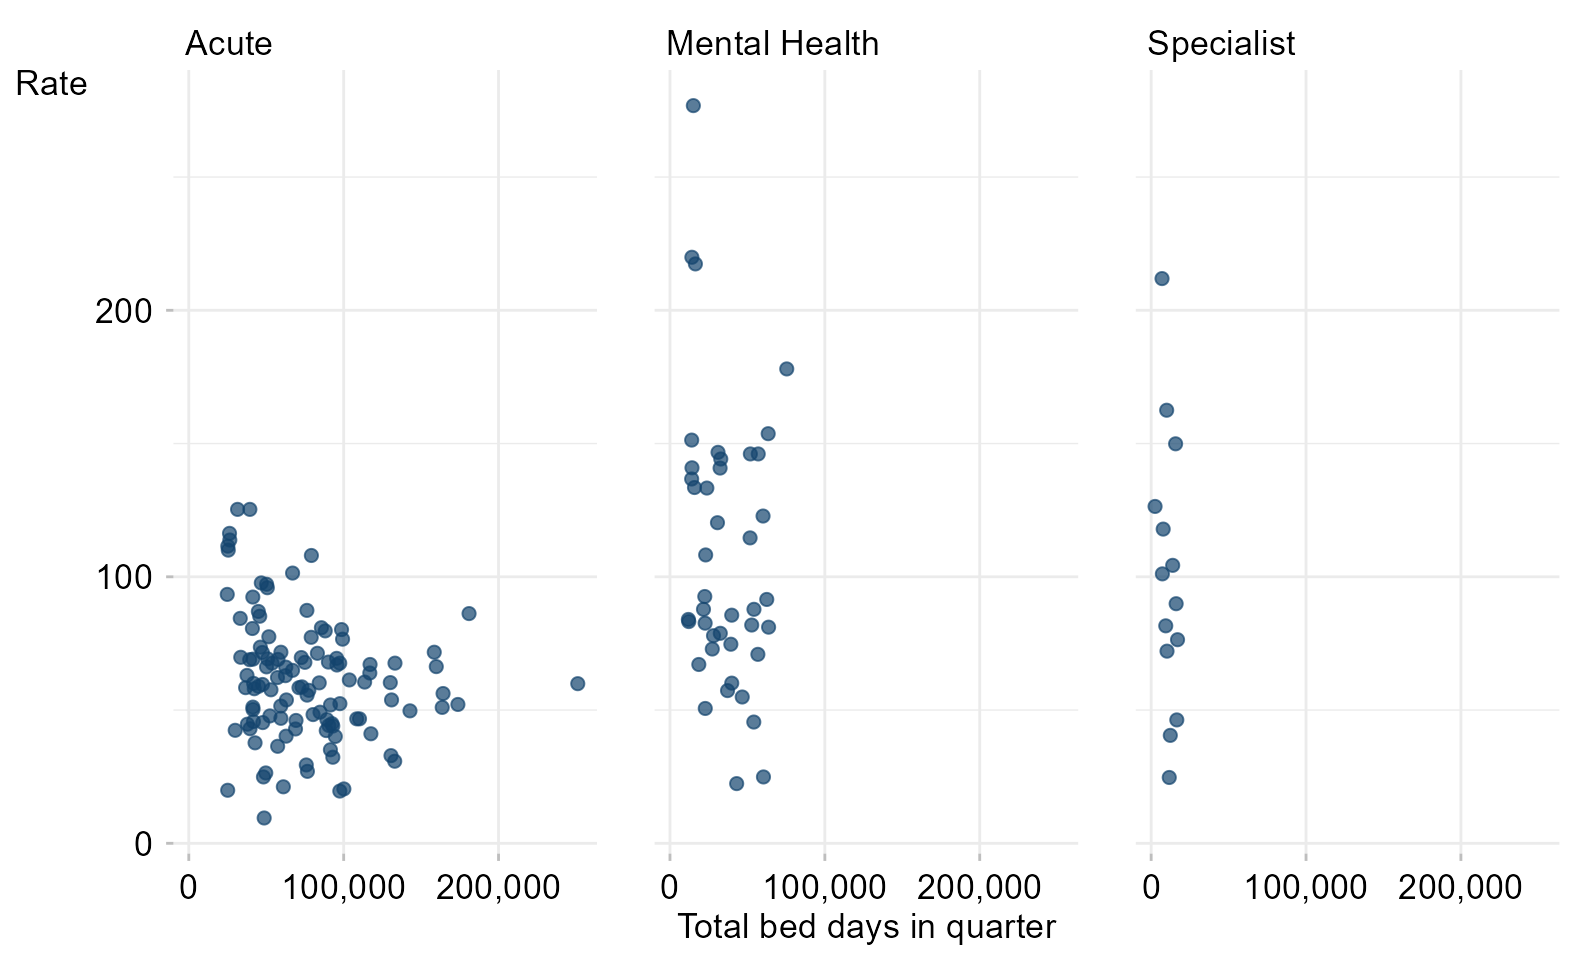
Bed days data is used as a measure to standardise activity across NHS trusts. Overnight bed occupancy figures were extracted from the KH03 mandatory data collection published by NHS England. The average daily number of occupied beds was multiplied by the number of days in the reporting period to obtain quarterly bed day figures for NHS organisations.
There was variation in recording rates across different types of NHS trusts. Recording rates (per 1,000 bed days) ranged from 10 to 125 incidents in acute trusts. In mental health trusts, the range observed was 22 to 277 incidents, whilst the range was 25 to 212 incidents across specialist trusts.
The trusts below were excluded because they are out of scope for submission of beds data – i.e., they do not generally provide consultant-led in-patient services:
- Tavistock and Portman NHS Foundation Trust
- South London and Maudsley NHS Foundation Trust
- Leicestershire Partnership NHS Foundation Trust
The trusts below were excluded as they did not have bed days data available for the reporting period:
- Birmingham Women’s and Children’s NHS Foundation Trust
- East and North Hertfordshire Teaching NHS Trust
- James Paget University Hospitals NHS Foundation Trust
- The Dudley Group NHS Foundation Trust
- University Hospitals of Morecambe Bay NHS Foundation Trust
Moorfields Eye Hospital NHS Foundation Trust submitted bed days data for the reporting period, but is excluded from the recording rate analysis to improve the chart readability.
Isle of Wight NHS Trust is both an acute and an ambulance trust but treated as an acute trust for the purposes of this analysis.
Figure 7: Incident recording rate (per 1,000 bed days) versus total bed days in the quarter, per NHS trust
Based on patient safety incident records submitted between January 2026 and March 2026.
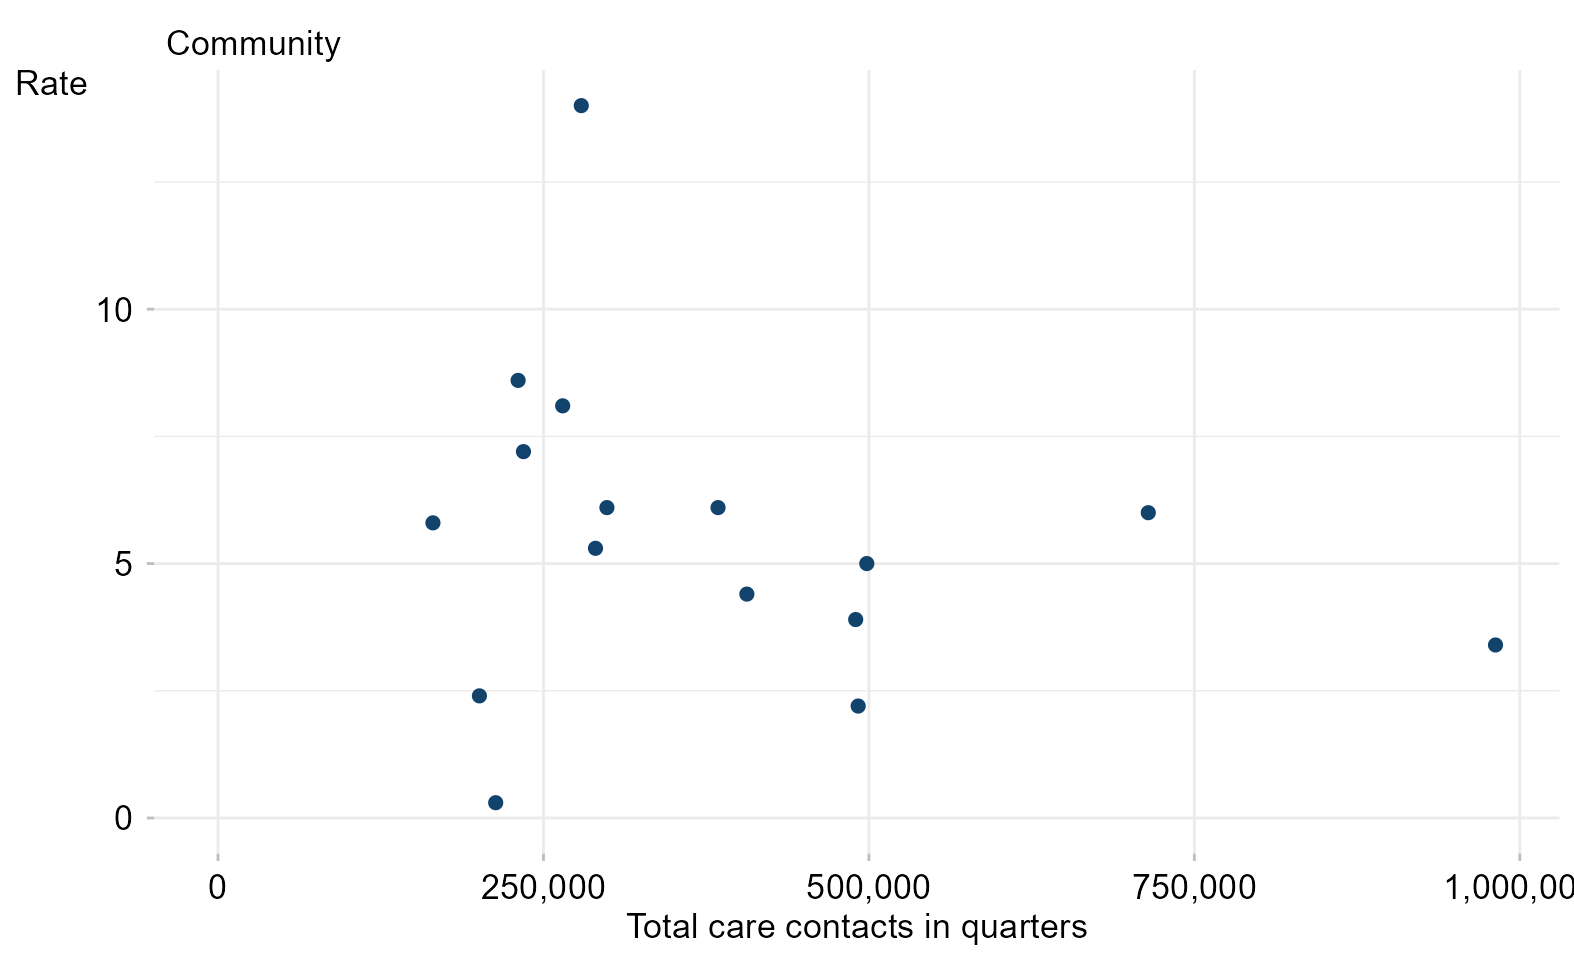
12.2 Community trusts recording rates
The recording rates for each NHS trust were calculated using the formula:
Care contact data is used as a measure to standardise activity across community NHS trusts. Care contact figures were extracted from the Community Service Statistics published by NHS England.
A care contact is defined as any clinical, social or public health activity concerned with the prevention, investigation or treatment of illness and the alleviation of suffering of an individual.
Recording rates varied in this sector from 0 to 14 incidents per 1,000 care contacts.
Figure 8: Incident recording rate (per 1,000 care contacts) versus total care contacts in the quarter, per NHS trust
Based on patient safety incident records submitted between January 2026 and March 2026.
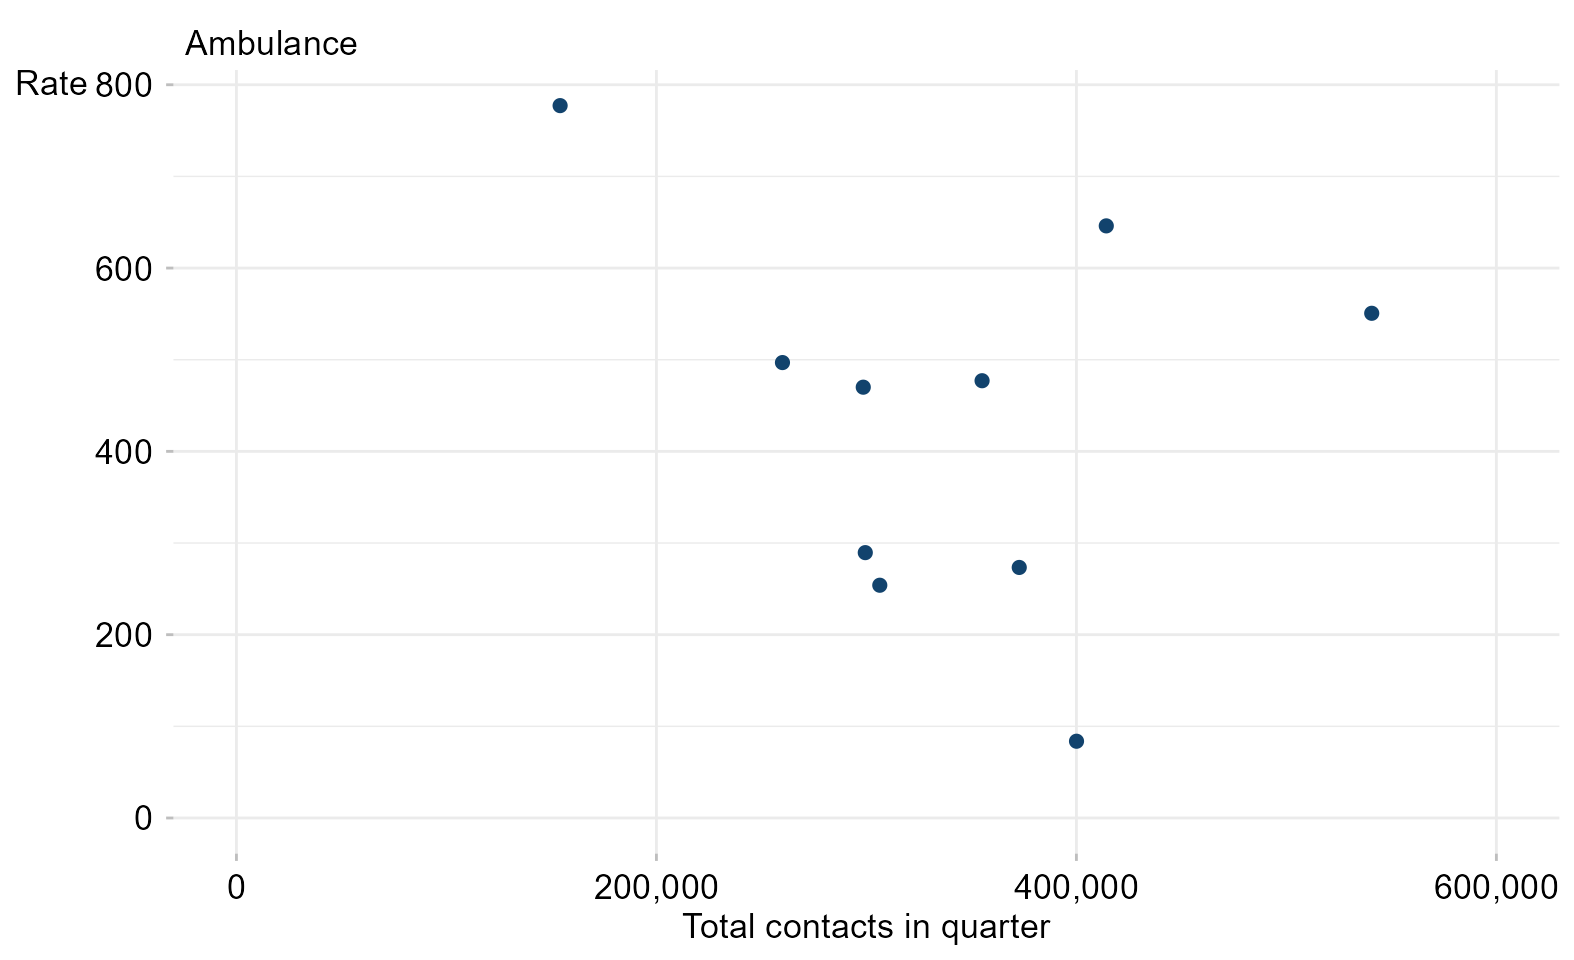
12.3 Ambulance trust recording rates
The recording rates for each NHS trust were calculated using the formula:

Ambulance contact data is used as a measure to standardise activity across ambulance NHS trusts. Ambulance contact figures were extracted from the Ambulance Quality Indicators published by NHS England.
Recording rates varied in this sector from 84 to 777 incidents per 100,000 ambulance contacts.
Figure 9: Incident recording rate (per 100,000 ambulance contacts) versus total ambulance contacts in the quarter, per NHS trust
Based on patient safety incident records submitted between January 2026 and March 2026.
13 Feedback
Your feedback is welcome on the format, frequency and utility of this document, so that we can provide reports that are of most benefit. Please contact patientsafety.analysis@nhs.net with any suggestions.
The analysts with overall responsibility for this report are:
Joshua Mutio
Lead Analyst
Patient Safety, Medical Directorate Programmes
Data & Analytics
NHS England
Juan Sebastian Gonzalez-Martinez
Analyst
Patient Safety, Medical Directorate Programmes
Data & Analytics
NHS England
Matthew Webb
Analytical Officer
Patient Safety, Medical Directorate Programmes
Data & Analytics
NHS England